
News & AnalysisCareer

Aave (AAVE) slips below $161 on Wednesday after surging more than 10% the previous day, with on-chain data suggesting increased profit-taking. Meanwhile, Aave founder Stani Kulechov is considering an AAVE token-burn mechanism under Aavenomics 3.0, adding a potential catalyst for AAVE.

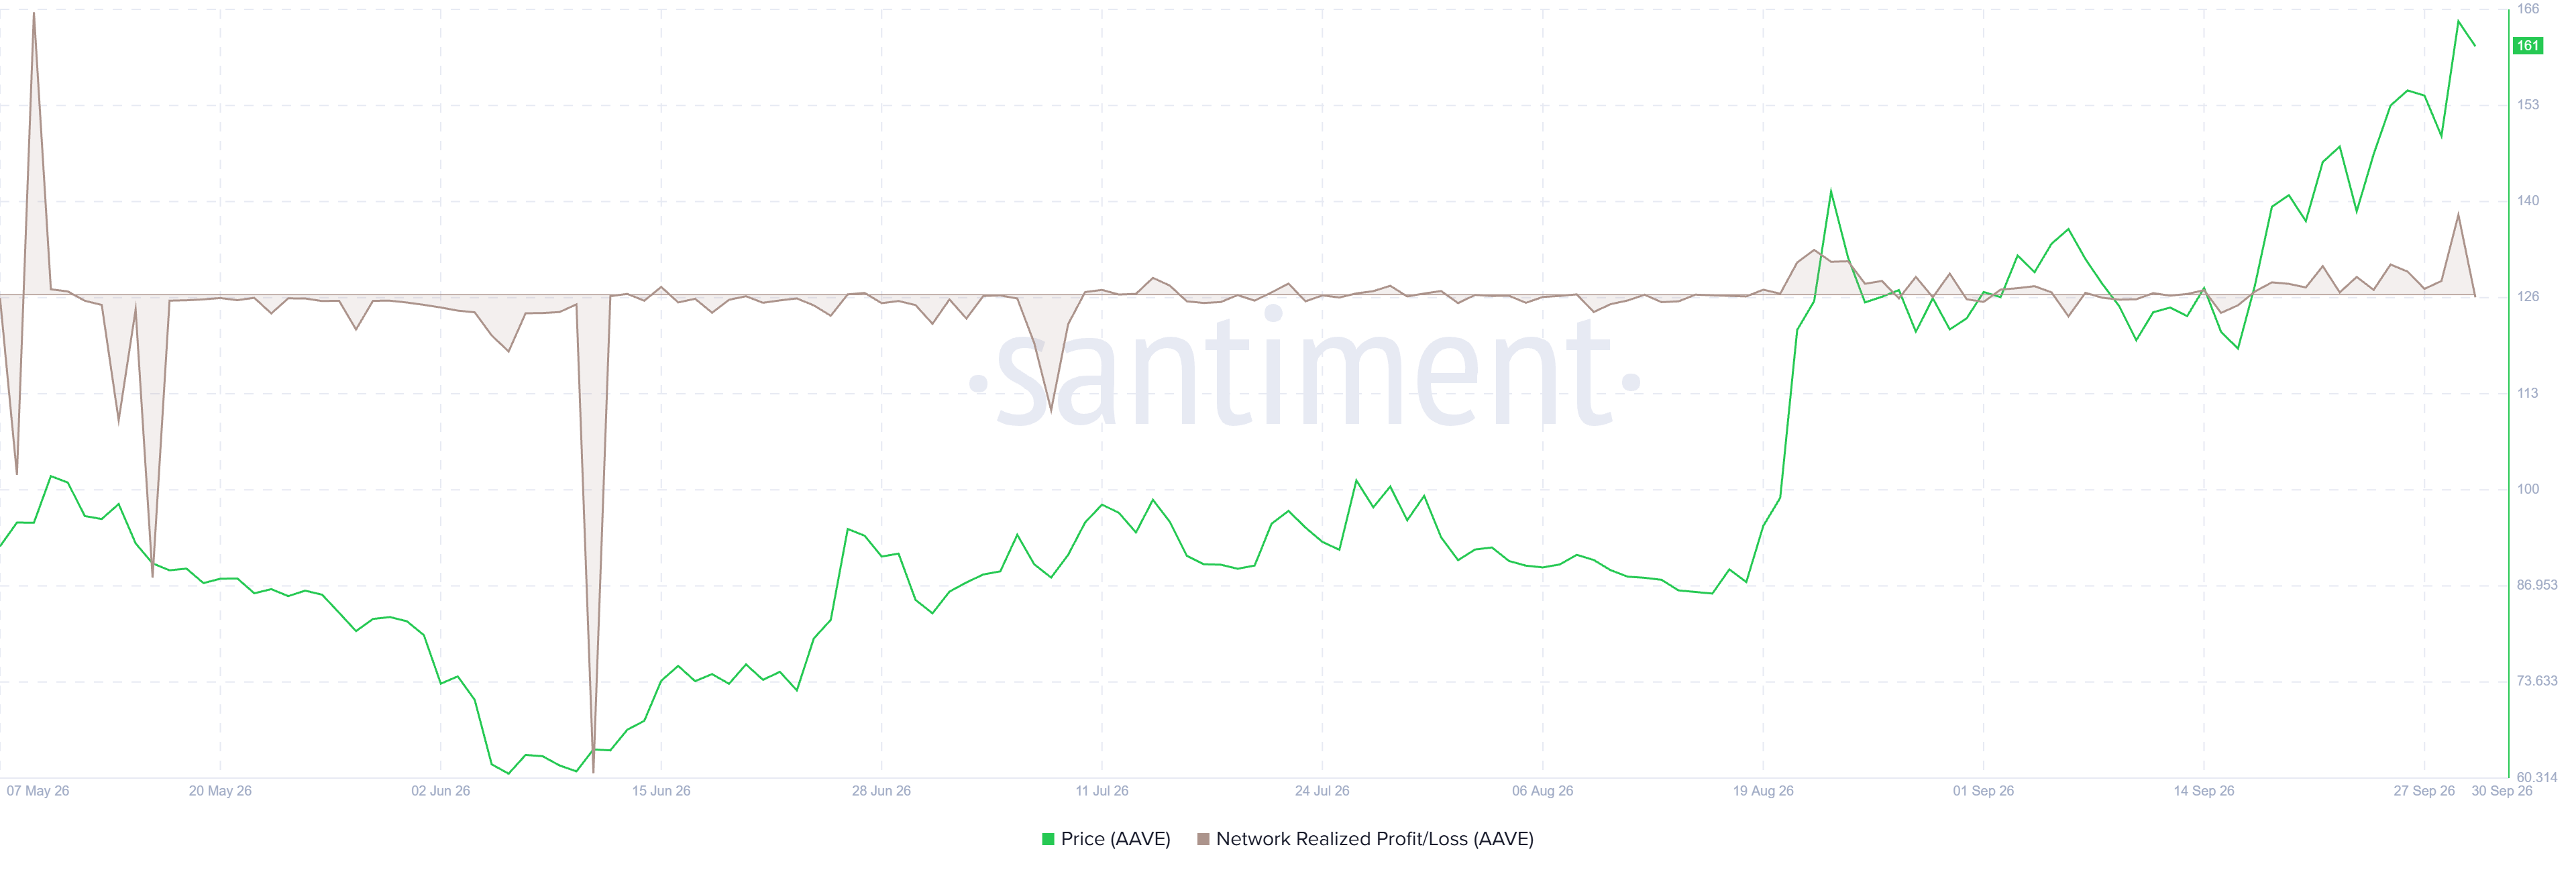
Santiment’s Network Realized Profit/Loss (NPL) metric indicates Aave holders are booking profits following its recent price surge.
As shown in the chart below, the metric spiked sharply on Tuesday, reaching its highest level since early May. This spike indicates that holders are, on average, selling their bags at a significant profit, thereby increasing the selling pressure.
Despite sharp profit-taking, the market sentiment remains bullish for AAVE. Aave founder Stani Kulechov said on Monday that he is considering adding an AAVE token-burn mechanism to Aavenomics 3.0, building on the protocol’s existing revenue-funded buyback program launched in 2025. This proposal could further strengthen AAVE’s tokenomics by reducing the circulating supply alongside the existing buyback mechanism, supporting the bullish long-term outlook.
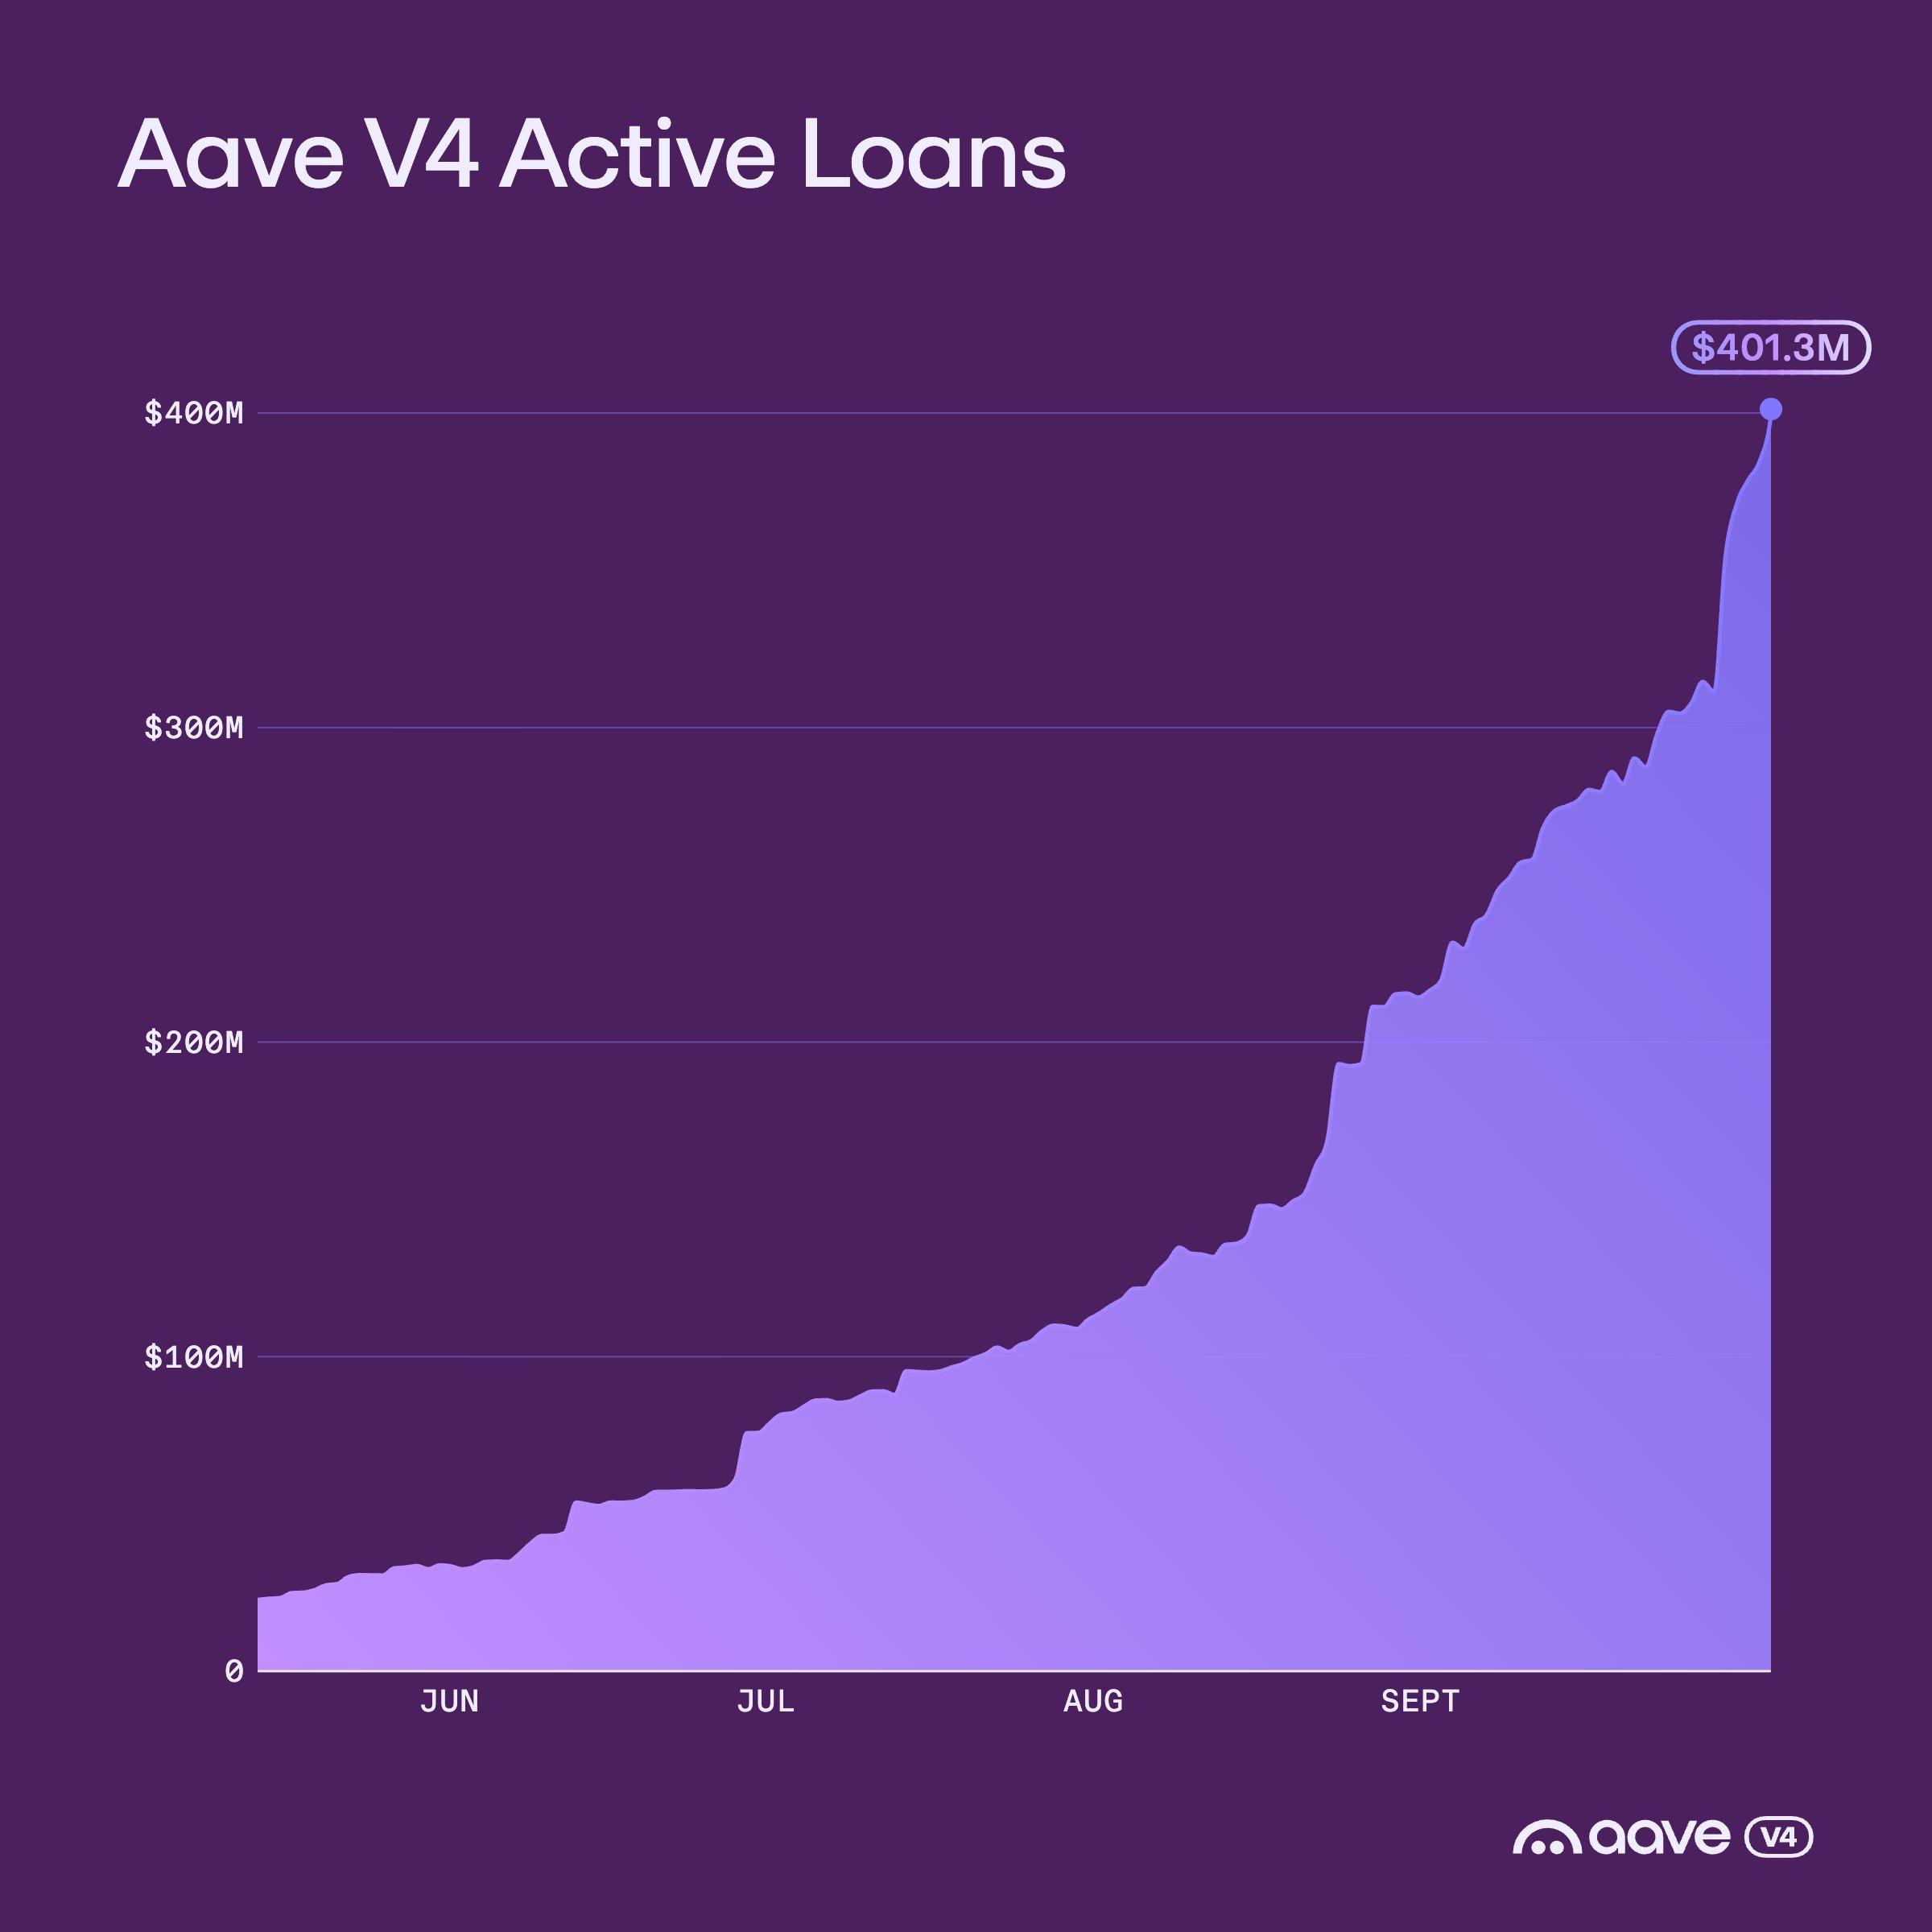
In addition, Aave posted on its X account on Wednesday that its V4 crossed $400 million in active loans, further highlighting strengthening demand and growing activity.
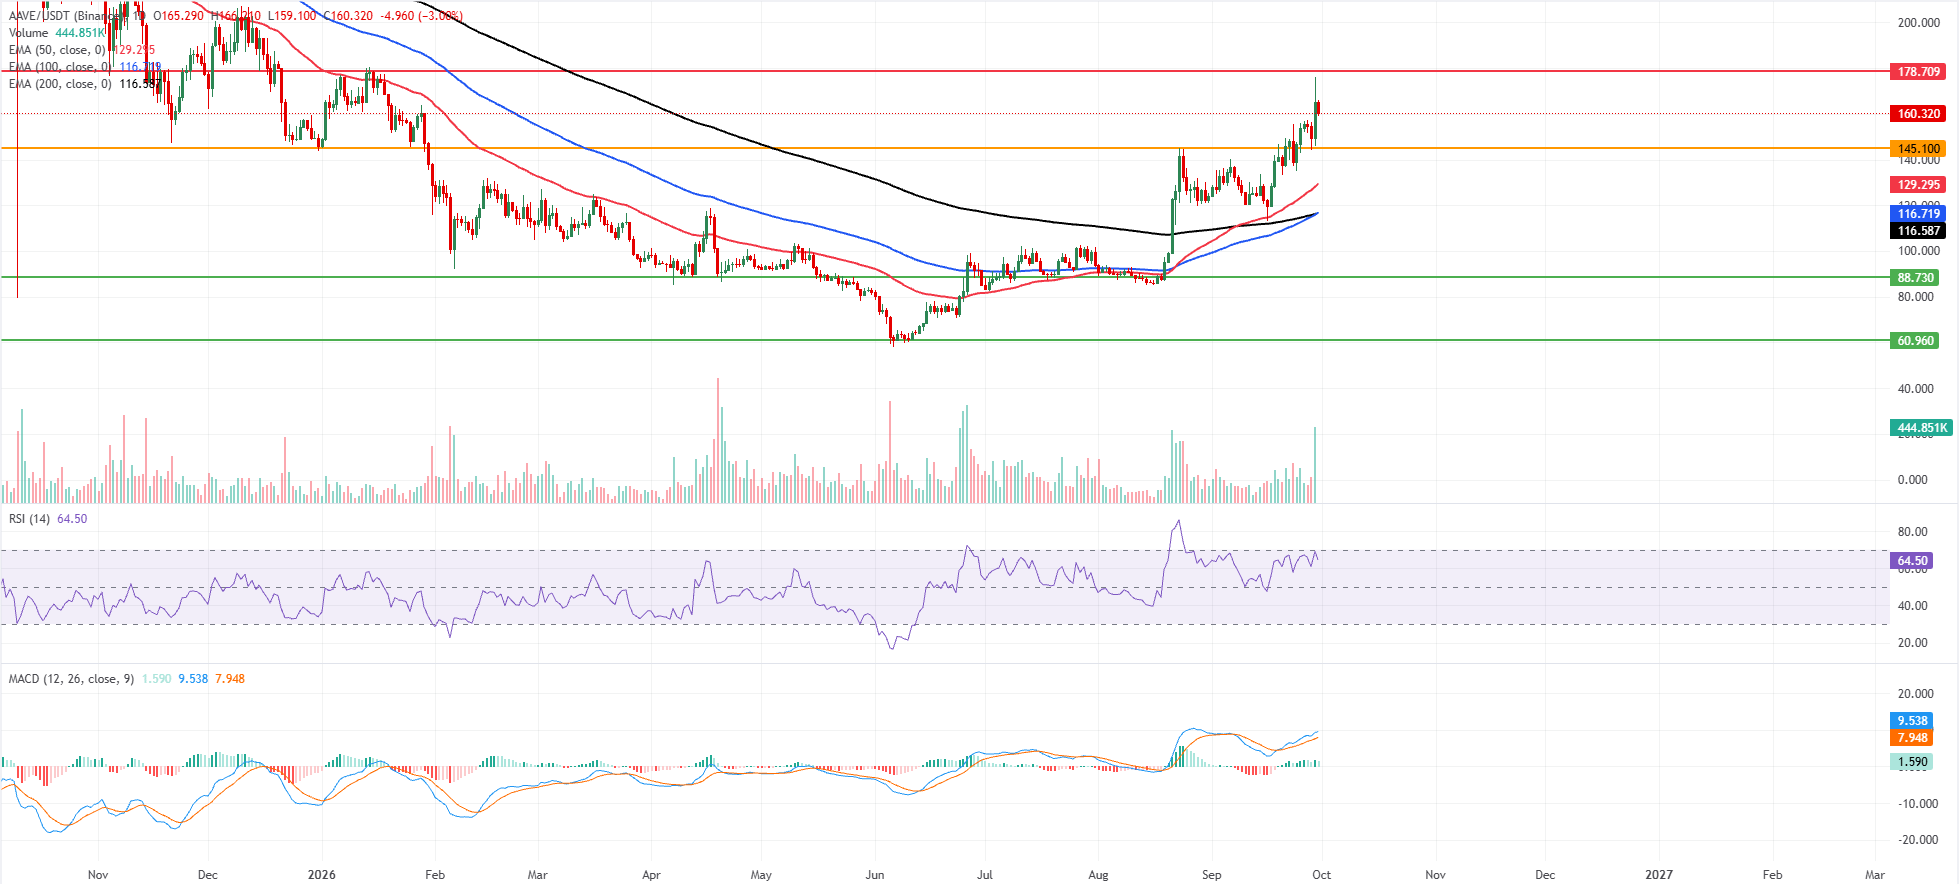
Aave price trades at $160.23 on Wednesday, maintaining a bullish near-term bias as price holds above the 50-day, 100-day and 200-day Exponential Moving Averages (EMAs), clustered between roughly $116.60 and $129.30.
The horizontal level at $145.10 underpins the recent breakout phase. At the same time, the Relative Strength Index (RSI) at 64 remains in bullish territory without reaching overbought, and the Moving Average Convergence Divergence (MACD) remains positive, suggesting upward momentum is still constructive.
On the topside, immediate resistance is seen at the horizontal barrier near $178.71, where buyers could face profit-taking.
On the downside, initial support appears at $145.10, followed by the 50-day EMA at $129.29 and then the 100-day and 200-day EMAs around $116.72 and $116.59, which together form a deeper demand zone; below these, older structural supports at $88.73 and $60.96 sit far beneath the current market price and would come into focus only in the event of a sharp reversal.
(The technical analysis of this story was written with the help of an AI tool. Know more.)







Phone: +61 2 8036 8388
Fax: +61 2 8036 8388
Email: support@tmgm.com



The information provided on this website is of a general nature only and does not constitute personal financial advice. Before acting on any information on this website, you should consider the suitability of the information in relation to your objectives, financial situation and needs. Investing in CFDs and FX Margin Contracts carries significant risks and is not suitable for all investors. You may lose more than your initial deposit. You do not own, or have, any interest in the underlying asset. We recommend that you seek independent advice and ensure you fully understand the risks involved before trading. It is important that you read and consider the disclosure document before you acquire any product listed on the website. The information and advertisements offered on this website are not intended for use by any person in any country or jurisdiction where such use would be contrary to local laws and regulations. The Products and Services offered on this website are not intended for residents of the United States, Malaysia and Thailand.
TMGM is authorized and regulated in various jurisdictions.
Trademax Australia Limited, trading as TMGM, is regulated by the Australian Securities and Investments Commission (ASIC), AFSL no. 436416 and is located at Level 28, One International Tower, 100 Barangaroo Avenue, 2000 Sydney, NSW Australia.
Email: support@tmgm.com.au
Trademax Global Limited, trading as TMGM, is authorized and regulated by the Vanuatu Financial Services Commission (VFSC), registration number 40356 and registered at 1276, Kumul Highway, Port Vila, Vanuatu, Republic of Vanuatu.
Email: support@tmgm.com
Trademax Global Markets (SE) Limited, trading as TMGM, is authorized and regulated by the Financial Services Authority (FSA) of Seychelles, with license number SD224. The company is registered at Office No 13, Providence Estate ABIS Centre, Mahe, Seychelles.
Email: support@tmgm.com
Trademax Global Markets (International) Pty Ltd, trading as TMGM, is authorized and regulated by the Financial Services Commission, Mauritius (FSC) with license no. GB22201012, and registered at 33, Edith Cavell Street C/o IQ EQ Fund Services (Mauritius) Ltd Port Louis, 11324 Mauritius.
Email: support@tmgm.com
Copyright © TMGM. All rights reserved


