
News & AnalysisCareer

Below $75,000, Bitcoin (BTC) reflects mounting selling pressure across cryptocurrency markets on Tuesday. Ethereum (ETH) is also slipping towards $2,100, while Ripple (XRP) remains just under immediate resistance at $1.10.
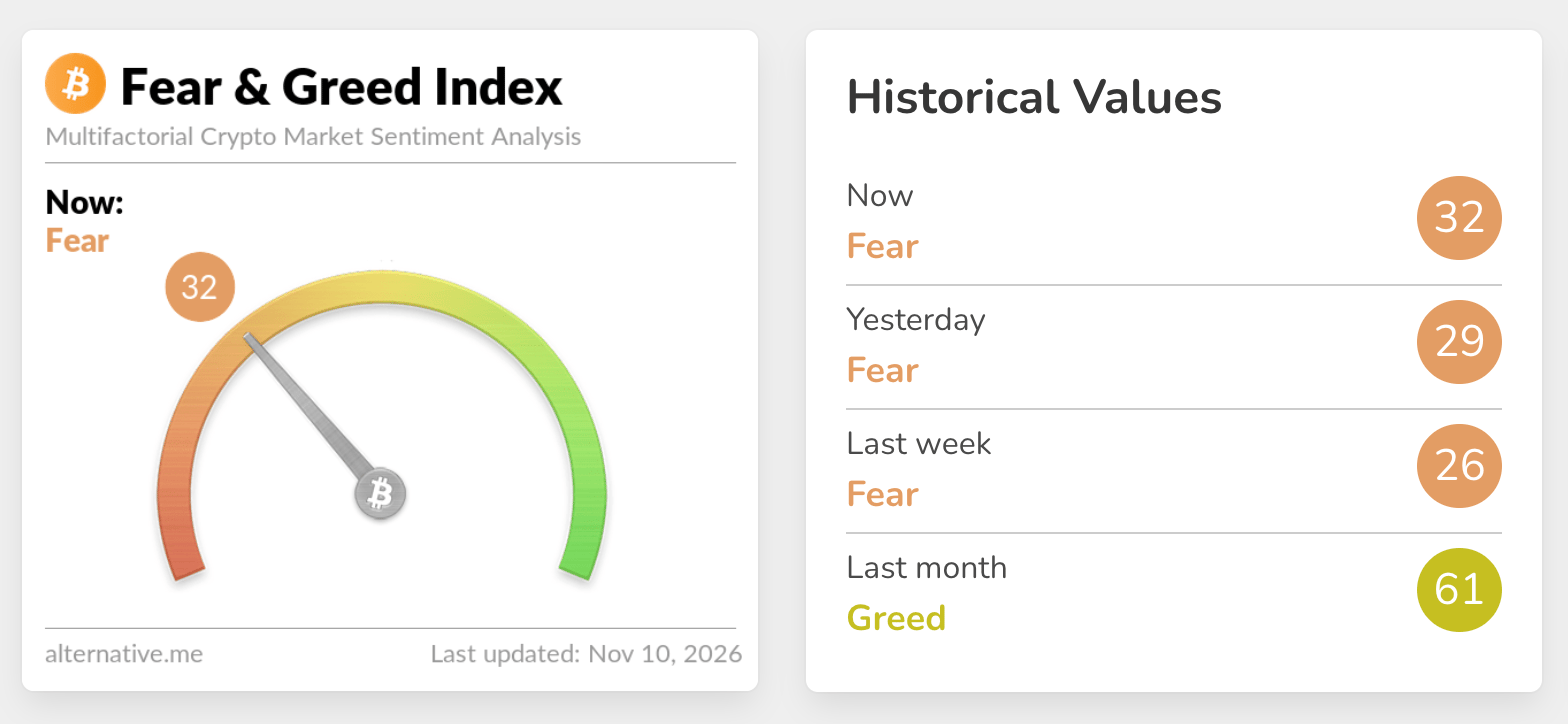
At 32 on Tuesday, the Fear & Greed Index remains in Fear territory, although it has edged up from 29 in the same category a day earlier. Demand for crypto-related digital investment products continues to take a back seat. The wider retreat from last month’s reading of 61, when the index was in Greed territory, underlines the risk-off mood.

Due later on Tuesday from the Bureau of Labor Statistics (BLS), the United States (US) Consumer Price Index (CPI) report is the next focus for the wider crypto market. As a key measure of inflation, it informs the Federal Reserve’s (Fed) monetary policy decisions.
For October, economists polled by Dow Jones and Bloomberg forecast a 0.3% increase in CPI. They expect a month-on-month rise of 0.2% in core CPI, which strips out volatile food and energy prices.
The release precedes the Fed’s December interest rate decision. Market participants widely anticipate a 25 basis-point interest rate move, following October’s decision to leave rates at 3.75-4.00%.
At $74,743, Bitcoin remains in a corrective phase, with its position beneath the key Exponential Moving Averages (EMAs) maintaining a bearish short-term outlook. Overhead resistance comes from the 200-day EMA at $76,457, the 100-day EMA near $77,575 and the 50-day EMA around $79,141. Their positioning calls the broader uptrend structure into question, while the SuperTrend line at $81,375 provides an additional ceiling.
Occasional rebounds have yet to dispel the downward pressure: the Relative Strength Index (RSI) is close to 36, and the Moving Average Convergence Divergence (MACD) remains negative. Together, these indicators point to continued weakness in momentum.
The first resistance hurdle is the 200-day EMA around $76,457, ahead of the 100-day EMA at $77,575. Only a sustained break above the latter would relieve immediate selling pressure. Beyond these levels, the 50-day EMA near $79,141 and SuperTrend resistance at $81,375 define a wider supply zone, likely to restrain rebounds unless buyers firmly reassert control.
The daily chart offers no notable support levels. Unless Bitcoin recovers above these moving averages, the balance of risk therefore favours further losses or another test of lower levels towards $70,000.
In an analysis report sent by email, Crypto Finance said, "Should the macro backdrop improve, we would expect BTC to retest $76,300 first, followed by $78,700. On the downside, the market remains fragile, with limited support below $73,700," and added, "A break lower would bring the August 2026 levels back into focus, with the psychological $70,000 mark the key level to watch."
At $2,113, Ethereum remains below the $2,229 break point of its rising support trendline and well beneath the 200-day EMA at $2,301, leaving the short-term outlook clearly bearish. Potential recoveries face further obstacles at the 100-day EMA of $2,333, the 50-day EMA of $2,361 and SuperTrend resistance near $2,391. With MACD still negative and RSI only just above oversold territory, downward pressure appears persistent, although short-covering rebounds remain a risk.
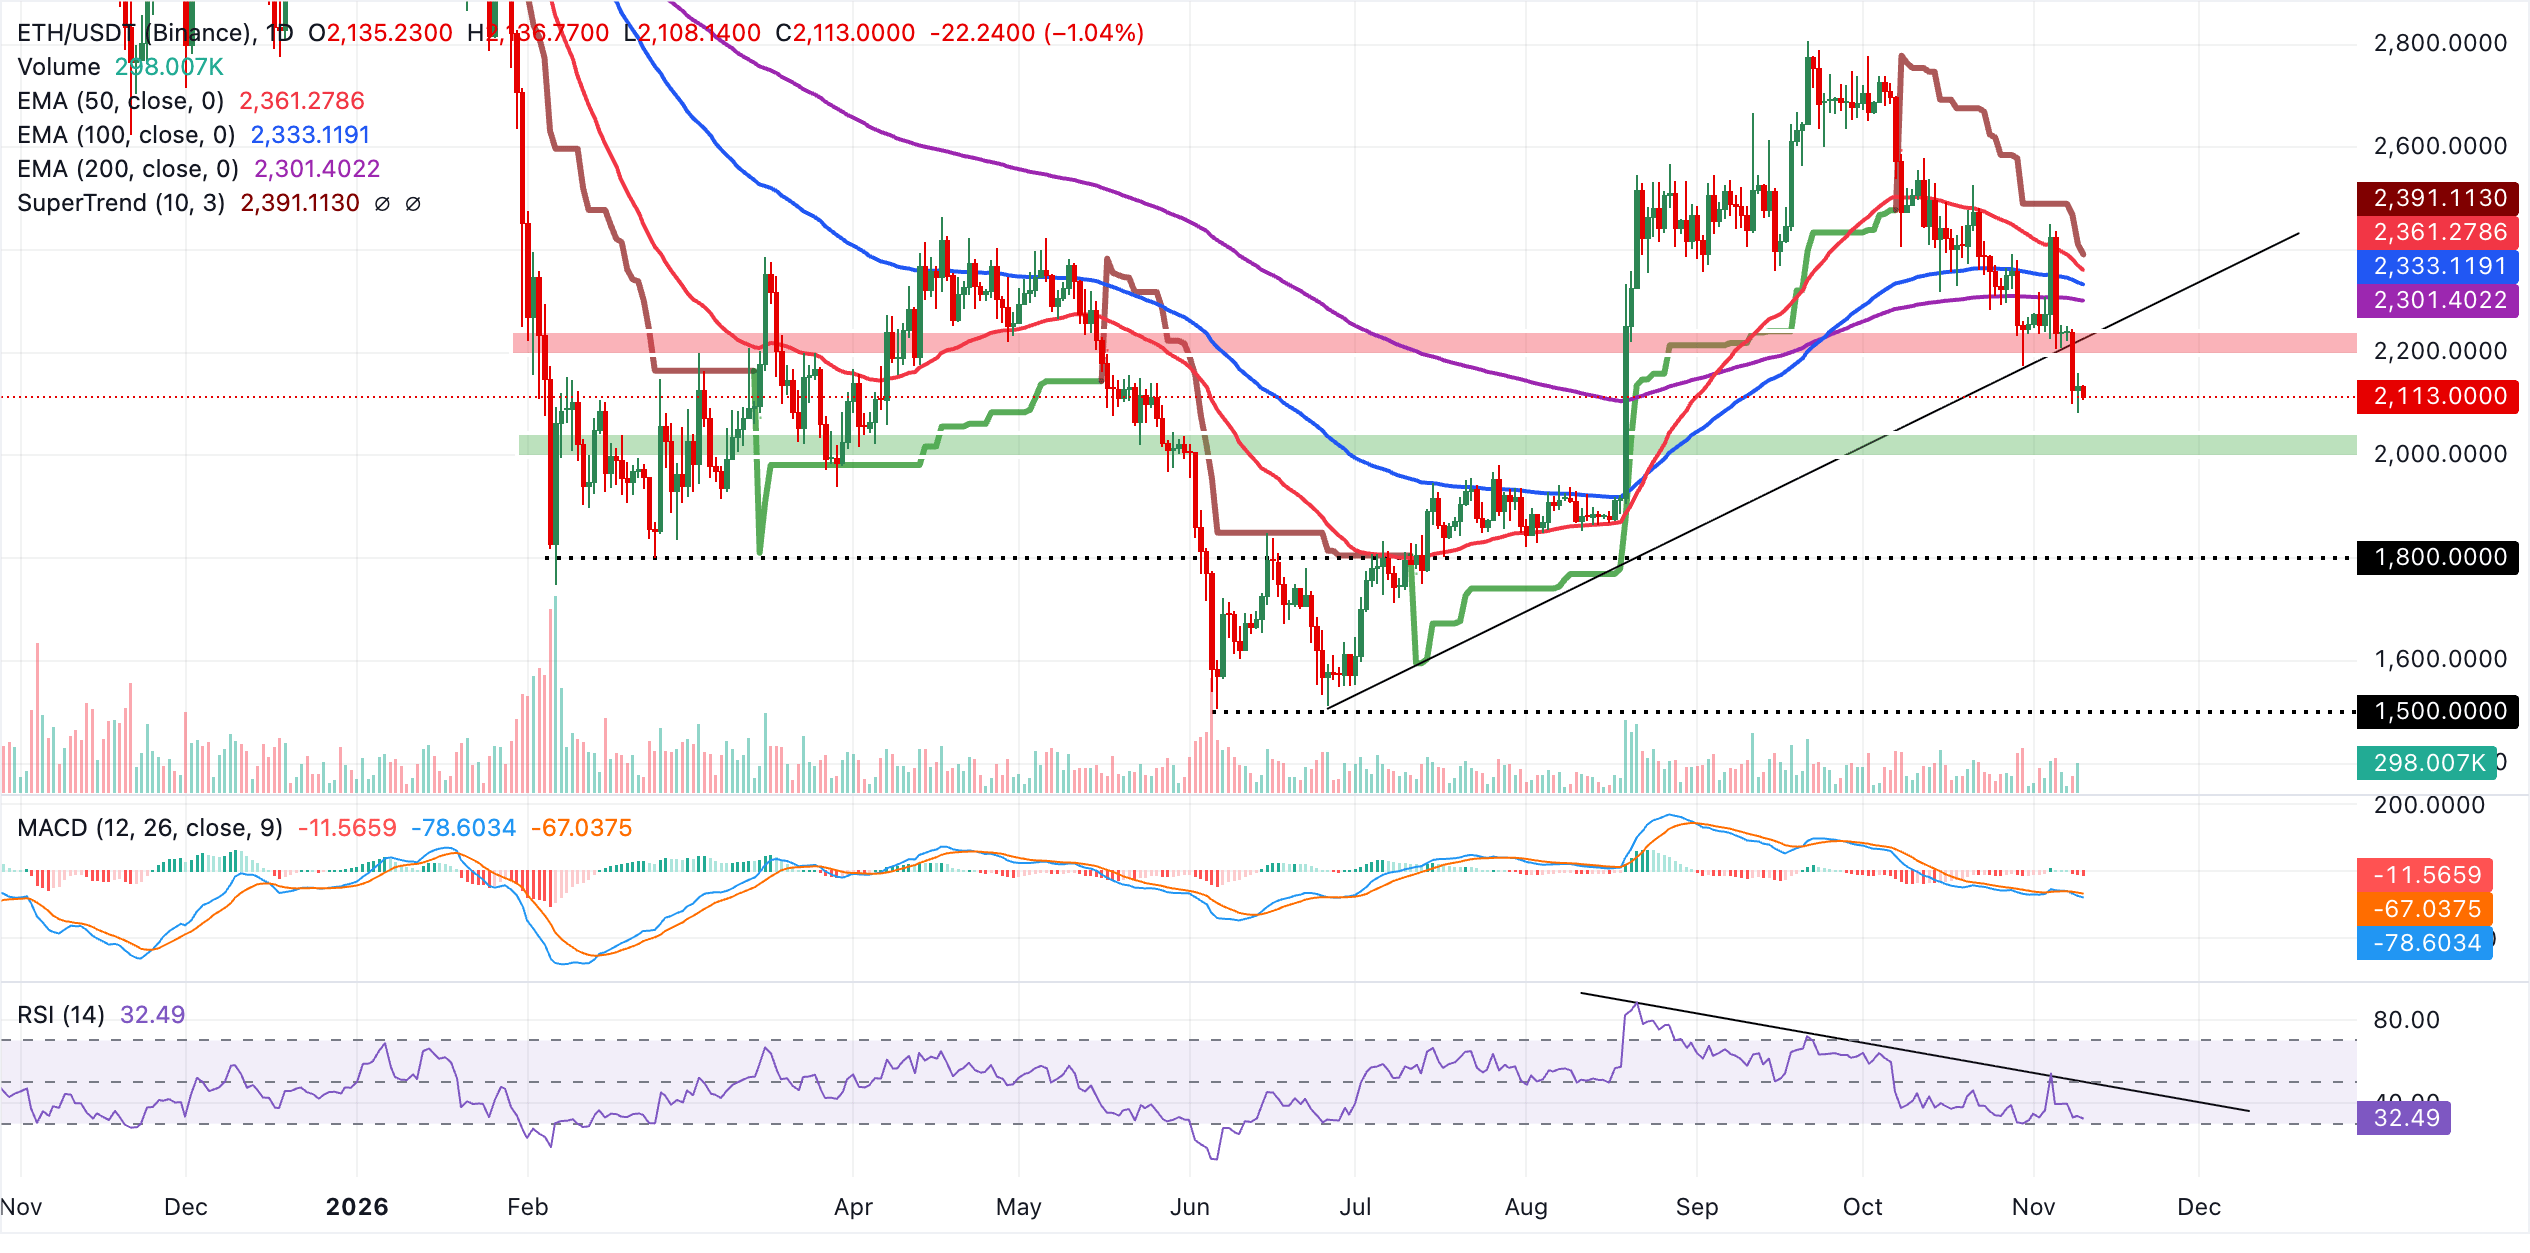
The broken trendline around $2,229 provides the first resistance, followed by the 200-day EMA at $2,301. A lasting recovery above both would be required to temper the bearish outlook and bring the 100-day EMA at $2,333 and 50-day EMA at $2,361 into view. The more distant SuperTrend hurdle stands at $2,391.
Below the market, the indicators under review identify no nearby structural support, leaving the latest low around the current trading area as a tentative floor. A clear break below $2,113 would pave the way for a deeper decline. ETH consequently remains exposed while it holds beneath all major moving averages and trend resistance.
Trading at $1.09, XRP retains a bearish bias beneath the cluster of EMAs and the active SuperTrend line. The 50-day EMA at $1.29, 100-day EMA at $1.30 and 200-day EMA at $1.35 reinforce the overhead resistance, with the SuperTrend level of $1.26 adding another obstacle to gains.
A sub-zero MACD signals continued weak momentum. Meanwhile, RSI has slipped into oversold territory at 26, indicating that selling pressure is stretched rather than showing signs of a reversal.
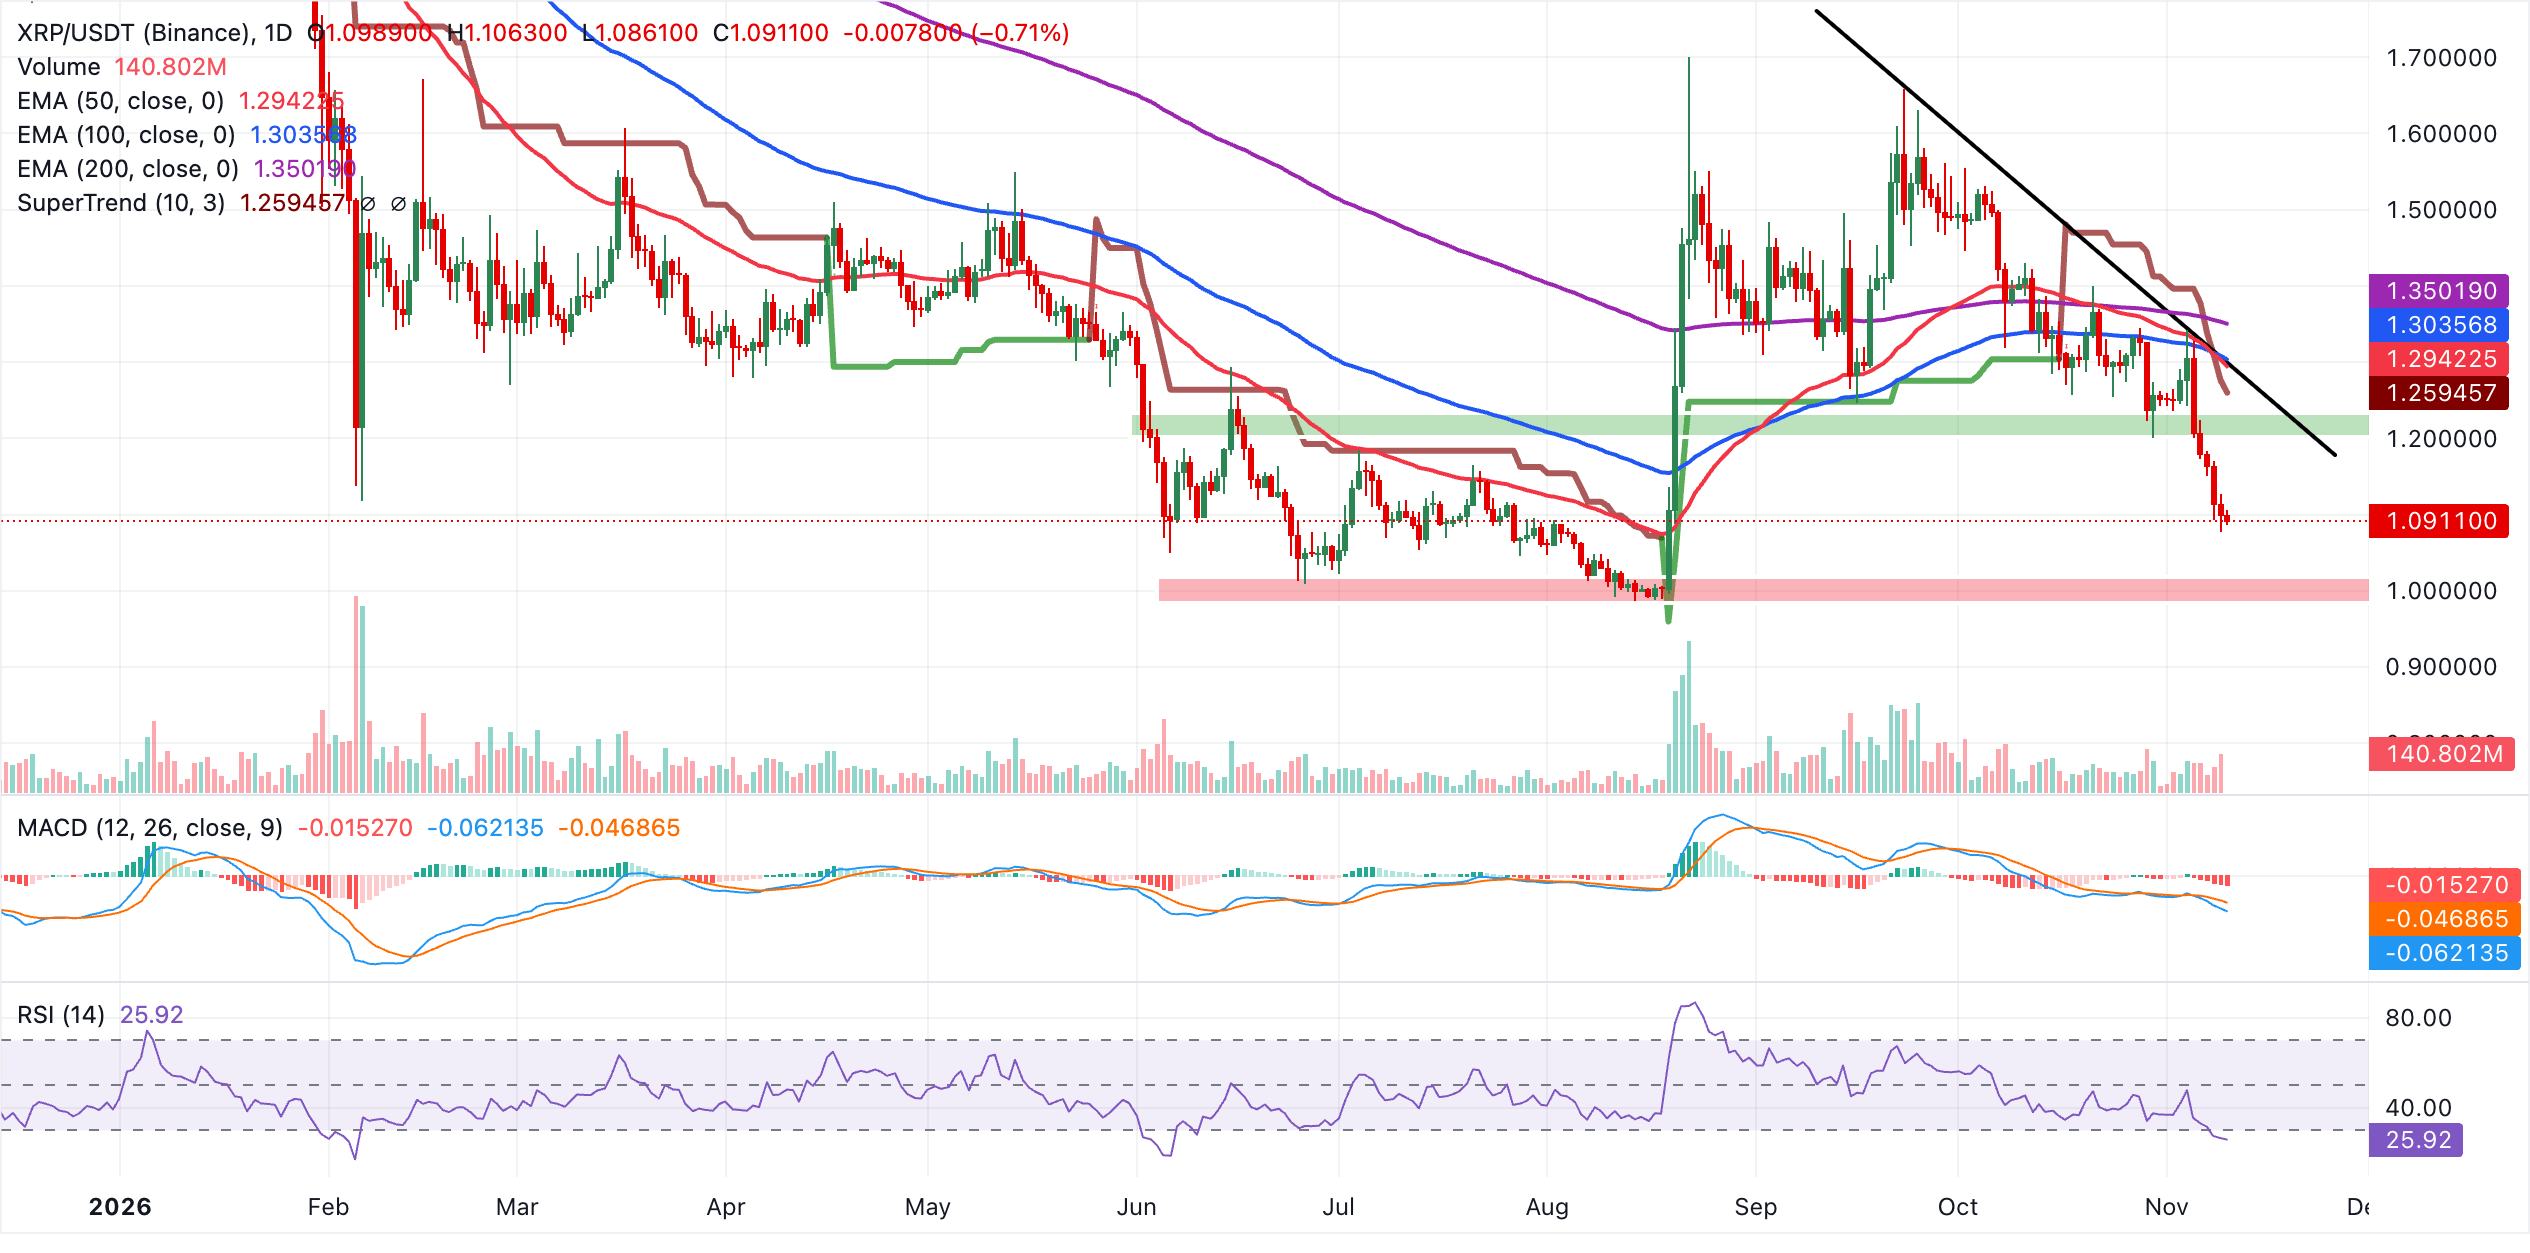
The SuperTrend level around $1.26 is the first resistance hurdle. Above it lies a dense structural zone comprising the 50-day EMA at $1.29 and the break point of the falling resistance trendline at $1.30. The 100-day EMA, also at $1.30, then precedes the 200-day EMA near $1.35, a more substantial obstacle to a lasting recovery.
The indicators currently in use show no nearby support, leaving the pair vulnerable beneath these successive resistance levels. Any recovery would therefore be likely to encounter difficulty on approaching $1.26-$1.30, the region containing the first overhead technical barriers.
(The technical analysis of this story was written with the help of an AI tool. Know more.)
By market capitalisation, Bitcoin ranks as the largest cryptocurrency. It is a virtual currency created to function as money, without control resting with any single person, group or entity. This removes the need for third parties to take part in financial transactions.
The term altcoin covers any cryptocurrency other than Bitcoin. Some also exclude Ethereum, however, on the grounds that forks originate from these two cryptocurrencies. On that definition, Litecoin is the first altcoin: it was forked from the Bitcoin protocol and is therefore an “improved” version of it.
Designed to maintain a steady price, stablecoins are cryptocurrencies backed by reserves of the asset they represent. Their value is pegged to a commodity or financial instrument, such as the US Dollar (USD), while an algorithm or demand regulates their supply. Their primary purpose is to give investors a route into and out of cryptocurrency trading and investment. They also offer a means of storing value, given the volatility generally associated with cryptocurrencies.
The ratio of Bitcoin’s market capitalisation to the combined market capitalisation of all cryptocurrencies is known as Bitcoin dominance. This measure gives a clear indication of investor interest in Bitcoin. BTC dominance is typically high ahead of and during a bull run, as investors turn to relatively stable, large-market-cap cryptocurrencies such as Bitcoin. When BTC dominance falls, it generally signals that investors are shifting capital and/or profits into altcoins in pursuit of higher returns, often prompting a surge in altcoin rallies.







Phone: +61 2 8036 8388
Fax: +61 2 8036 8388
Email: support@tmgm.com



The information provided on this website is of a general nature only and does not constitute personal financial advice. Before acting on any information on this website, you should consider the suitability of the information in relation to your objectives, financial situation and needs. Investing in CFDs and FX Margin Contracts carries significant risks and is not suitable for all investors. You may lose more than your initial deposit. You do not own, or have, any interest in the underlying asset. We recommend that you seek independent advice and ensure you fully understand the risks involved before trading. It is important that you read and consider the disclosure document before you acquire any product listed on the website. The information and advertisements offered on this website are not intended for use by any person in any country or jurisdiction where such use would be contrary to local laws and regulations. The Products and Services offered on this website are not intended for residents of the United States, Malaysia and Thailand.
TMGM is authorized and regulated in various jurisdictions.
Trademax Australia Limited, trading as TMGM, is regulated by the Australian Securities and Investments Commission (ASIC), AFSL no. 436416 and is located at Level 28, One International Tower, 100 Barangaroo Avenue, 2000 Sydney, NSW Australia.
Email: support@tmgm.com.au
Trademax Global Limited, trading as TMGM, is authorized and regulated by the Vanuatu Financial Services Commission (VFSC), registration number 40356 and registered at 1276, Kumul Highway, Port Vila, Vanuatu, Republic of Vanuatu.
Email: support@tmgm.com
Trademax Global Markets (SE) Limited, trading as TMGM, is authorized and regulated by the Financial Services Authority (FSA) of Seychelles, with license number SD224. The company is registered at Office No 13, Providence Estate ABIS Centre, Mahe, Seychelles.
Email: support@tmgm.com
Trademax Global Markets (International) Pty Ltd, trading as TMGM, is authorized and regulated by the Financial Services Commission, Mauritius (FSC) with license no. GB22201012, and registered at 33, Edith Cavell Street C/o IQ EQ Fund Services (Mauritius) Ltd Port Louis, 11324 Mauritius.
Email: support@tmgm.com
Copyright © TMGM. All rights reserved


