

Trading
Explora una amplia gama de mercados con precios competitivos, liquidez profunda y herramientas de trading avanzadas.
Más información 
Plataforma
Opera sin interrupciones con la potente plataforma de TMGM, diseñada para ofrecer velocidad, precisión y una experiencia de trading superior.
Más información Plataforma de trading
Herramientas de trading
Academia
Aprende los fundamentos del trading con recursos ideales para principiantes, incluidas guías, seminarios web y análisis del mercado.
Más información Academia TMGM
Noticias y análisis
Obtén actualizaciones del mercado en tiempo real y análisis de expertos para adelantarte a las oportunidades de trading
Más información Noticias y análisis
Acerca de
Descubre qué distingue a TMGM: nuestra presencia global, solidez regulatoria y compromiso con la innovación en el trading.
Más información Por qué elegir TMGM
Gold set for steepest weekly drop since March as Fed hike bets and forced selling weigh
- Gold attracts some dip buying as a global equity sell-off fuels market volatility.
- An increasingly hawkish Fed outlook keeps Gold on track for its worst week in eight months.
- Technical indicators remain bearish, with RSI in oversold territory and MACD signalling continued selling pressure.
Gold (XAU/USD) attracts some dip buying on Friday after hitting its lowest level since September 2025 in Asian trading. A sell-off in global equities fuels volatility across financial markets as Anthropic’s record IPO does little to ease concerns about stretched AI valuations. At the time of writing, XAU/USD trades around $3,586, up from an intraday low of $3,514.

As stocks come under pressure, some investors appear to be selling bullion to raise cash and cover losses elsewhere. The equity rout is also driving demand for government bonds, pushing yields lower. The benchmark 10-year US Treasury yield is down 13 basis points this week, slipping below 5%. Lower yields and a modest pullback in the US Dollar (USD) appear to be giving Gold some room to recover.
Despite the bounce, Gold remains on track for its worst week in eight months as traders brace for a more aggressive tightening cycle from the Federal Reserve (Fed). Markets have all but priced in a 25-bps rate hike in December, according to the CME FedWatch Tool, and expect rates to rise further into 2027 as more Fed officials voice concern about persistent inflation.
Philadelphia Fed President Anna Paulson said on Thursday that the central bank will need to raise rates again because inflation remains too high. Chicago Fed President Austan Goolsbee also said there was little evidence that inflation would return to 2% on its own.
The prospect of higher interest rates makes Gold less attractive to hold because it pays no interest. Hawkish Fed expectations also keep the US Dollar broadly supported, with the US Dollar Index (DXY) trading around 103.87, close to a 19-month high. A firm Greenback makes bullion more expensive for buyers using other currencies.
Later in the day, traders will look to the final University of Michigan consumer sentiment report, including its inflation expectations readings, and remarks from Fed Governor Lisa Cook for fresh clues on the rate outlook.
Technical Analysis:
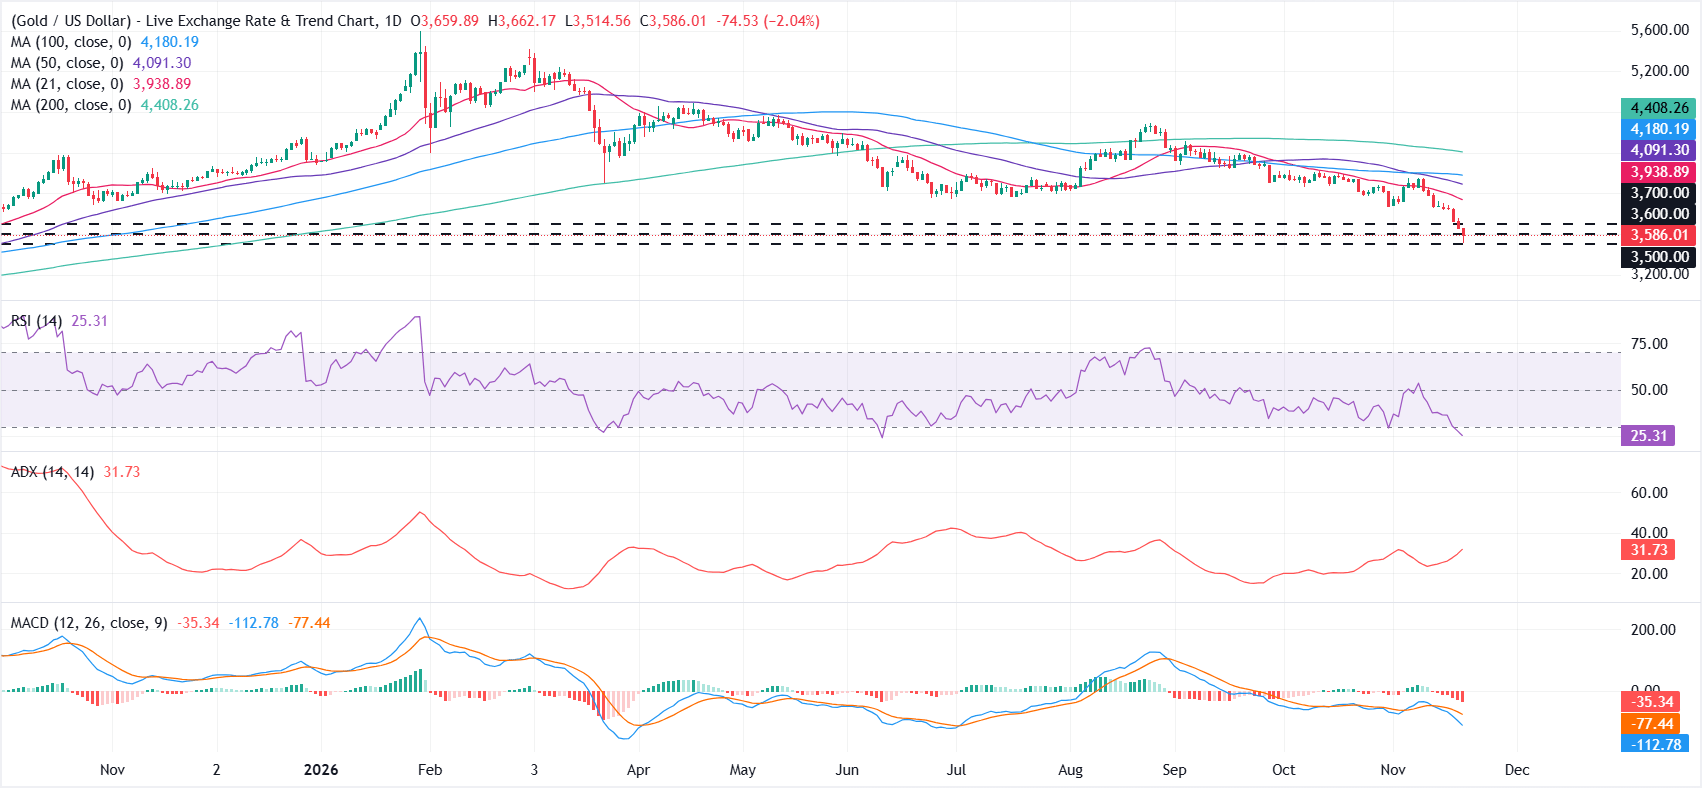
On the daily chart, XAU/USD trades at $3,586.84, extending a bearish phase as spot gold remains well below the 21-, 50-, 100-, and 200-day simple moving averages (SMAs), which stack overhead and hint at a sustained downside bias. Momentum aligns with this negative structure, with the Relative Strength Index (RSI) sinking into oversold territory near 25 and the Moving Average Convergence Divergence (MACD) deep in negative ground, while the rising Average Directional Index (ADX) above 30 suggests the prevailing downtrend is gaining strength rather than merely correcting.
On the topside, initial resistance emerges at $3,600, followed by $3,700, before a more meaningful supply zone begins near the 21-day SMA around $3,938. Beyond that, the 50-day SMA at $4,091 and the longer-term 100-day and 200-day SMAs at $4,180 and $4,408, respectively, reinforce a dense cap on recovery attempts. On the downside, the next notable support sits at the horizontal level of $3,500, but bears are likely to stay in control while price holds beneath the layered moving-average resistance above.
(The technical analysis of this story was written with the help of an AI tool. Know more.)
Artículos destacados
1Rand sudafricano: la postura restrictiva del SARB queda eclipsada por la política y los metales – Commerzbank2Previsión del precio de Ripple: XRP no logra recuperar 1,00 $ pese a la escasez de oferta en Binance3Peso mexicano: el tono restrictivo de la Fed impulsa su debilidad frente al dólar estadounidense – Societe Generale4Santos Pereira, del BCE, advierte del riesgo de que la inflación energética se extienda al conjunto de la economía5El franco suizo recorta pérdidas ante la debilidad del dólar estadounidense por la ola de ventas en el sector de la IA6Criptomonedas hoy: Bitcoin corre el riesgo de caer por debajo de los 61.000 dólares mientras Ethereum corrige y XRP consolida7Libra esterlina: los acuerdos con la UE ofrecen un margen de subida limitado frente al euro - ING8Dólar australiano: la ruptura de 0,6640 podría desencadenar nuevas caídas - UOB9Precio de la plata hoy: la plata cae, según datos de FXStreet

¡Comience ahora!
Regístrese y acceda a los mercados globales en menos de 3 minutos

Conéctese con nosotros









Contactos
Teléfono: +61 2 8036 8388
Fax: +61 2 8036 8388
Correo electrónico: support@tmgm.com



La información proporcionada en este sitio web es únicamente de carácter general y no constituye asesoramiento financiero personal. Antes de actuar sobre cualquier información de este sitio web, debe considerar la idoneidad de la información en relación con sus objetivos, situación financiera y necesidades. Invertir en CFD y contratos de margen de FX conlleva riesgos significativos y no es adecuado para todos los inversores. Puede perder más que su depósito inicial. Usted no posee ni tiene ningún interés en el activo subyacente. Le recomendamos que busque asesoramiento independiente y se asegure de comprender plenamente los riesgos involucrados antes de operar. Es importante que lea y considere el documento de divulgación antes de adquirir cualquier producto listado en el sitio web. La información y los anuncios ofrecidos en este sitio web no están destinados al uso por parte de ninguna persona en ningún país o jurisdicción donde dicho uso sea contrario a las leyes y regulaciones locales. Los productos y servicios ofrecidos en este sitio web no están destinados a residentes de Estados Unidos, Malasia y Tailandia.
TMGM está autorizado y regulado en varias jurisdicciones.
Trademax Australia Limited, que opera como TMGM, está regulada por la Comisión Australiana de Valores e Inversiones (ASIC), AFSL n.º 436416, y está ubicada en Level 28, One International Tower, 100 Barangaroo Avenue, 2000 Sydney, NSW Australia.
Correo electrónico: support@tmgm.com.au
Trademax Global Limited, que opera como TMGM, está autorizada y regulada por la Comisión de Servicios Financieros de Vanuatu (VFSC), número de registro 40356, y está registrada en 1276, Kumul Highway, Port Vila, Vanuatu, República de Vanuatu.
Correo electrónico: support@tmgm.com
Trademax Global Markets (SE) Limited, que opera como TMGM, está autorizada y regulada por la Autoridad de Servicios Financieros (FSA) de Seychelles, con número de licencia SD224. La empresa está registrada en Office No 13, Providence Estate ABIS Centre, Mahe, Seychelles.
Correo electrónico: support@tmgm.com
Trademax Global Markets (International) Pty Ltd, que opera como TMGM, está autorizada y regulada por la Comisión de Servicios Financieros de Mauricio (FSC) con licencia n.º GB22201012, y está registrada en 33, Edith Cavell Street C/o IQ EQ Fund Services (Mauritius) Ltd Port Louis, 11324 Mauricio.
Correo electrónico: support@tmgm.com
Copyright © TMGM. Todos los derechos reservados