

The Dollar Index is climbing out of a fiscal hole
- DXY trades just above 99.00, capped by the 200-day EMA near 99.75.
- September hike odds 40.14%, down from a coin flip on August 10.
- Three-month low set by a Treasury buyback expansion, not a Fed move.
The Dollar Index trades just above 99.00 and roughly a quarter of a percent higher, having printed its high just short of 99.25 after 14:00 GMT and not retested it since. The bid arrived at 12:30 GMT, when headline Personal Consumption Expenditures (PCE) prices ran 3.7% over the year against a 3.6% consensus. Reading that as the rate market re-arming for September would be a mistake, because the rate market has spent this month doing the opposite.

The curve trimmed the destination and kept the date
Aggregated meeting probabilities now put a September 16 increase at 40.14% against a 59.86% hold, with October 28 at 64.50% cumulative. December 9 carries no probability at all that the current 3.50% to 3.75% range survives the year, so one increase remains fully priced. What has changed is everything above that.
The terminal has been marked down hard, with a second increase to the 4.00% to 4.25% range by December 9 priced at 8.13% against 24.13% on August 10. The 91.87% now sitting on a single cell is the tightest conviction of the arc. The 2027 path says the same thing, peaking at 74.50% for two increases in June rather than the 86.71% carried a fortnight ago.
That is the shape of a market that has stopped arguing about how far and is only arguing about when. September has come off roughly ten points since August 10 and October twelve, with the destination falling alongside them while the December waypoint stayed nailed down. A currency bid on an inflation print into that configuration is buying a date, not a rate.
The 5-minute frame dates the whole move to one window. Spot held a band of barely fifteen points through the Asian and European hours, between the session low just beneath 99.00 and a ceiling near 99.05, then dipped back toward that floor in the minutes ahead of the release. It travelled close to twenty points in the half hour after 12:30 GMT, added another ten into the high after 14:00 GMT, and has handed roughly a quarter of the day's advance back since. That shape is a reaction to a number rather than a position taken for a policy path.
The low it is climbing off was fiscal
The level this bounce started from was not set by a monetary decision. The Dollar Index reached the 98.50 area last week, its lowest in more than three months, after the Treasury Department expanded its buyback programme for long-dated debt in an attempt to hold borrowing costs down. An operating announcement about debt management made that low, and today's move recovers roughly half of it.
The incongruity is what the currency is actually pricing, because the authority that wants long-term borrowing costs lower is the same one whose deficit made them high. Stepping into the market to hold a yield down is the kind of intervention that historically costs a currency more than it saves a bond, and the Dollar Index made a three-month low inside a week of the announcement.
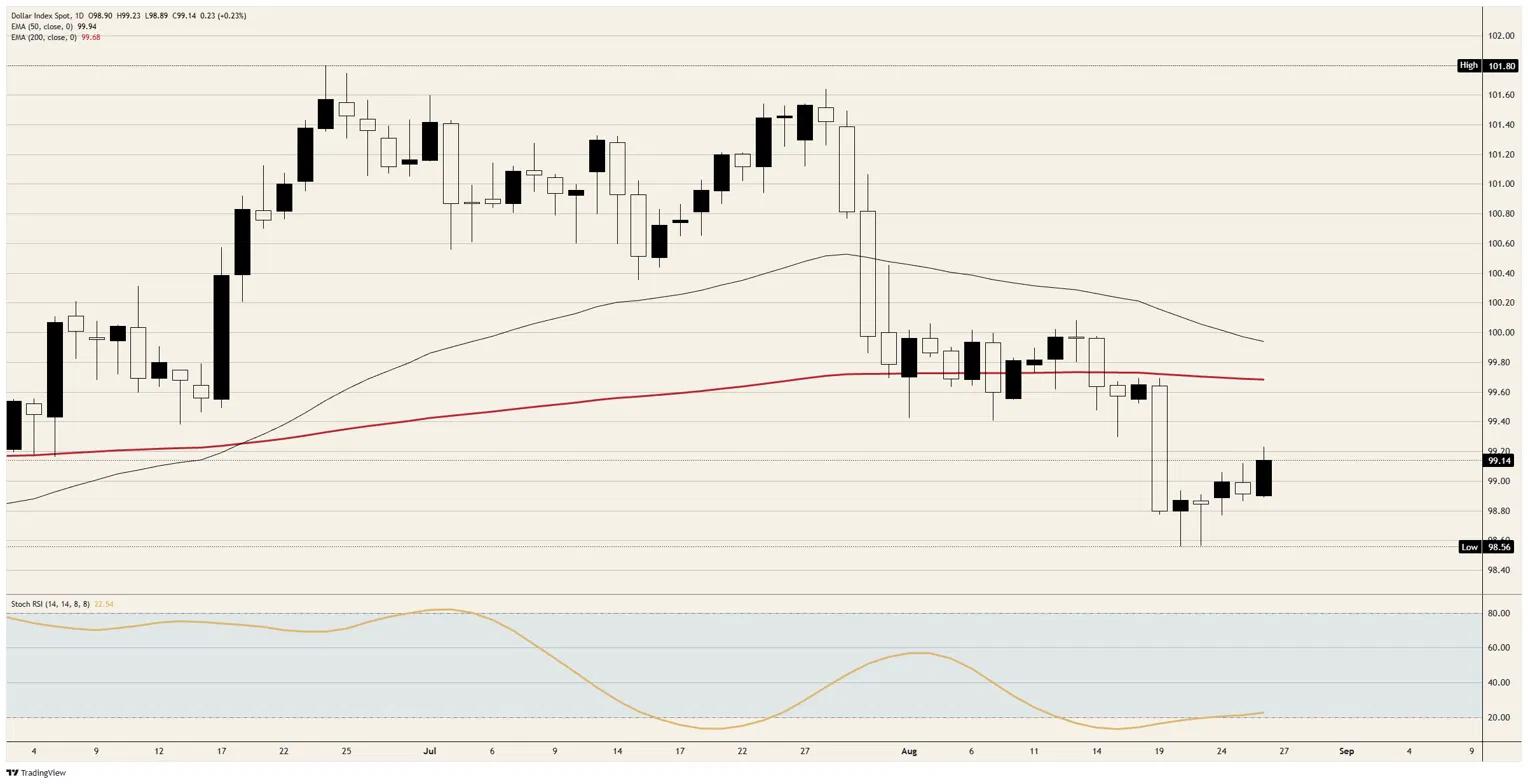
Buying back long-dated coupons while refunding at the front shortens the average maturity of the borrowing, which a currency market reads as an issuer that does not like the price the long end is charging. The chart agrees, with spot beneath the 200-day Exponential Moving Average (EMA) near 99.75 and beneath a 50-day just short of 100.00, the faster average now declining toward the slower one. There is roughly three quarters of a point of moving-average resistance in the way before a rate story gets to matter.
What the week still has to price
Thursday is thin, with initial jobless claims at 12:30 GMT expected at 208K from 206K. Friday carries the week, opening with the Chicago Purchasing Managers Index (PMI) at 13:45 GMT at a consensus of 57 from 57.6, ahead of a 14:00 GMT block that decides where the Dollar starts September.
That block stacks three events into one minute. The chair speaks at the Wyoming symposium, final August Michigan sentiment is expected at 51 with one-year household inflation expectations carrying a 4.3% prior and the five-year at 3.3%, and the preliminary benchmark revision to nonfarm payrolls prints alongside them. The revision is the underpriced item, because it restates the level of employment for a whole year and it arrives while the chair is still speaking.
Levels and bias
Resistance: The session high just short of 99.25 is the first line, and the 200-day EMA near 99.75 is the level that decides whether this is a bounce or a turn. Above it the 50-day just short of 100.00 guards the 100.00 handle, with the late-June peak just above 101.75 as the distant ceiling.
Support: The session low just beneath 99.00 is the immediate floor, and the handle itself has been changing hands for four sessions without either side taking it decisively. Beneath that the 98.50 area which marked last week's three-month low is the whole downside argument, and losing it opens ground with no chart structure until well under 98.00.
Bias: Bearish while the 200-day EMA near 99.75 caps, because a currency that needed a hot inflation print to travel a quarter of a percent is not being bought for its rate story, and the daily Stochastic Relative Strength Index (Stoch RSI) near 23 is turning up from oversold into resistance rather than out of a base. Objectives are the 98.50 area and then a test beneath it. Invalidation comes on a daily close above 99.75, which would put the 100.00 handle back in play.
DXY daily chart
US Dollar FAQs
The US Dollar (USD) is the official currency of the United States of America, and the ‘de facto’ currency of a significant number of other countries where it is found in circulation alongside local notes. It is the most heavily traded currency in the world, accounting for over 88% of all global foreign exchange turnover, or an average of $6.6 trillion in transactions per day, according to data from 2022. Following the second world war, the USD took over from the British Pound as the world’s reserve currency. For most of its history, the US Dollar was backed by Gold, until the Bretton Woods Agreement in 1971 when the Gold Standard went away.
The most important single factor impacting on the value of the US Dollar is monetary policy, which is shaped by the Federal Reserve (Fed). The Fed has two mandates: to achieve price stability (control inflation) and foster full employment. Its primary tool to achieve these two goals is by adjusting interest rates. When prices are rising too quickly and inflation is above the Fed’s 2% target, the Fed will raise rates, which helps the USD value. When inflation falls below 2% or the Unemployment Rate is too high, the Fed may lower interest rates, which weighs on the Greenback.
In extreme situations, the Federal Reserve can also print more Dollars and enact quantitative easing (QE). QE is the process by which the Fed substantially increases the flow of credit in a stuck financial system. It is a non-standard policy measure used when credit has dried up because banks will not lend to each other (out of the fear of counterparty default). It is a last resort when simply lowering interest rates is unlikely to achieve the necessary result. It was the Fed’s weapon of choice to combat the credit crunch that occurred during the Great Financial Crisis in 2008. It involves the Fed printing more Dollars and using them to buy US government bonds predominantly from financial institutions. QE usually leads to a weaker US Dollar.
Quantitative tightening (QT) is the reverse process whereby the Federal Reserve stops buying bonds from financial institutions and does not reinvest the principal from the bonds it holds maturing in new purchases. It is usually positive for the US Dollar.













