

Сауда
Бәсекеге қабілетті бағалар, жоғары өтімділік және озық сауда құралдары арқылы нарықтардың кең ауқымын зерттеңіз.
Толығырақ 
Платформа
TMGM-нің жылдамдыққа, дәлдікке және жоғары деңгейлі сауда тәжірибесіне арналған қуатты платформасымен сауданы кедергісіз жүргізіңіз.
Толығырақ Сауда платформасы
Академия
Бастауыштарға арналған нұсқаулықтар, вебинарлар және нарық талдаулары сияқты ресурстар арқылы сауданың негіздерін үйреніңіз.
Толығырақ TMGM Академиясы
Жаңалықтар және талдау
Сауда мүмкіндіктерінен алда болу үшін нақты уақыттағы нарық жаңартулары мен сараптамалық талдауды алыңыз
Толығырақ Жаңалықтар және талдау
Туралы
TMGM-ді ерекшелендіретін жайттарды біліңіз — біздің жаһандық ауқымымыз, реттеушілік беріктігіміз және трейдингтегі инновацияларға деген адалдығымыз.
Толығырақ Неліктен TMGM-ді таңдау керек
Top 3 Price Prediction: Bitcoin, Ethereum, Ripple – BTC hits July lows as ETH, XRP slide
- Bitcoin slips below $61,560 on Friday, hitting its lowest level since early July as bearish momentum accelerates.
- Ethereum extends losses after being rejected at key resistance around $1,823 earlier this week.
- XRP trades below $0.96 after failing to close above the key psychological level around $1.00.
Bitcoin (BTC), Ethereum (ETH) and Ripple (XRP) extend their losses on Friday, having corrected over 3%, 5% and 2%, respectively, so far this week. BTC slips below $61,560, reaching its lowest level since early July, while ETH struggles to recover after facing rejection near $1,823. Meanwhile, XRP remains below the psychological $1.00 mark, with sellers maintaining control as bulls fail to reclaim key resistance.

Bitcoin slips to July’s lows
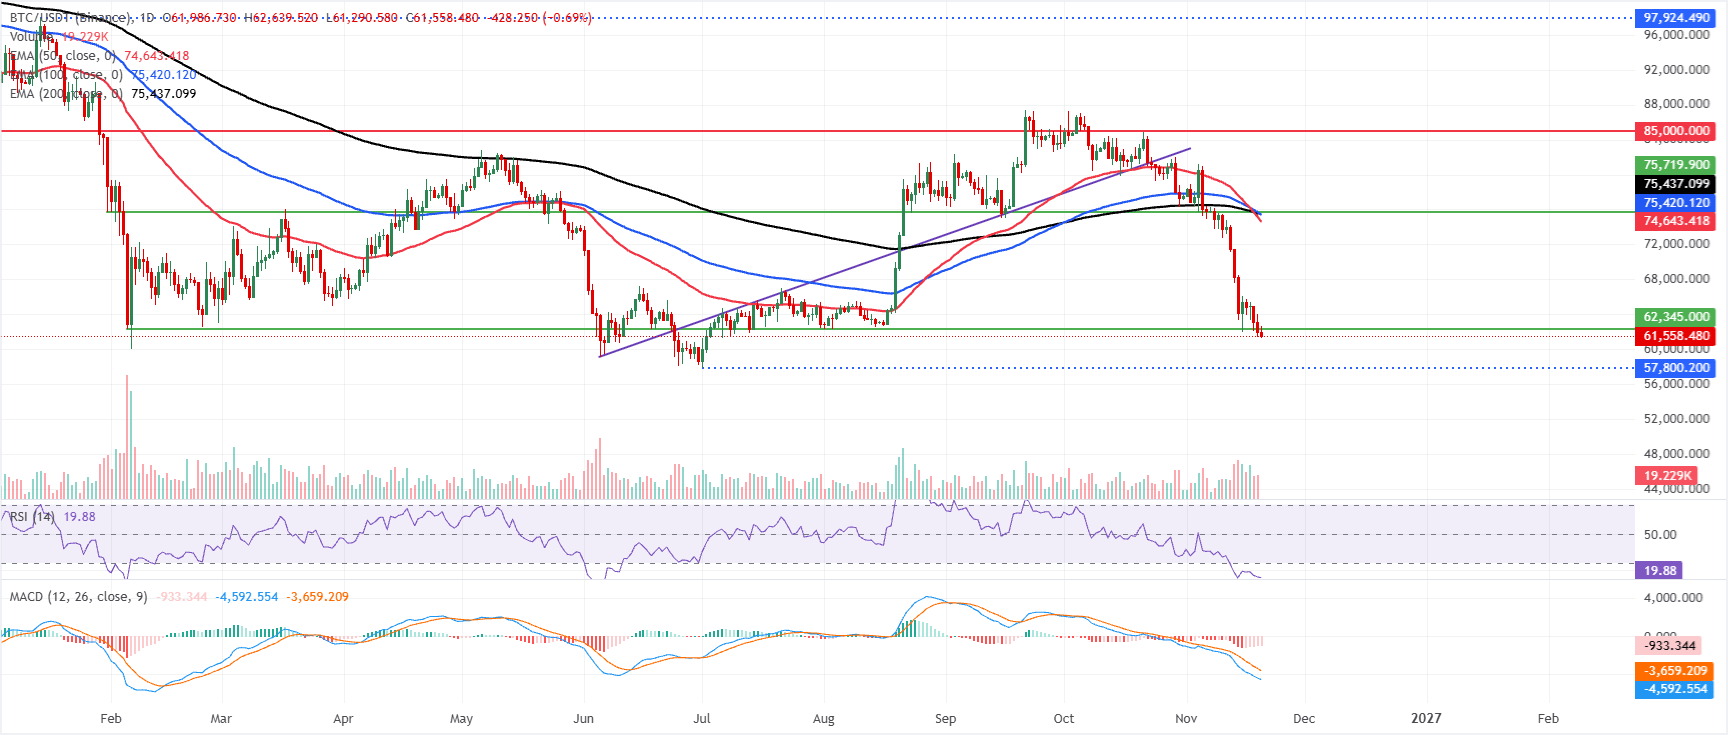
Bitcoin price trades at $61,558 on Friday, reaching a level not seen since July 6. BTC maintains a bearish near-term bias as it holds well below the 50-day, 100-day and 200-day Exponential Moving Averages (EMAs), clustered between roughly $74,600 and $75,400.
This stacked band of EMAs above the market suggests rallies remain corrective for now. At the same time, oversold conditions in the Relative Strength Index (RSI) near 19 and a deeply negative, subdued Moving Average Convergence Divergence (MACD) histogram hint that downside momentum is stretched but not yet reversing.
On the topside, initial resistance is seen at the 50-day EMA around $74,643, followed by the 100-day EMA at $75,420 and the 200-day EMA at $75,437, which together form a dense supply zone; a sustained break above this cluster would be needed to ease the prevailing downside pressure, with the horizontal barrier at $85,000 acting as a more distant cap.
With no clear technical support from nearby moving averages, traders may instead look to prior swing lows and psychological handles on the chart to gauge where dip-buying interest could emerge. Meanwhile, the broader structure remains below the key daily EMAs.
Ethereum faces rejection near the $1,823 mark
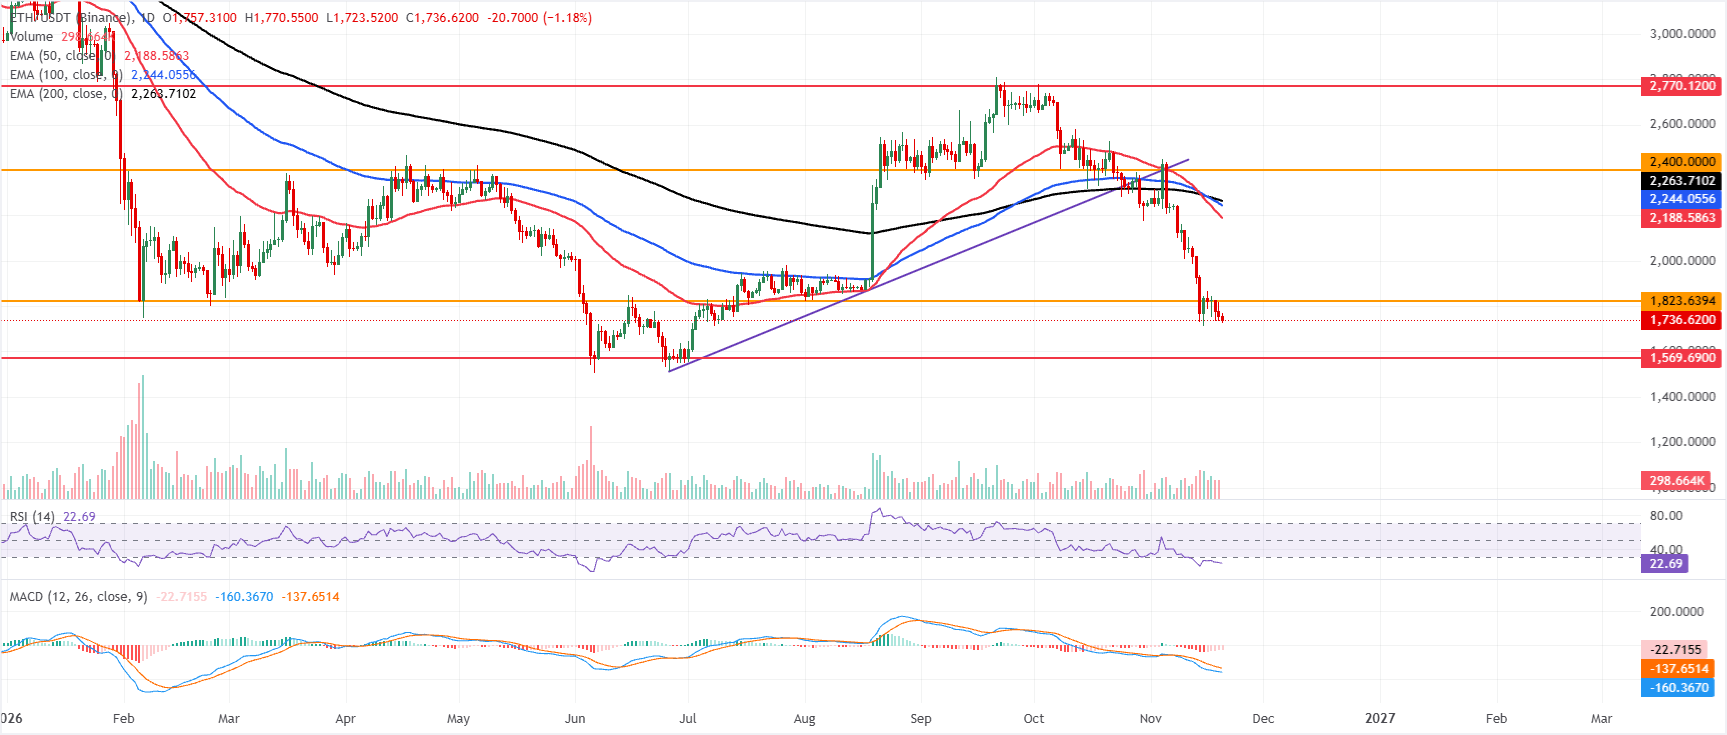
Ethereum price trades at $1,736 on Friday, retaining a bearish near-term bias as it sits well below the 50-day, 100-day and 200-day EMAs clustered between roughly $2,190 and $2,265. This configuration suggests rallies are likely to be sold. At the same time, momentum remains fragile, with the RSI hovering in oversold territory near 22 and the MACD buried in negative ground, suggesting downside pressure remains dominant despite the risk of intermittent corrective bounces.
On the topside, initial resistance emerges at the horizontal barrier around $1,823, followed by the 50-day EMA near $2,188 and then the 100-day and 200-day EMAs at $2,244 and $2,263, before a stronger cap at $2,400; beyond that, the prior trendline break zone near $2,506 and the $2,770 horizontal level mark more distant ceilings.
On the downside, immediate support is loosely defined by the recent price area ahead of the $1,569 horizontal support. At the same time, a deeper slide would expose the longer-term rising trendline origin near $1,512, where buyers might try to rebuild a more durable floor.
XRP fails to close above $1.00 level
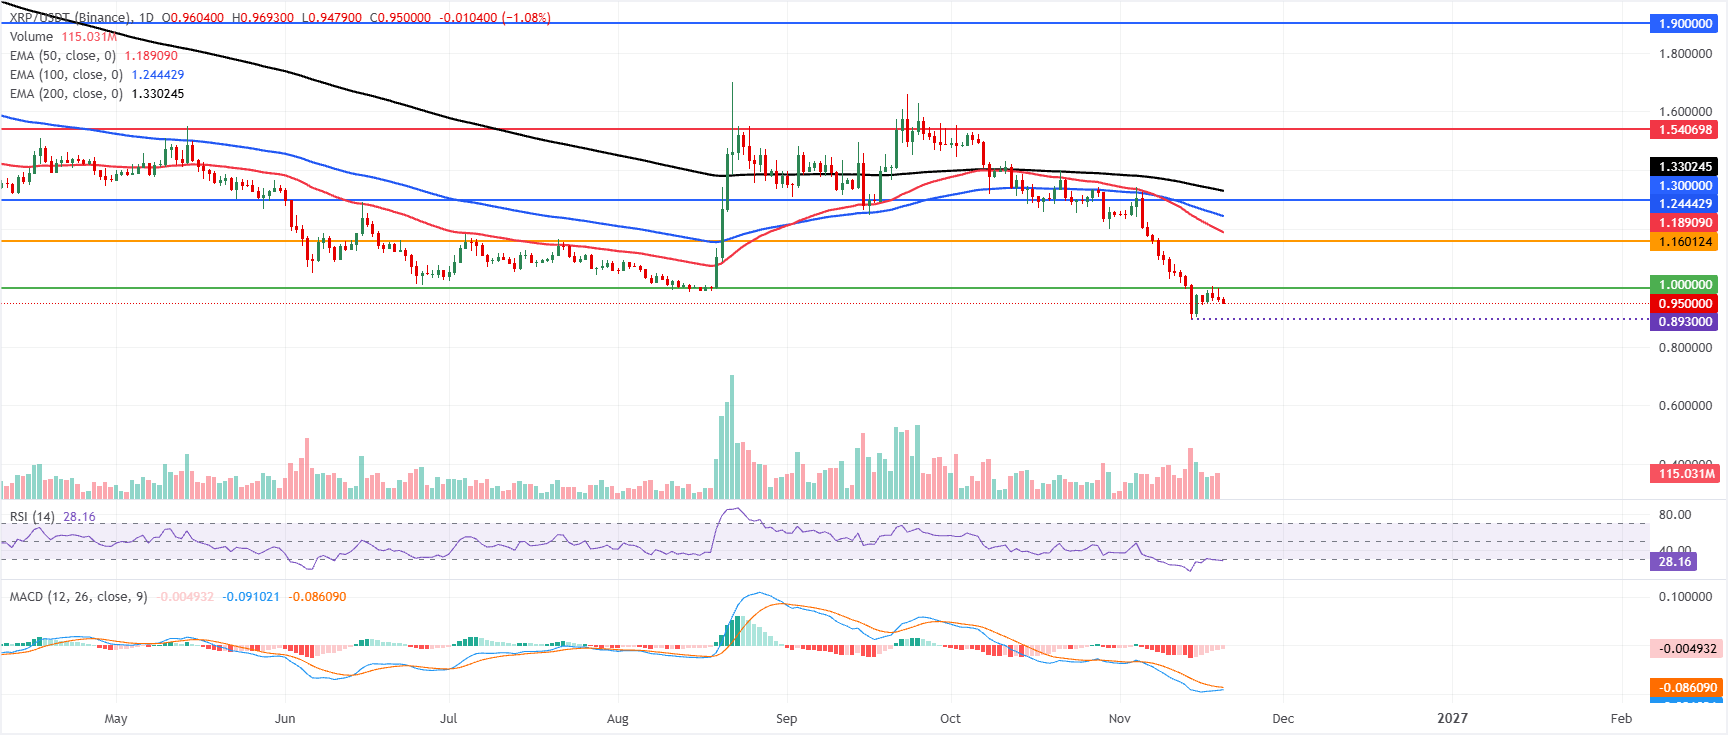
XRP price trades at $0.950 on Friday, extending a bearish phase as price holds well below the key EMAs. This compressed downside structure keeps the pair decisively capped. At the same time, the RSI at 28 sits in oversold territory, and the MACD remains marginally negative, together hinting that although downside pressure dominates, the pace of the recent slide could start to moderate rather than reverse outright.
On the topside, initial resistance emerges at the psychological $1.000 level, followed by a more substantial barrier at $1.160 and the 50-day EMA around $1.189. Above these, the 100-day EMA at $1.244 and the $1.300 horizontal level form the next resistance band, ahead of the 200-day EMA at $1.330, with $1.540 and $1.900 marking distant upside hurdles. With no clear nearby support levels defined below, any further weakness would leave XRP vulnerable to probing fresh lows until buyers show sustained interest above at least the $1.000 handle.
(The technical analysis of this story was written with the help of an AI tool. Know more.)
Cryptocurrency metrics FAQs
The developer or creator of each cryptocurrency decides on the total number of tokens that can be minted or issued. Only a certain number of these assets can be minted by mining, staking or other mechanisms. This is defined by the algorithm of the underlying blockchain technology. On the other hand, circulating supply can also be decreased via actions such as burning tokens, or mistakenly sending assets to addresses of other incompatible blockchains.
Market capitalization is the result of multiplying the circulating supply of a certain asset by the asset’s current market value.
Trading volume refers to the total number of tokens for a specific asset that has been transacted or exchanged between buyers and sellers within set trading hours, for example, 24 hours. It is used to gauge market sentiment, this metric combines all volumes on centralized exchanges and decentralized exchanges. Increasing trading volume often denotes the demand for a certain asset as more people are buying and selling the cryptocurrency.
Funding rates are a concept designed to encourage traders to take positions and ensure perpetual contract prices match spot markets. It defines a mechanism by exchanges to ensure that future prices and index prices periodic payments regularly converge. When the funding rate is positive, the price of the perpetual contract is higher than the mark price. This means traders who are bullish and have opened long positions pay traders who are in short positions. On the other hand, a negative funding rate means perpetual prices are below the mark price, and hence traders with short positions pay traders who have opened long positions.
Үздік мақалалар
1Жаңа Зеландия доллары көпжылдық ең төменгі деңгейлерден қайта көтерілді2АҚШ долларының спот индексі (DXY) өсуге бейімділігін сақтап, 2025 жылғы сәуірдегі ең жоғары мәндерден және 104,00 деңгейінен төмен саудалануда3Таяу Шығыстағы геосаяси шиеленіс мұнай бағасына қолдау көрсетіп, Канада доллары нығайып келеді4Күміс бағасының болжамы: шамадан тыс сатылу жағдайында XAG/USD жұбында $42,00 деңгейінен төмен сатушылардың үстемдігі сақталып отыр5ФРЖ саясатына қатысты күтулер мен Иранға байланысты тәуекелдер АҚШ долларын нығайтқан тұста, алтын 3 550 доллардан төмен құлдырап, 2025 жылғы қыркүйектен бергі жаңа минимумға түсті6Ұлыбританияның бөлшек сауда деректері жарияланар алдында британ фунты 1,3100 деңгейінен төмен түсті7Қытайдағы мөлшерлемелердің өзгеріссіз қалуы мен АҚШ долларының тұрақтылығы аясында Аустралия доллары әлсіз күйінде қалып отыр8Трамптың SEC құрамына ұсынған кандидаттары токенизация мен криптовалюталарды қадағалау мәселелері бойынша Сенаттың тексеруінен өтеді9Инфляция деректері Жапония банкінің мөлшерлемені көтеретініне қатысты күтулерді нығайтқандықтан, жапон иенасы күшейді


Бастау!
Тіркеліп, 3 минуттан аз уақытта жаһандық нарықтарға қол жеткізіңіз

Бізбен байланысыңыз









Байланыстар
Телефон: +61 2 8036 8388
Факс: +61 2 8036 8388
Эл. пошта: support@tmgm.com



Осы веб-сайтта берілген ақпарат тек жалпы сипатта ғана ұсынылады және жеке қаржылық кеңес болып табылмайды. Осы веб-сайттағы кез келген ақпаратқа сүйенбес бұрын, оның сіздің мақсаттарыңызға, қаржылық жағдайыңызға және қажеттіліктеріңізге сәйкестігін бағалауыңыз керек. CFD және FX Margin Contracts-қа инвестиция салу елеулі тәуекелдермен байланысты және барлық инвесторлар үшін қолайлы емес. Сіз бастапқы салымыңыздан артық қаражат жоғалтуыңыз мүмкін. Сіз базалық активке ешқандай меншік құқығына немесе үлеске ие болмайсыз. Сауда жасамас бұрын тәуелсіз кеңес алуды және тәуекелдерді толық түсінуді ұсынамыз. Веб-сайтта көрсетілген кез келген өнімді сатып алмас бұрын, ақпараттық құжатты оқып, оны мұқият қарастыру маңызды. Осы веб-сайтта ұсынылған ақпарат пен жарнамалар жергілікті заңдар мен ережелерге қайшы келетін кез келген елде немесе юрисдикцияда тұратын адамдардың пайдалануына арналмаған. Осы веб-сайтта ұсынылатын Өнімдер мен Қызметтер Америка Құрама Штаттары, Малайзия және Таиланд тұрғындарына арналмаған.
TMGM әртүрлі юрисдикцияларда уәкілетті және реттеледі.
Trademax Australia Limited, TMGM атауымен жұмыс істейді, Австралияның Бағалы қағаздар және инвестициялар жөніндегі комиссиясымен (ASIC) реттеледі, AFSL № 436416 және мына мекенжайда орналасқан: Level 28, One International Tower, 100 Barangaroo Avenue, 2000 Sydney, NSW Australia.
Электрондық пошта: support@tmgm.com.au
Trademax Global Limited, TMGM атауымен жұмыс істейді, Вануату Қаржылық қызметтер комиссиясымен (VFSC) уәкілетті және реттеледі, тіркеу нөмірі 40356, тіркелген мекенжайы: 1276, Kumul Highway, Port Vila, Vanuatu, Republic of Vanuatu.
Электрондық пошта: support@tmgm.com
Trademax Global Markets (SE) Limited, TMGM атауымен жұмыс істейді, Сейшел аралдарының Қаржылық қызметтер басқармасы (FSA) тарапынан уәкілетті және реттеледі, лицензия нөмірі SD224. Компания мына мекенжайда тіркелген: Office No 13, Providence Estate ABIS Centre, Mahe, Seychelles.
Электрондық пошта: support@tmgm.com
Trademax Global Markets (International) Pty Ltd, TMGM атауымен жұмыс істейді, Mauritius Қаржылық қызметтер комиссиясымен (FSC) № GB22201012 лицензиясы бойынша уәкілетті және реттеледі, тіркелген мекенжайы: 33, Edith Cavell Street C/o IQ EQ Fund Services (Mauritius) Ltd Port Louis, 11324 Mauritius.
Электрондық пошта: support@tmgm.com
Авторлық құқық © TMGM. Барлық құқықтар қорғалған