

Торговля
Изучите широкий спектр рынков с конкурентными ценами, высокой ликвидностью и передовыми торговыми инструментами.
Узнать больше 
Платформа
Торгуйте без сбоев на мощной платформе TMGM, созданной для скорости, точности и превосходного торгового опыта.
Узнать больше Торговая платформа
Торговые инструменты
Академия
Изучите основы торговли с помощью материалов для начинающих, включая руководства, вебинары и аналитические обзоры рынка.
Узнать больше Новости и аналитика
Получайте актуальные рыночные обновления и экспертную аналитику, чтобы быть на шаг впереди торговых возможностей
Узнать больше Новости и аналитика
О нас
Узнайте, что отличает TMGM — наше глобальное присутствие, надежное регулирование и приверженность инновациям в трейдинге.
Узнать больше Почему выбирают TMGM
Спонсорство
Pi Network Price Forecast: PI rebounds from record lows, exits oversold territory as momentum improves
- Pi Network is up around 7% on Tuesday after hitting a record low of $0.0624 the previous day.
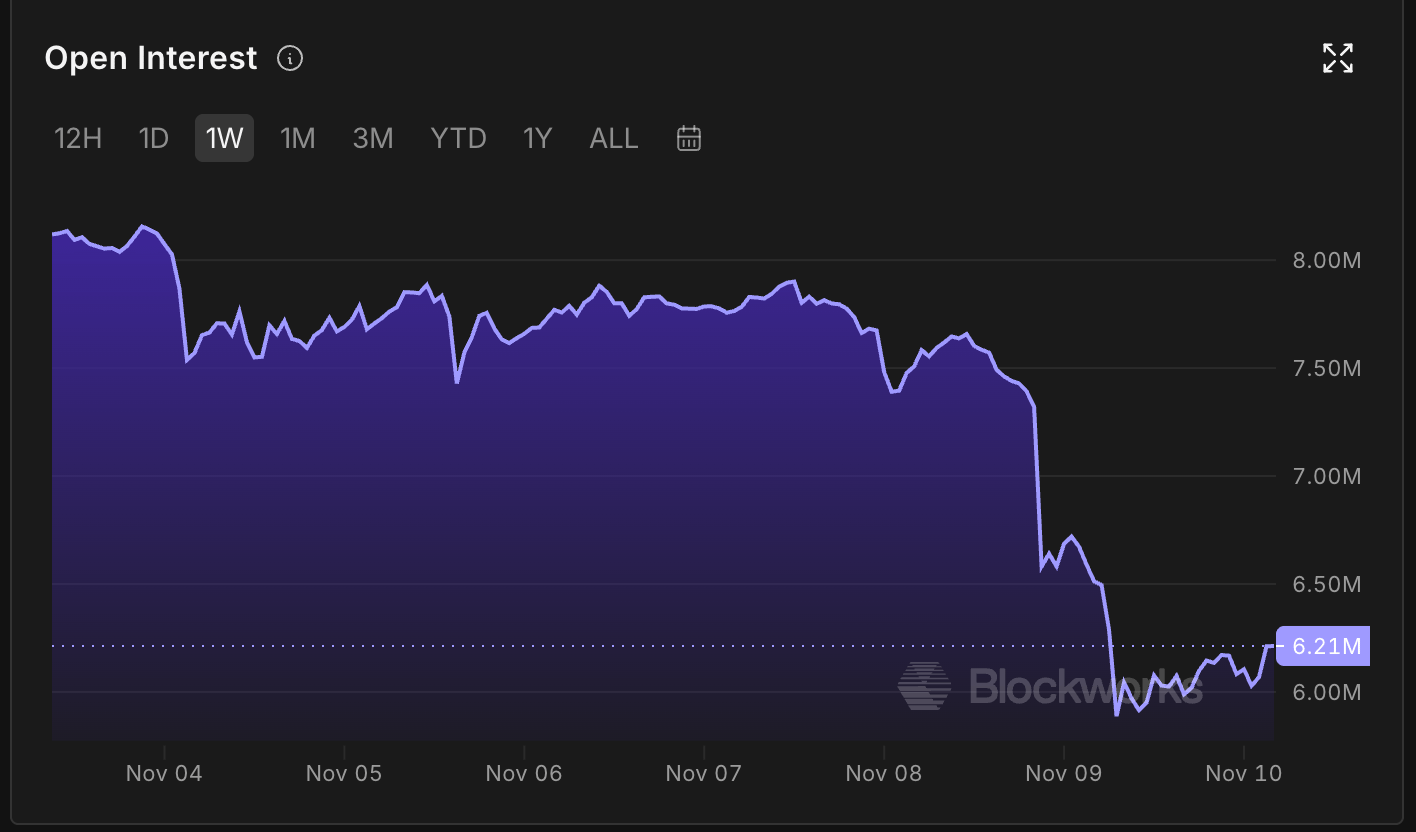
- Pi futures Open Interest rises to $6.21 million, pointing to increased positioning in the derivatives market.
- The technical outlook for PI is mixed, with the daily RSI recovering above 30 after entering oversold territory.
Pi Network (PI) shows a strong recovery on Tuesday, up over 7% after recording its all-time low of $0.0624 the previous day. PI token’s appeal in the derivatives market shows minor improvement, with Open Interest rising to $6.21 million. The technical outlook for PI remains mixed, with the price still capped below a long-term resistance trendline.

Recovering Open Interest eases short-term risk
Pi Network shows signs of regaining ground in the derivatives market. Blockworks data shows the PI token Open Interest (OI) rises to $6.21 million, from $5.89 million the previous day, indicating a near-term positional buildup and a firm rebound in sentiment.
Technical outlook: Can PI regain lost levels?
Pi Network trades at $0.0703 at press time on Tuesday, reflecting a rebound after five straight days of losses. The price holds well below the 50-day and 200-day Exponential Moving Averages (EMAs) at $0.0799 and $0.1085, respectively, and is capped by a long-term resistance trendline connecting the June 20 and August 22 highs at around $0.0752. A sustained recovery in PI could face its initial resistance at the descending trendline near $0.0752, followed by the 50-day EMA at $0.0799.
The Relative Strength Index (RSI) around 35 suggests weakness but also a rebound from oversold conditions, while the Moving Average Convergence Divergence (MACD) remains in negative territory, hinting that downside momentum could still outweigh recovery attempts.
Looking down, the immediate support for PI aligns with the 127.2% Fibonacci extension level, measured over the downswing from $0.1394 to $0.0704, at $0.0516.
(The technical analysis of this story was written with the help of an AI tool. Know more.)
Лучшие статьи
1Австралийский доллар остается под давлением на фоне сокращения профицита торгового баланса Китая в октябре2Профицит торгового баланса Китая в октябре сократился сильнее ожиданий и составил 712,72 млрд юаней.3Индекс доллара США (DXY) почти не меняется вблизи отметки 101,70 в ожидании данных по CPI в США на фоне неопределенности вокруг Ирана4Экспорт Китая в октябре вырос на 35,2% в годовом выражении, превысив ожидания в 33,5%.5Импорт Китая в октябре превысил ожидания (32%): фактическое значение составило 41,6% г/г6Торговый баланс Китая составил $105,28 млрд, что ниже ожиданий ($125,8 млрд) в октябре.7Сальдо торгового баланса Китая (CNY) в октябре составило 712,78 млрд, что ниже ожиданий в 859 млрд.8Экспорт Китая (г/г, CNY) в октябре снизился до 28,7% с предыдущих 29,6%.9Новозеландский доллар стабилизировался: переговоры по Ирану не смогли подтолкнуть пару NZD/USD вверх.

Начать!
Зарегистрируйтесь и получите доступ к глобальным рынкам менее чем за 3 минуты

Свяжитесь с нами









Контакты
Телефон: +61 2 8036 8388
Факс: +61 2 8036 8388
Эл. почта: support@tmgm.com
Веб-сайт: https://www.tmgmasia.com



Информация, представленная на этом веб-сайте, носит исключительно общий характер и не является персональной финансовой консультацией. Прежде чем действовать на основании любой информации на этом веб-сайте, вам следует оценить ее уместность с учетом ваших целей, финансового положения и потребностей. Инвестирование в CFD и маржинальные контракты на FX сопряжено со значительными рисками и подходит не всем инвесторам. Вы можете потерять больше, чем ваш первоначальный депозит. Вы не владеете базовым активом и не имеете в нем какой-либо доли. Мы рекомендуем вам обратиться за независимой консультацией и убедиться, что вы полностью понимаете связанные с этим риски, прежде чем начинать торговлю. Важно прочитать и принять во внимание документ с раскрытием информации, прежде чем приобретать любой продукт, указанный на веб-сайте. Информация и рекламные материалы, предлагаемые на этом веб-сайте, не предназначены для использования любым лицом в любой стране или юрисдикции, где такое использование противоречило бы местным законам и нормативным актам. Продукты и услуги, предлагаемые на этом веб-сайте, не предназначены для резидентов США, Малайзии и Таиланда.
TMGM уполномочена и регулируется в различных юрисдикциях.
Trademax Australia Limited, работающая под брендом TMGM, регулируется Australian Securities and Investments Commission (ASIC), AFSL № 436416 и находится по адресу: Level 28, One International Tower, 100 Barangaroo Avenue, 2000 Sydney, NSW Australia.
Email: support@tmgm.com.au
Trademax Global Limited, работающая под брендом TMGM, уполномочена и регулируется Vanuatu Financial Services Commission (VFSC), регистрационный номер 40356, и зарегистрирована по адресу: 1276, Kumul Highway, Port Vila, Vanuatu, Republic of Vanuatu.
Email: support@tmgm.com
Trademax Global Markets (SE) Limited, работающая под брендом TMGM, уполномочена и регулируется Financial Services Authority (FSA) Сейшельских Островов, номер лицензии SD224. Компания зарегистрирована по адресу: Office No 13, Providence Estate ABIS Centre, Mahe, Seychelles.
Email: support@tmgm.com
Trademax Global Markets (International) Pty Ltd, работающая под брендом TMGM, уполномочена и регулируется Financial Services Commission, Mauritius (FSC), лицензия № GB22201012, и зарегистрирована по адресу: 33, Edith Cavell Street C/o IQ EQ Fund Services (Mauritius) Ltd Port Louis, 11324 Mauritius.
Email: support@tmgm.com
Авторское право © TMGM. Все права защищены