

Savdo
Raqobatbardosh narxlar, chuqur likvidlik va ilg‘or savdo vositalari bilan keng turdagi bozorlarni kashf eting.
Batafsil ma’lumot 
Platforma
TMGM’ning tezlik, aniqlik va yuqori savdo tajribasi uchun yaratilgan kuchli platformasi bilan uzluksiz savdo qiling.
Batafsil ma’lumot Savdo platformasi
Savdo vositalari
Akademiya
Boshlovchilar uchun qulay resurslar, jumladan qo‘llanmalar, vebinarlar va bozor tahlillari orqali savdoning asoslarini o‘rganing.
Batafsil ma’lumot Yangiliklar va tahlil
Savdo imkoniyatlaridan oldinda bo‘lish uchun bozor yangilanishlari va ekspert tahlillarini real vaqt rejimida oling
Batafsil ma’lumot Yangiliklar va tahlil
Haqida
TMGMni boshqalardan ajratib turadigan jihatlarni bilib oling — bizning global mavjudligimiz, tartibga solishdagi mustahkamligimiz va savdoda innovatsiyalarga sodiqligimiz.
Batafsil ma’lumot Nega TMGMni tanlash kerak
Ripple Price Forecast: XRP risks losing $1.00 support as 24-hour liquidations hit $20 million
- XRP corrects and trades around $1.00 amid growing selling pressure and technical weakness.
- XRP derivatives hit hard, with 24-hour liquidations exceeding $20 million.
- XRP remains heavily oversold with a negative MACD indicator, but recovery prospects seem limited.
Ripple (XRP) remains on edge, trading around $1.00 on Friday. The remittance token’s sharp decline has persisted since November 5, initially triggered by the $6.3 billion Binance hack and later accentuated by the United States (US) midterm elections.
The US Consumer Price Index (CPI) report released earlier this week showed inflation increased mildly, reinforcing broad expectations that the Federal Reserve (Fed) will hike interest rates in December.

XRP liquidations weigh on price action
Appetite for digital assets remains significantly weak, as reflected in the Fear & Greed Index, which held at 20 in Extreme Fear territory on Friday, down from 28 the previous day. This outlook aligns with the ongoing sell-off in the broader crypto market and in XRP derivatives.
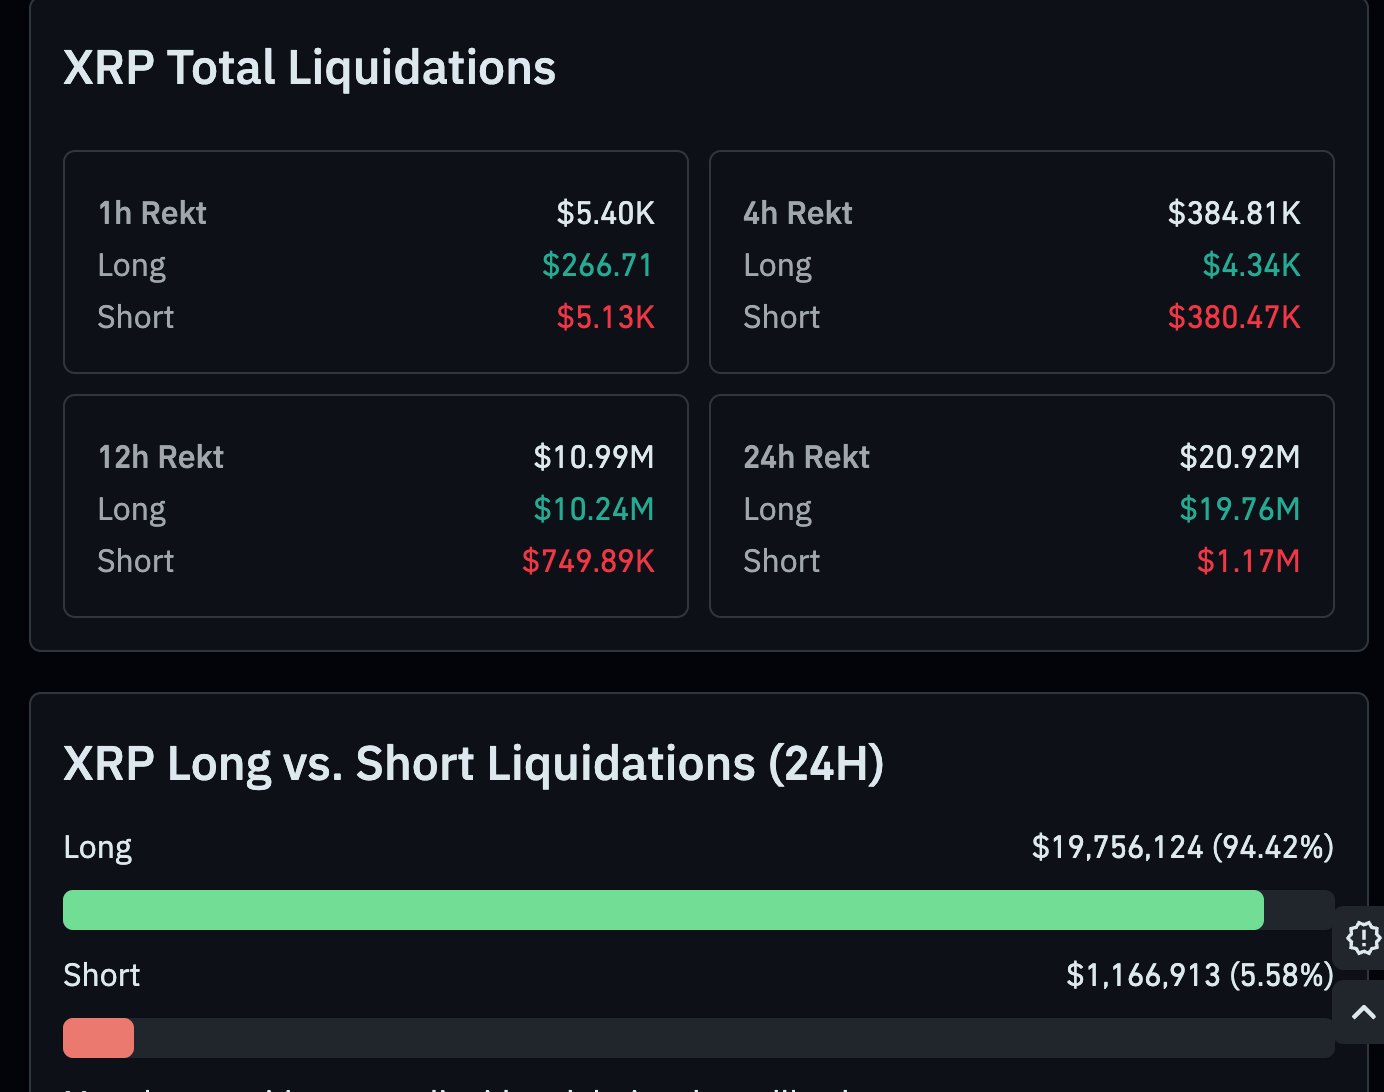
CoinGlass data shows that 24-hour liquidations average over $20 million, mostly in long positions. Only $1.2 million in short positions has been liquidated over the period, indicating that bulls are taking the biggest hit. Persistent liquidations could put more pressure on XRP, as more traders are forced to close their positions.
Technical analysis: XRP falters as sellers gain ground
XRP trades at $1.03, extending a clear bearish bias as price holds well beneath the short- and long-term Exponential Moving Averages (EMAs) and the active SuperTrend line. A dense overhead structure is pressing the pair lower, with the 10-day SuperTrend at $1.19 leading a series of exponential moving averages, including the 50-day EMA at $1.26, the downward resistance trendline break level at $1.27, the 100-day EMA at $1.29, and the 200-day EMA at $1.34.
Momentum conditions reinforce the downside tone, as the Moving Average Convergence Divergence (MACD) remains in negative territory with a weak profile, while the Relative Strength Index (RSI) at 22 slips deep into oversold territory, hinting that while pressure is strong, the market is vulnerable to short-lived corrective bounces rather than a sustained recovery for now.
With no meaningful support levels defined below the current price in the current dataset, the focus stays on the pivotal $1.00 demand area and, on the topside, the initial recovery hurdle at the SuperTrend barrier around $1.19. A daily close above this level would be needed to ease immediate selling pressure, exposing the 50-day EMA at $1.26 and the nearby descending trendline resistance at $1.27 as the next caps.
Further up, the 100-day EMA near $1.29 and the 200-day EMA around $1.34 compose a broader medium-term resistance band that would likely limit any rebound, keeping the overall structure bearish as long as XRP trades below this cluster.
(The technical analysis of this story was written with the help of an AI tool. Know more.)
Cryptocurrency metrics FAQs
The developer or creator of each cryptocurrency decides on the total number of tokens that can be minted or issued. Only a certain number of these assets can be minted by mining, staking or other mechanisms. This is defined by the algorithm of the underlying blockchain technology. On the other hand, circulating supply can also be decreased via actions such as burning tokens, or mistakenly sending assets to addresses of other incompatible blockchains.
Market capitalization is the result of multiplying the circulating supply of a certain asset by the asset’s current market value.
Trading volume refers to the total number of tokens for a specific asset that has been transacted or exchanged between buyers and sellers within set trading hours, for example, 24 hours. It is used to gauge market sentiment, this metric combines all volumes on centralized exchanges and decentralized exchanges. Increasing trading volume often denotes the demand for a certain asset as more people are buying and selling the cryptocurrency.
Funding rates are a concept designed to encourage traders to take positions and ensure perpetual contract prices match spot markets. It defines a mechanism by exchanges to ensure that future prices and index prices periodic payments regularly converge. When the funding rate is positive, the price of the perpetual contract is higher than the mark price. This means traders who are bullish and have opened long positions pay traders who are in short positions. On the other hand, a negative funding rate means perpetual prices are below the mark price, and hence traders with short positions pay traders who have opened long positions.
Eng yaxshi maqolalar
1AUD/JPY narx prognozi: pasayish signallari pastga yo‘nalgan kayfiyatni kuchaytirishi fonida 109,50 dan pastladi2Oktyabrda Xitoy savdo profitsiti qisqargani fonida Avstraliya dollari sustligicha qolmoqda3Xitoyning savdo profitsiti oktyabrda kutilganidan ko‘proq qisqarib, 712,72 mlrd CNYni tashkil etdi.4AQSh dollari indeksi (DXY) 101,70 atrofida barqaror, Eron borasidagi noaniqlik fonida AQSh CPI hisobotini kutmoqda5Xitoy eksporti yillik hisobda oktyabrda 35,2%ni tashkil etib, 33,5%lik prognozdan yuqori boʻldi.6Xitoy importi (yillik hisobda) oktyabrda kutilganidan yuqori: prognoz 32%, amaldagi ko‘rsatkich 41,6%7Xitoyning AQSh dollaridagi savdo balansi oktabrda $105,28 mlrdni tashkil etdi, bu kutilgan $125,8 mlrd ko‘rsatkichidan past.8Xitoyning savdo balansi (CNY) oktabrda 712,78 mlrdni tashkil etib, kutilgan 859 mlrdlik ko‘rsatkichdan past bo‘ldi.9Xitoy eksporti (yillik, CNY) oktyabrda avvalgi 29,6% dan 28,7% gacha pasaydi.


Boshlang!
Ro‘yxatdan o‘ting va 3 daqiqadan kamroq vaqt ichida Global bozorlariga kirish imkoniga ega bo‘ling

Biz bilan bog‘laning









Kontaktlar
Telefon: +61 2 8036 8388
Faks: +61 2 8036 8388
Email: support@tmgm.com



Ushbu veb-saytda taqdim etilgan ma’lumotlar faqat umumiy xususiyatga ega bo‘lib, shaxsiy moliyaviy maslahat hisoblanmaydi. Ushbu veb-saytdagi har qanday ma’lumot asosida harakat qilishdan oldin, ma’lumotning sizning maqsadlaringiz, moliyaviy ahvolingiz va ehtiyojlaringizga mosligini ko‘rib chiqishingiz kerak. CFD va FX Margin shartnomalariga sarmoya kiritish sezilarli xavflarni o‘z ichiga oladi va barcha investorlar uchun mos emas. Siz boshlang‘ich depozitingizdan ko‘proq yo‘qotishingiz mumkin. Siz asosiy aktivga egalik qilmaysiz va unda hech qanday manfaatga ega emassiz. Savdo qilishdan oldin mustaqil maslahat olishni va ishtirok etuvchi xavflarni to‘liq tushunishingizni tavsiya qilamiz. Veb-saytda keltirilgan har qanday mahsulotni xarid qilishdan oldin oshkor qilish hujjatini o‘qib chiqishingiz va ko‘rib chiqishingiz muhimdir. Ushbu veb-saytda taklif etilgan ma’lumotlar va reklama materiallari bunday foydalanish mahalliy qonunlar va qoidalarga zid bo‘ladigan har qanday mamlakat yoki yurisdiksiyadagi shaxslar tomonidan foydalanish uchun mo‘ljallanmagan. Ushbu veb-saytda taklif etilgan Mahsulotlar va Xizmatlar AQSh, Malayziya va Tailand rezidentlari uchun mo‘ljallanmagan.
TMGM turli yurisdiksiyalarda vakolatli va tartibga solinadi.
Trademax Australia Limited, TMGM nomi ostida faoliyat yuritadi, Avstraliya Qimmatli qog‘ozlar va investitsiyalar komissiyasi (ASIC) tomonidan tartibga solinadi, AFSL raqami 436416 va manzili: Level 28, One International Tower, 100 Barangaroo Avenue, 2000 Sydney, NSW Australia.
Email: support@tmgm.com.au
Trademax Global Limited, TMGM nomi ostida faoliyat yuritadi, Vanuatu Moliyaviy Xizmatlar Komissiyasi (VFSC) tomonidan vakolatli va tartibga solinadi, ro‘yxatga olish raqami 40356 va ro‘yxatdan o‘tgan manzili: 1276, Kumul Highway, Port Vila, Vanuatu, Vanuatu Respublikasi.
Email: support@tmgm.com
Trademax Global Markets (SE) Limited, TMGM nomi ostida faoliyat yuritadi, Seyshel orollari Moliyaviy Xizmatlar Boshqarmasi (FSA) tomonidan 224-sonli SD litsenziyasi bilan vakolatli va tartibga solinadi. Kompaniya Office No 13, Providence Estate ABIS Centre, Mahe, Seychelles manzilida ro‘yxatdan o‘tgan.
Email: support@tmgm.com
Trademax Global Markets (International) Pty Ltd, TMGM nomi ostida faoliyat yuritadi, Mauritius Moliyaviy Xizmatlar Komissiyasi (FSC) tomonidan GB22201012 litsenziya raqami bilan vakolatli va tartibga solinadi hamda 33, Edith Cavell Street C/o IQ EQ Fund Services (Mauritius) Ltd Port Louis, 11324 Mauritius manzilida ro‘yxatdan o‘tgan.
Email: support@tmgm.com
Mualliflik huquqi © TMGM. Barcha huquqlar himoyalangan