

Trading
Explore a wide range of markets with competitive pricing, deep liquidity, and advanced trading tools.
Learn More 
Platform
Trade seamlessly with TMGM's powerful platform, built for speed, precision, and a superior trading experience.
Learn More Trading Platform
Academy
Learn the fundamentals of trading with beginner-friendly resources, including guides, webinars, and market insights.
Learn More News & Analysis
Get real-time market updates and expert analysis to stay ahead of trading opportunities
Learn More News & Analysis
About
Learn what sets TMGM apart — our global presence, regulatory strength, and commitment to innovation in trading.
Learn More Why Choose TMGM
Sponsorship
Crypto Today: Bitcoin, Ethereum and XRP consolidate amid weak market sentiment
- Bitcoin hovers above $78,000, building on the 100-day EMA support as market sentiment remains weak.
- Ethereum shows signs of recovery near $2,300, though upside remains technically capped.
- XRP upholds short-term $1.25 support, but risks deeper losses as major moving averages and other technical indicators weigh.
Bitcoin (BTC) trades in lockstep around the initial $78,000 psychological support on Monday. This consolidation follows a sharp correction last week, triggered by investor reaction to the $6.3 billion Binance hack. Meanwhile, Ethereum (ETH) trades near $2,300, ticking up for the third straight day. Despite the subtle recovery from support around $2,200, caution remains dominant among traders, given key structural hurdles likely to limit ETH’s potential.
Ripple (XRP), on the other hand, is consolidating marginally above the $1.25 demand area as bulls eye a short-term recovery toward the next hurdle in the $1.30-$1.33 range.
Market sentiment falters, limiting recovery potential
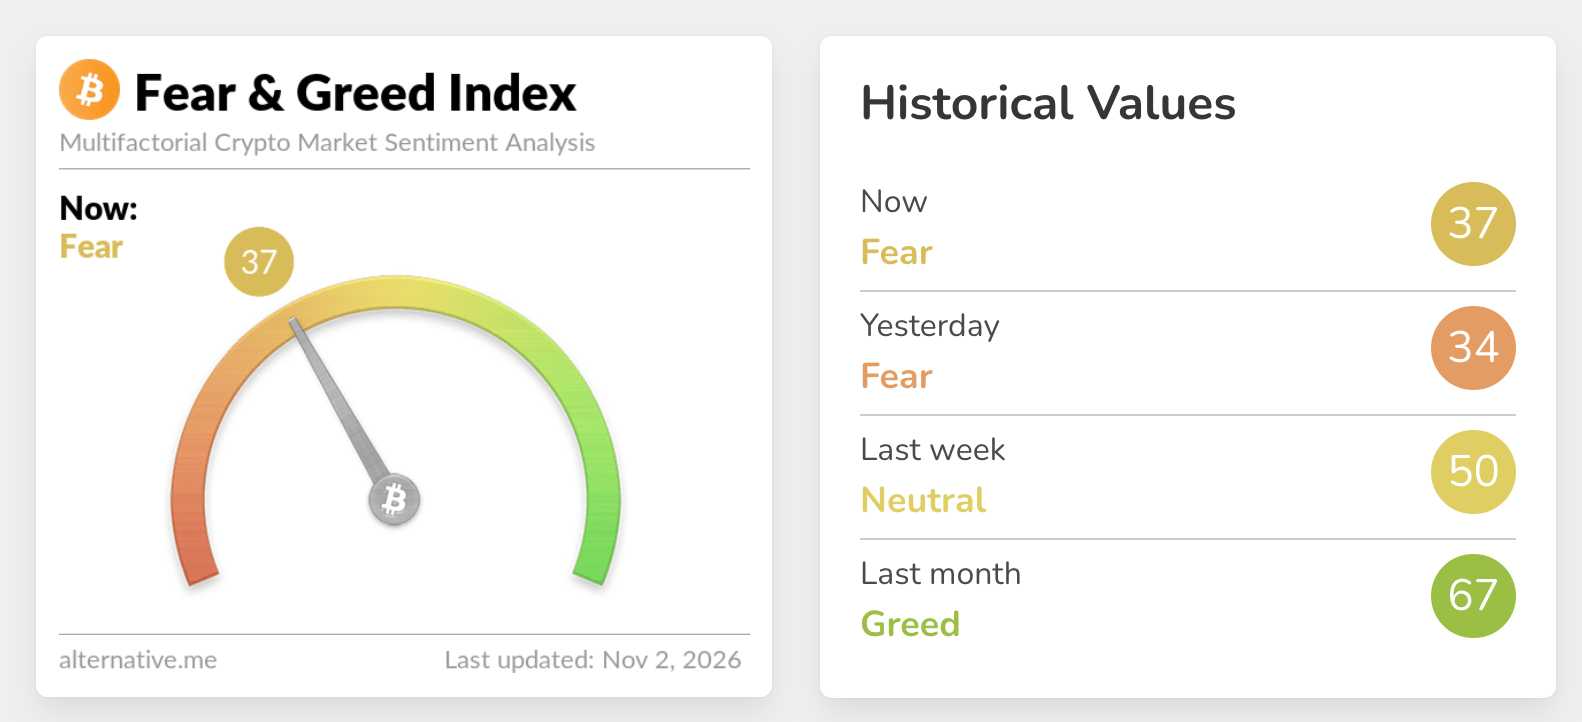
Appetite for digital assets took a major hit following the extensive security breach at Binance, the largest cryptocurrency exchange, which led to the loss of approximately $6.3 billion. The broad, sharp correction in crypto prices drove many investors on edge. It also triggered a notable drop in market sentiment as reflected in the Fear & Greed Index at 37 in Fear territory on Monday, up only slightly from 34 the day before.
Looking back, the index paints a pale picture compared with last week’s neutral outlook at 50 and the previous month’s Greed market sentiment at 37. The coming days and weeks will confirm the market's direction, with increased appetite boosting recovery potential. On the other hand, sustained weak market sentiment may keep investors sidelined, increasing the odds of a downtrend developing.
“Binance's recovery is on track so far: withdrawals reopened across 15 networks, with a net outflow of $3.64 billion, about 2.1% of assets. It says 95% of stolen funds are covered, though its full proof of reserves has slipped to Tuesday,” QCP ‘Market Colour’ report said, adding, “The attacker still holds the BTC and is splitting it into 1,000 and 100 BTC pieces.”
Technical analysis: Bitcoin holds lower key support
Bitcoin trades at $78,149, retaining a bearish near-term bias as price holds below the 50-day Exponential Moving Average (EMA) at roughly $80,295 and the SuperTrend resistance around $83,470. The pair still trades above the 100-day and 200-day EMAs at about $77,825 and $76,484, respectively, suggesting the broader uptrend structure is intact even as the latest pullback exerts pressure.
Momentum remains weak, with the Relative Strength Index (RSI) hovering near 39 and the Moving Average Convergence Divergence (MACD) staying negative, suggesting rallies could struggle while these overhead levels cap gains.
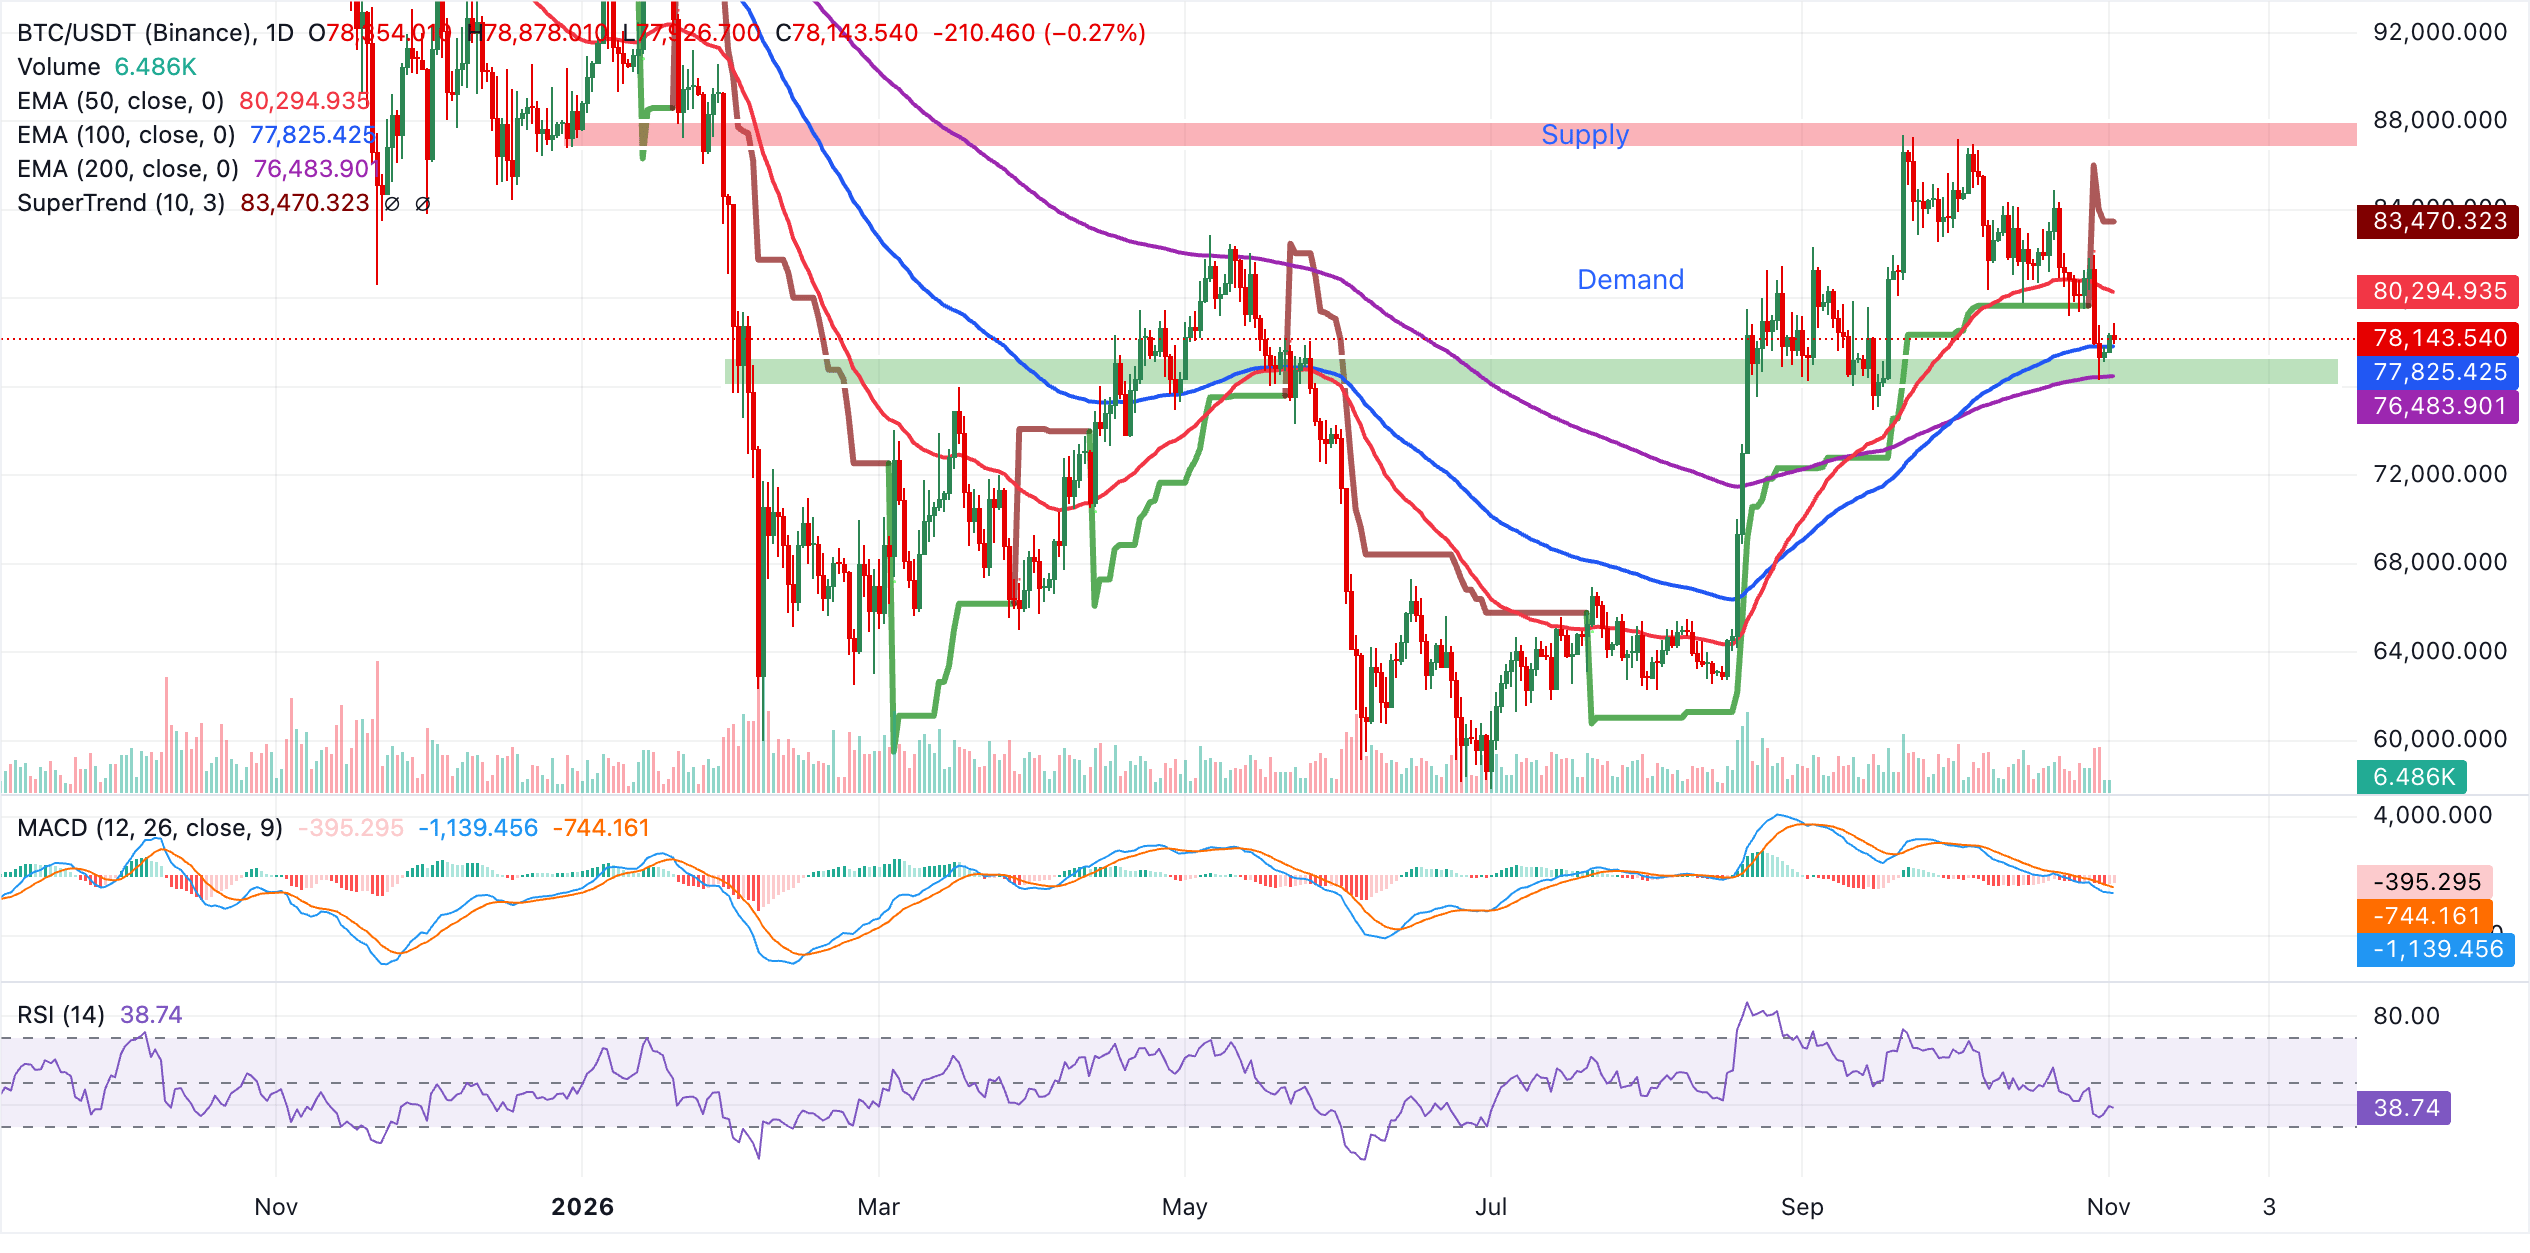
Initial resistance comes from the 50-day EMA near $80,295, with a subsequent barrier at the SuperTrend line around $83,470, reinforcing a broader supply zone. On the downside, immediate support is seen at the 100-day EMA around $77,825, ahead of the 200-day EMA at approximately $76,484, where a break lower would expose the pair to a deeper corrective phase within the daily range.
Ethereum technical analysis: ETH bulls push to regain trend control
Ethereum trades at $2,291, keeping a bearish near-term tone as it sits below the 200-day EMA at $2,317 and the 100-day EMA at $2,353. The 50-day EMA is higher, near $2,417, and the SuperTrend line is at $2,490, reinforcing a layered overhead supply zone, suggesting rallies are likely to face selling pressure.
The RSI has recovered from oversold territory toward 37 but remains bearish, while the MACD stays negative despite contracting losses, hinting that downside momentum is easing but not yet reversed.
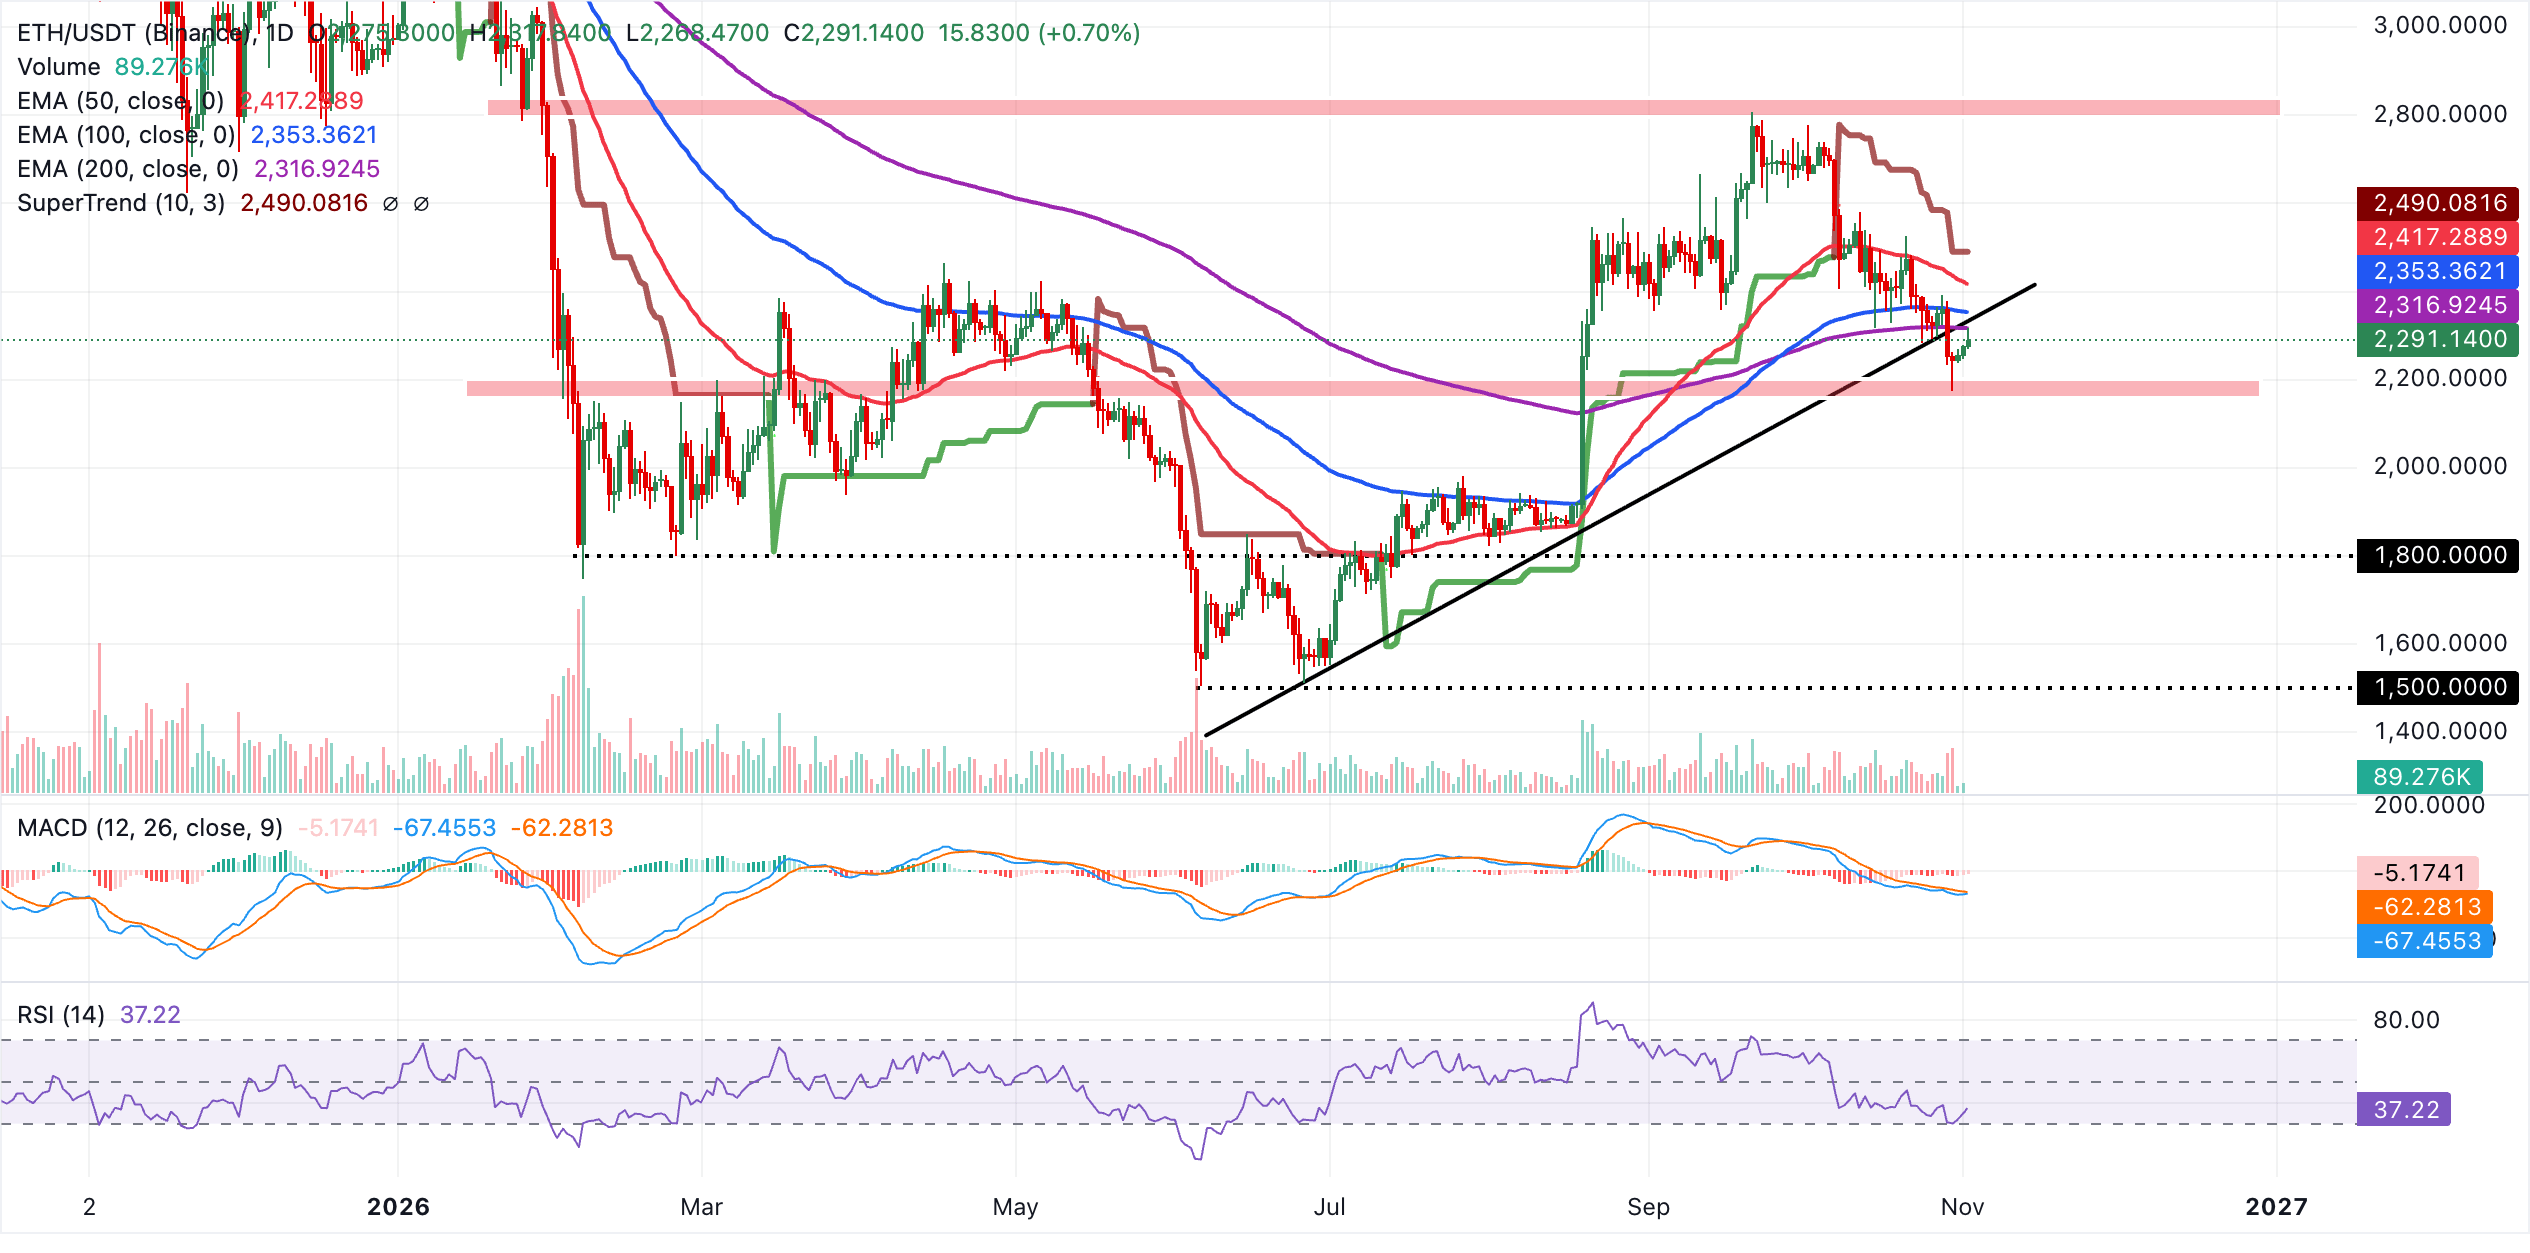
Immediate resistance emerges at the 200-day EMA around $2,317, followed by the broken rising trendline region near $2,335 and the 100-day EMA at $2,353. Further gains would need to clear the 50-day EMA at $2,417 before bulls can challenge the SuperTrend barrier around $2,490. With no nearby structural supports printed below the current price in this dataset, ETH remains vulnerable to renewed downside as long as it trades under these clustered moving averages and trend resistance.
Technical analysis: XRP upholds sideways trading
XRP hovers at $1.25, keeping a bearish tone as price holds below the key moving averages and the recently reclaimed downtrend line. The 100-day, 50-day and 200-day EMAs at $1.33, $1.34 and $1.37, respectively, sit overhead, suggesting rallies remain capped as the pair struggles to recover from its recent slide.
Momentum is soft, with the RSI hovering near 37 and the MACD indicator still below zero, reinforcing the risk of further downside as the market lacks sustained buying interest.
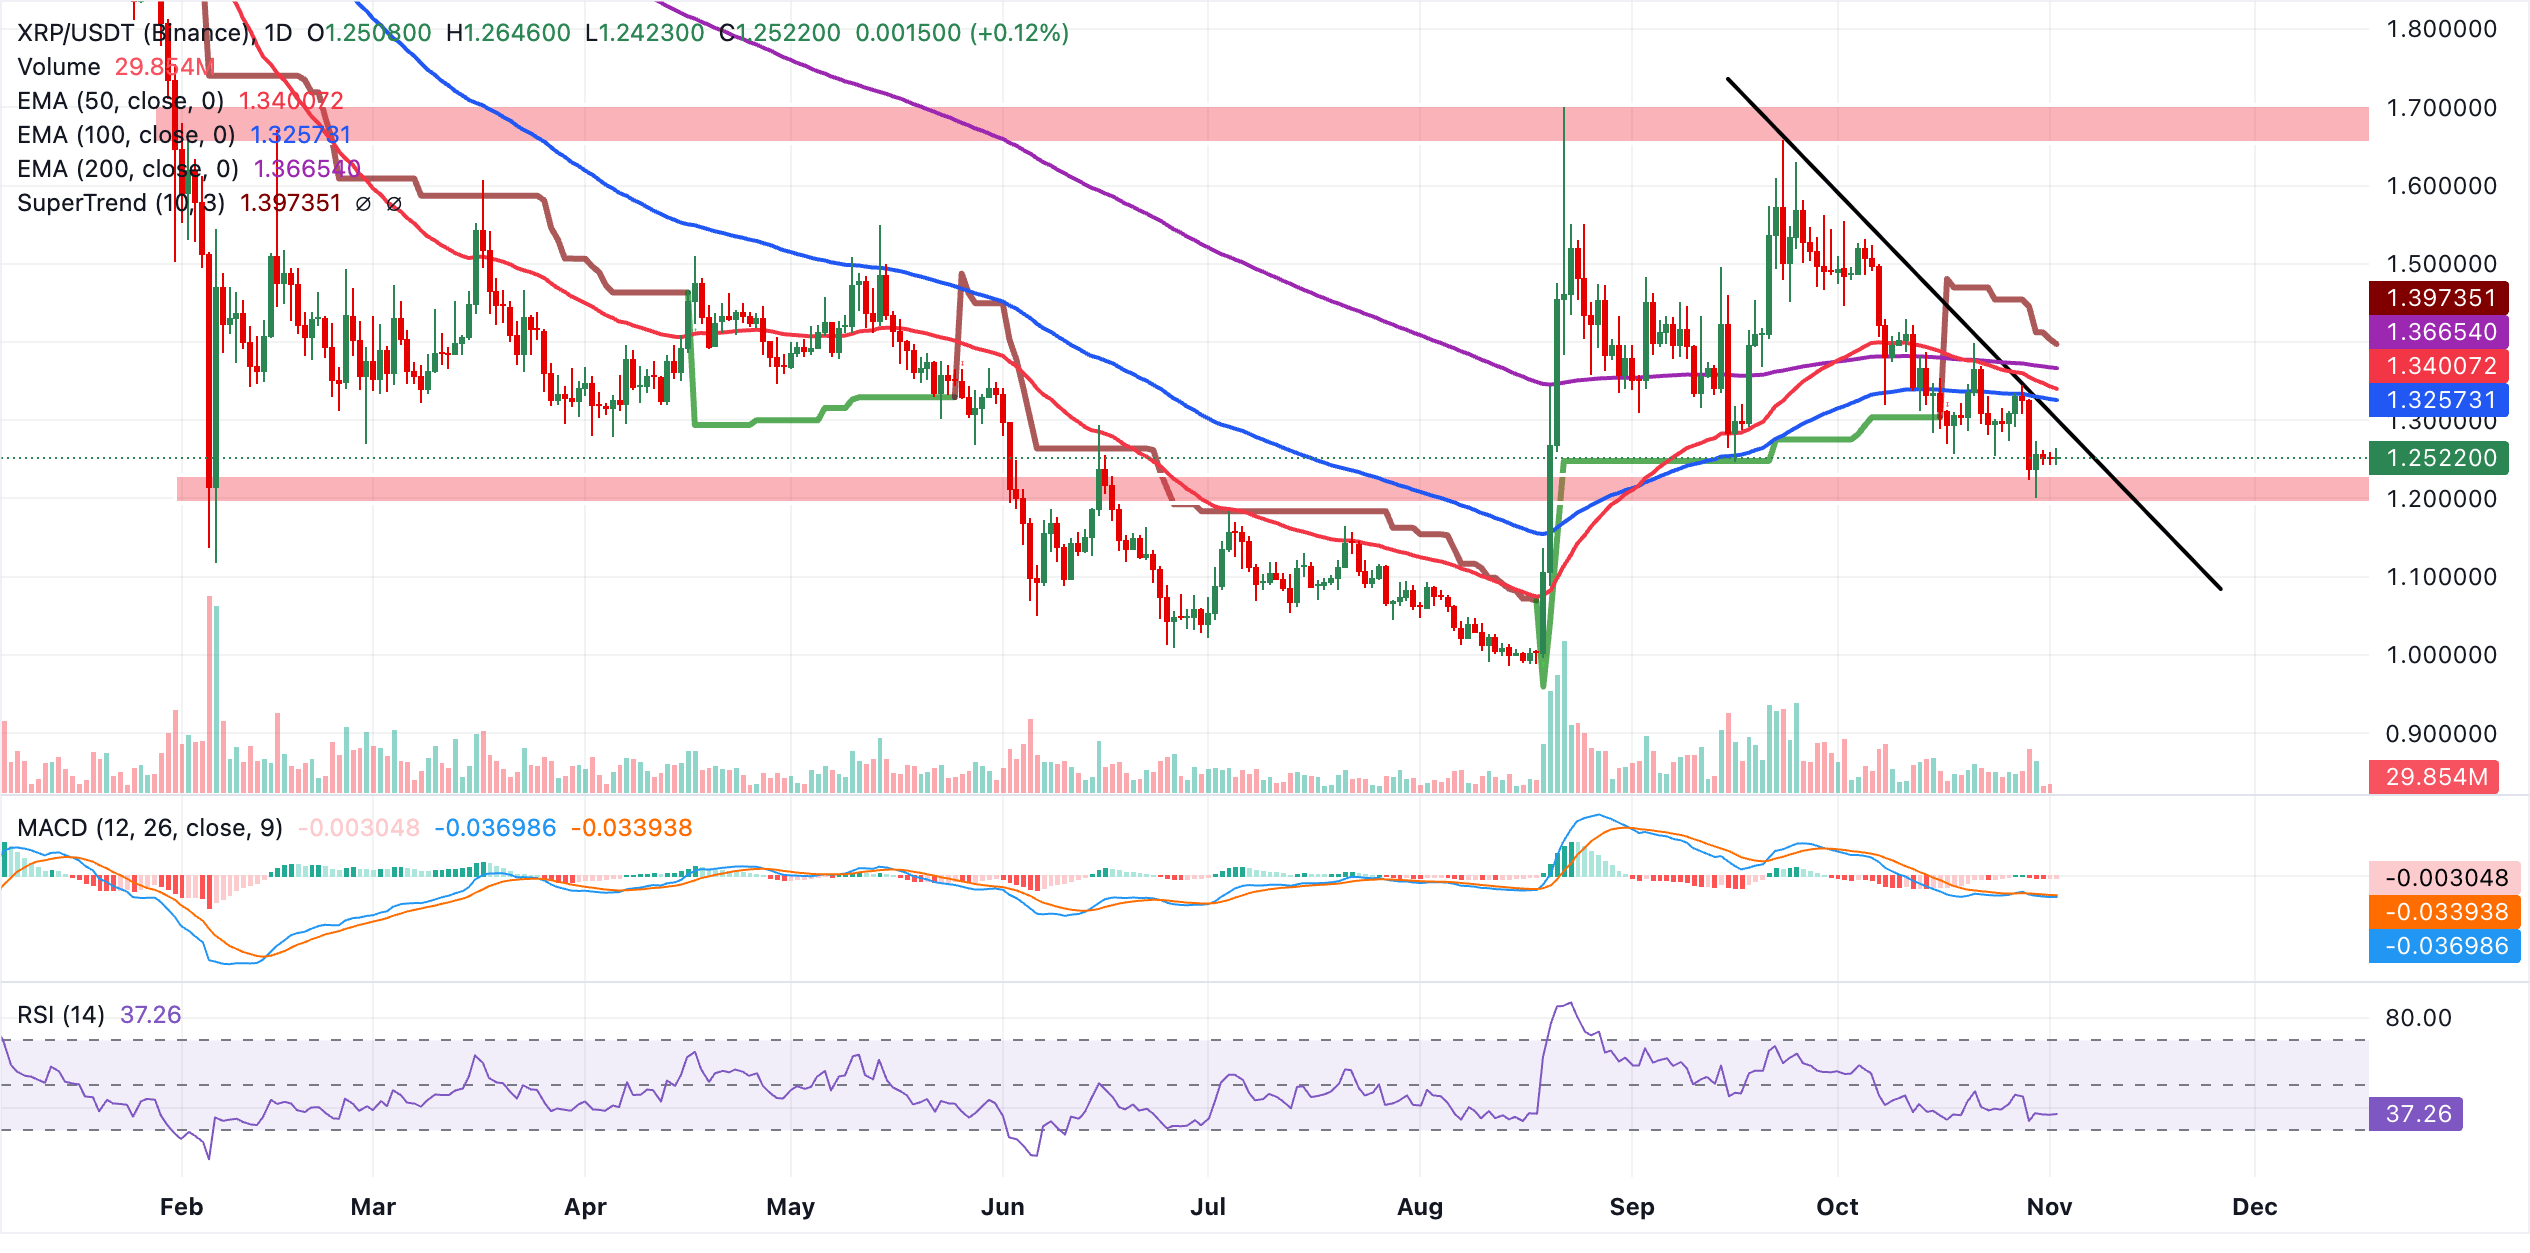
Initial resistance aligns with the former downtrend line break level near $1.30, followed by the 100-day EMA at $1.33 as the next hurdle. Above these technical levels, the 50-day EMA at $1.34 and the 200-day EMA at $1.37 define a broader supply zone before the SuperTrend barrier at $1.40 comes into play.
With no clear nearby support levels from the current indicator set on the daily chart, traders may look to intraday price action and previous swing lows for potential floors, while any bounce is likely to be treated as corrective as long as XRP trades under the clustered EMAs.
(The technical analysis of this story was written with the help of an AI tool. Know more.)
Bitcoin, altcoins, stablecoins FAQs
Bitcoin is the largest cryptocurrency by market capitalization, a virtual currency designed to serve as money. This form of payment cannot be controlled by any one person, group, or entity, which eliminates the need for third-party participation during financial transactions.
Altcoins are any cryptocurrency apart from Bitcoin, but some also regard Ethereum as a non-altcoin because it is from these two cryptocurrencies that forking happens. If this is true, then Litecoin is the first altcoin, forked from the Bitcoin protocol and, therefore, an “improved” version of it.
Stablecoins are cryptocurrencies designed to have a stable price, with their value backed by a reserve of the asset it represents. To achieve this, the value of any one stablecoin is pegged to a commodity or financial instrument, such as the US Dollar (USD), with its supply regulated by an algorithm or demand. The main goal of stablecoins is to provide an on/off-ramp for investors willing to trade and invest in cryptocurrencies. Stablecoins also allow investors to store value since cryptocurrencies, in general, are subject to volatility.
Bitcoin dominance is the ratio of Bitcoin's market capitalization to the total market capitalization of all cryptocurrencies combined. It provides a clear picture of Bitcoin’s interest among investors. A high BTC dominance typically happens before and during a bull run, in which investors resort to investing in relatively stable and high market capitalization cryptocurrency like Bitcoin. A drop in BTC dominance usually means that investors are moving their capital and/or profits to altcoins in a quest for higher returns, which usually triggers an explosion of altcoin rallies.
Top Articles
1Gold finds relief from Oil’s decline as traders await key US economic data2British Pound retreats from two-week highs despite upbeat UK manufacturing activity3Crypto Today: Bitcoin, Ethereum and XRP consolidate amid weak market sentiment4Gold: Rebounds from one-year Low as rate risks persist – ING5Australian Dollar: RBA hike hopes lift AUD against US Dollar - Societe Generale6Japanese Yen treads water despite moderate US Dollar weakness7Euro gains against Canadian Dollar following German data8Silver price today: Silver rises, according to FXStreet data9British Pound: Resilience sustained but bar higher – OCBC

Get Started!
Sign up and access the Global Markets in less than 3 minutes

Connect With Us









Contacts
Phone: +61 2 8036 8388
Fax: +61 2 8036 8388
Email: support@tmgm.com



The information provided on this website is of a general nature only and does not constitute personal financial advice. Before acting on any information on this website, you should consider the suitability of the information in relation to your objectives, financial situation and needs. Investing in CFDs and FX Margin Contracts carries significant risks and is not suitable for all investors. You may lose more than your initial deposit. You do not own, or have, any interest in the underlying asset. We recommend that you seek independent advice and ensure you fully understand the risks involved before trading. It is important that you read and consider the disclosure document before you acquire any product listed on the website. The information and advertisements offered on this website are not intended for use by any person in any country or jurisdiction where such use would be contrary to local laws and regulations. The Products and Services offered on this website are not intended for residents of the United States, Malaysia and Thailand.
TMGM is authorized and regulated in various jurisdictions.
Trademax Australia Limited, trading as TMGM, is regulated by the Australian Securities and Investments Commission (ASIC), AFSL no. 436416 and is located at Level 28, One International Tower, 100 Barangaroo Avenue, 2000 Sydney, NSW Australia.
Email: support@tmgm.com.au
Trademax Global Limited, trading as TMGM, is authorized and regulated by the Vanuatu Financial Services Commission (VFSC), registration number 40356 and registered at 1276, Kumul Highway, Port Vila, Vanuatu, Republic of Vanuatu.
Email: support@tmgm.com
Trademax Global Markets (SE) Limited, trading as TMGM, is authorized and regulated by the Financial Services Authority (FSA) of Seychelles, with license number SD224. The company is registered at Office No 13, Providence Estate ABIS Centre, Mahe, Seychelles.
Email: support@tmgm.com
Trademax Global Markets (International) Pty Ltd, trading as TMGM, is authorized and regulated by the Financial Services Commission, Mauritius (FSC) with license no. GB22201012, and registered at 33, Edith Cavell Street C/o IQ EQ Fund Services (Mauritius) Ltd Port Louis, 11324 Mauritius.
Email: support@tmgm.com
Copyright © TMGM. All rights reserved