

التداول
اكتشف مجموعة متنوعة من الأسواق العالمية مع تسعير تنافسي، سيولة عالية، وأدوات تداول متقدمة تدعم قراراتك الاستثمارية.
اكتشف المزيد 
منصات التداول
تداول بسلاسة مع منصة TMGM القوية، المصممة للسرعة والدقة وتجربة تداول فائقة.
اكتشف المزيد منصات التداول
الأكاديمية
تعلّم أساسيات التداول من خلال محتوى تعليمي مُبسط ومصمم للمبتدئين، يشمل أدلة تعليمية،ندوات مباشرة عبر الإنترنت، وتحليلات لأهم تحركات السوق.
اكتشف المزيد أكاديمية TMGM
الأخبار والتحليلات
تابع أحدث تطورات الأسواق لحظة بلحظة، مع تحليلات احترافية تساعدك على اتخاذ قرارات مدروسة والاستفادة من فرص التداول.
اكتشف المزيد الأخبار والتحليلات
معلومات عنا
تعرّف على ما يميز TMGM، من حضور عالمي قوي وإشراف تنظيمي موثوق، إلى التزامنا المستمر بالابتكار وتطوير بيئة تداول متقدمة.
اكتشف المزيد لماذا TMGM؟
Bitcoin Price Forecast: BTC stalls around $80,000 as geopolitical tensions dampen risk appetite
- Bitcoin hovers around $80,500 on Monday after three straight weeks of correction.
- US-listed spot ETFs recorded $301 million in net inflows last week, breaking a two-week outflow streak.
- Rising geopolitical tensions in the Middle East continue to push oil prices higher, stoking inflation concerns and dampening risk appetite.
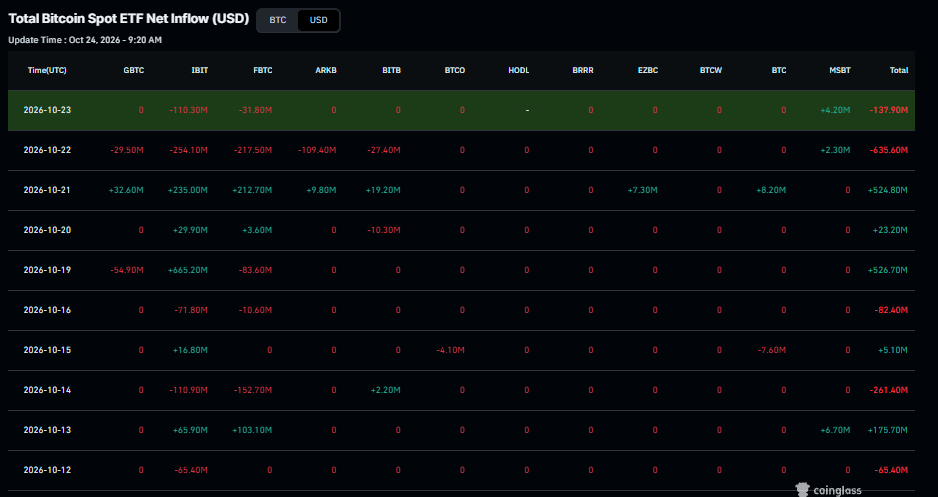
Bitcoin (BTC) hovers around $80,500 at the time of writing on Monday, after extending its correction for three consecutive weeks. Despite this price weakness, institutional demand showed signs of a comeback with spot Exchange Traded Funds (ETFs) recording $301.2 million in net inflows last week, breaking a two-week outflow streak.
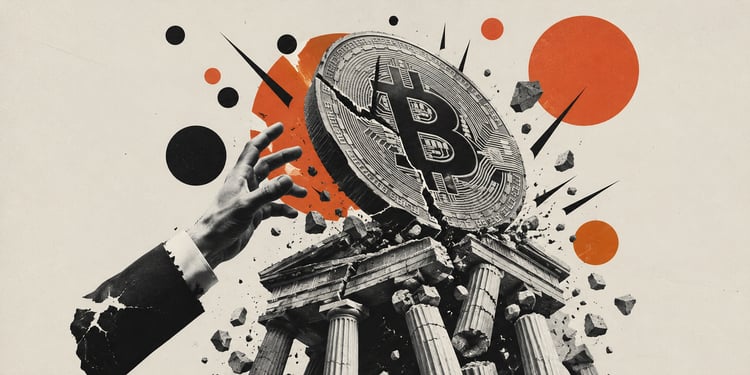
However, rising crude oil prices and escalating geopolitical tensions in the Middle East continue to fuel inflation concerns and dampen risk appetite, keeping pressure on the Crypto King.
Institutional demand shows early signs of a comeback
Institutional demand showed some signs of optimism last week, despite the price pullback. CoinGlass Bitcoin spot ETFs recorded a net inflow of $301.2 million last week, breaking a two-week outflow streak. Despite this improvement in demand, BTC price continued its pullback, down over 2% last week and ending with three straight weeks of correction since early October. If these inflows continue and intensify through this week, they could help cushion the ongoing price decline.
Geopolitical tensions and rising oil prices weigh on BTC
Crude oil prices have jumped to the highest level since September 15, with West Texas Intermediate (WTI) reaching $103.28 per barrel on Friday amid supply concerns driven by attacks in Saudi Arabia and tensions involving Iran.
In the latest developments, the Iran-backed Houthis in Yemen vowed on Sunday that they will keep attacking Saudi Arabia's King Khalid Airport in Riyadh.
Meanwhile, stalled US-Iran negotiations are keeping the geopolitical risk premium elevated, adding further upward pressure on oil prices. Persistently higher energy costs could fuel inflation concerns, dampening risk appetite and capping BTC's upside potential.
Bitcoin technical outlook: BTC shows weakening signs
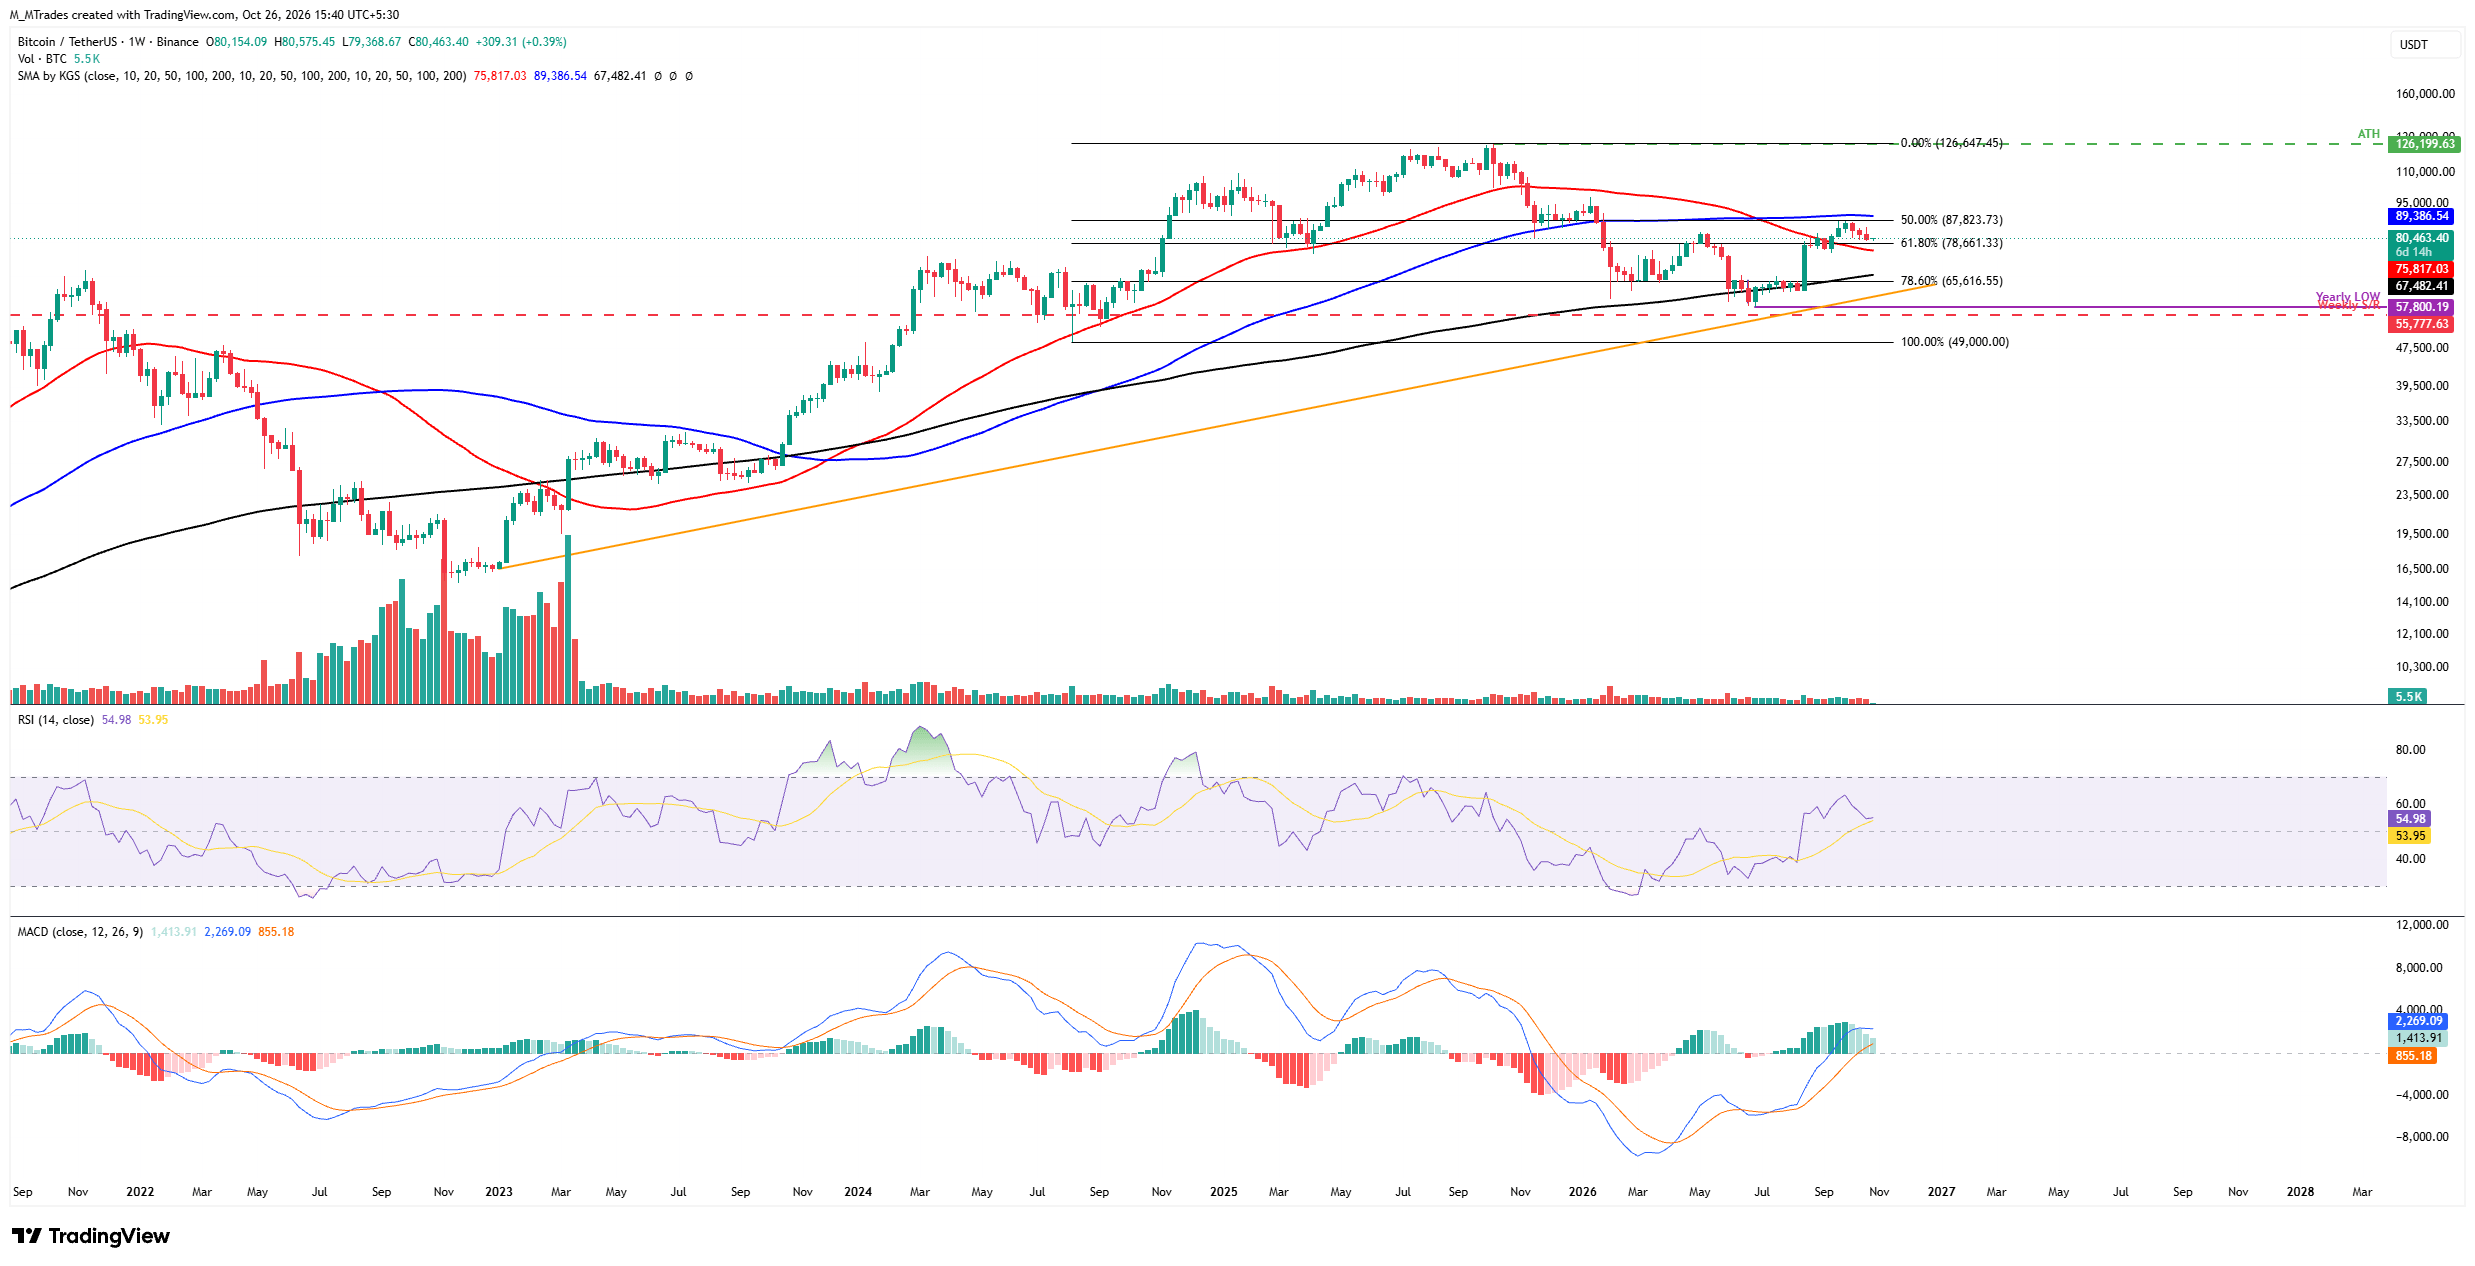
The Crypto King hovers around $80,400 on Monday, after a 2.39% correction last week and marking the third straight week of losses since early October.
If BTC continues its correction, it could extend losses toward the 61.8% Fibonacci retracement level of $78,661 (drawn from the August 2024 low of $49,000 to the October 2025 record high of $126,199), which roughly coincides with the 50-week Simple Moving Average (SMA) at $75,817.
The Relative Strength Index (RSI) on the weekly chart stands near 54, pointing downward toward the neutral 50 level, indicating that bullish momentum is cooling. Meanwhile, the Moving Average Convergence Divergence (MACD) histogram remains positive, although its bars are weakening. This suggests broader upside momentum remains intact but is losing strength amid nearby resistance and the ongoing pullback.
On the other hand, if BTC recovers, it could extend the advance toward the 50% retracement level of $87,823, then the 100-week SMA at $89,386.
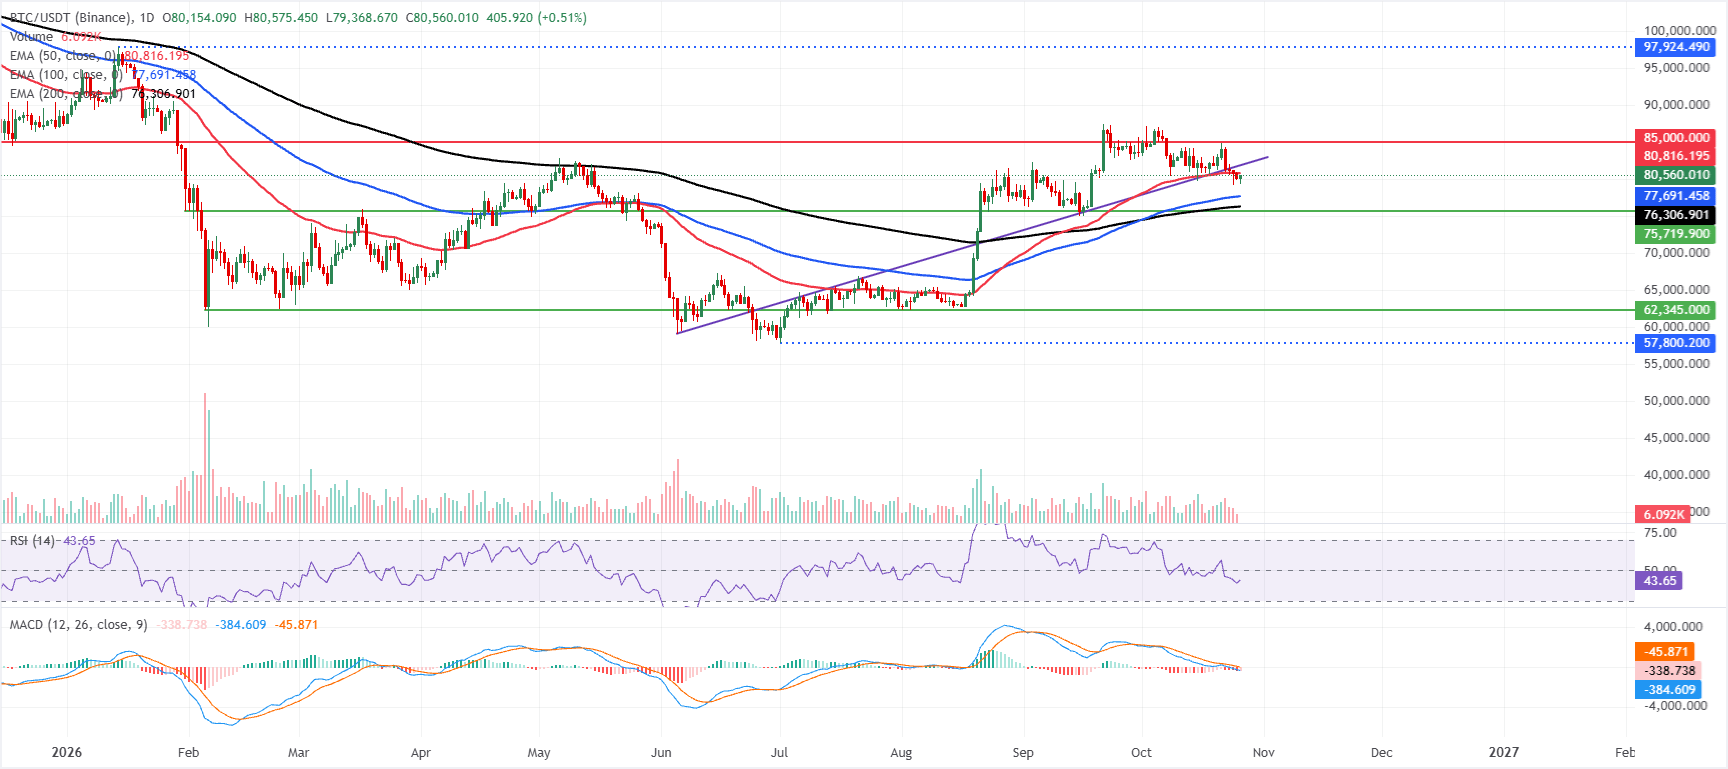
On the daily chart, BTC is consolidating in a neutral stance, holding above the 100-day and 200-day Exponential Moving Averages (EMAs) at $77,691 and $76,306, respectively, but remaining capped by the 50-day EMA at $80,816. Price between these trend filters suggests a broad bullish backdrop tempered by near-term hesitation. At the same time, the daily RSI at 43 indicates fading momentum, and the MACD remains below zero, hinting at subdued bullish momentum.
On the topside, immediate resistance is seen at the 50-day EMA at $80,816, with a stronger barrier at the horizontal level around $85,000, where previous supply could reassert itself.
On the downside, initial support emerges at the 100-day EMA at $77,691, ahead of a deeper structural floor at the 200-day EMA near $76,306, and a daily close below these underlying averages would likely tilt the near-term bias back toward a more bearish configuration.
(The technical analysis of this story was written with the help of an AI tool. Know more.)
Bitcoin, altcoins, stablecoins FAQs
Bitcoin is the largest cryptocurrency by market capitalization, a virtual currency designed to serve as money. This form of payment cannot be controlled by any one person, group, or entity, which eliminates the need for third-party participation during financial transactions.
Altcoins are any cryptocurrency apart from Bitcoin, but some also regard Ethereum as a non-altcoin because it is from these two cryptocurrencies that forking happens. If this is true, then Litecoin is the first altcoin, forked from the Bitcoin protocol and, therefore, an “improved” version of it.
Stablecoins are cryptocurrencies designed to have a stable price, with their value backed by a reserve of the asset it represents. To achieve this, the value of any one stablecoin is pegged to a commodity or financial instrument, such as the US Dollar (USD), with its supply regulated by an algorithm or demand. The main goal of stablecoins is to provide an on/off-ramp for investors willing to trade and invest in cryptocurrencies. Stablecoins also allow investors to store value since cryptocurrencies, in general, are subject to volatility.
Bitcoin dominance is the ratio of Bitcoin's market capitalization to the total market capitalization of all cryptocurrencies combined. It provides a clear picture of Bitcoin’s interest among investors. A high BTC dominance typically happens before and during a bull run, in which investors resort to investing in relatively stable and high market capitalization cryptocurrency like Bitcoin. A drop in BTC dominance usually means that investors are moving their capital and/or profits to altcoins in a quest for higher returns, which usually triggers an explosion of altcoin rallies.
المقالات الشائعة
1الدولار النيوزيلندي يرتفع مقتربًا من 0.5700 مع تزايد الرهانات على رفع بنك الاحتياطي النيوزيلندي أسعار الفائدة2الين الياباني يستقر قرب أعلى مستوى في شهر مقابل الدولار الأمريكي الضعيف مع ترقّب المتداولين اجتماعي الاحتياطي الفيدرالي وبنك اليابان3توقعات أسعار الفضة: XAG/USD يتراجع دون 54.00 دولارًا مع انحسار الطلب على الملاذات الآمنة4اليورو يرتفع قليلًا فوق مستوى 1.1200 رغم المخاوف بشأن الديون الفرنسية5الجنيه الإسترليني يرتفع قليلاً مقابل الدولار الأمريكي الضعيف مع استمرار تركيز الأنظار على اجتماع اللجنة الفيدرالية للسوق المفتوحة هذا الأسبوع6الدولار الكندي يرتفع رغم انخفاض أسعار النفط7بنك الشعب الصيني يحدد السعر المرجعي لزوج USD/CNY عند 6.7162 مقابل 6.7180 سابقًا8خام غرب تكساس الوسيط يتراجع إلى قرب 101.00 مع استبعاد ترامب شن ضربات وشيكة على إيران9الدولار الأسترالي يتراجع رغم تحذيرات بنك الاحتياطي الأسترالي من رفع أسعار الفائدة
أسعار مباشرة

كل شيء عن TECHNICAL
كتلة الأوامر في التداول: ما هي وكيف تتداول باستخدامها
الفائدة الحقيقية: كيف تعرف إن كانت مدخراتك تكسب فعلًا؟
كيف تقرأ تقرير التضخم CPI قبل أن تتداوله؟ دليل المتداول إلى الرقم الرئيسي والأساسي
الانزلاق السعري والسبريد والفجوات: لماذا يختلف سعر تنفيذك عمّا رأيته؟
VWAP وملف الحجم: كيف تقرأ القيمة العادلة داخل الجلسة وأين يتركز التداول
هيكل السوق: كسر الهيكل وتغيّر الطابع BOS وCHoCH وكيف تقرأهما دون مبالغة
دفتر التداول والاختبار الرجعي: كيف تقيس أداء استراتيجيتك بالأرقام لا بالانطباع
تداول موسم الأرباح عبر عقود الفروقات: ما الذي يحرك السهم والمؤشر وكيف تدير المخاطر
الارتباط بين الأصول: كيف تقرأ العلاقة بين الذهب والدولار وعوائد السندات
ابدأ الآن!
سجّل وابدأ التداول في الأسواق العالمية خلال أقل من 3 دقائق

تواصل معنا









جهات الاتصال
الهاتف +61 2 8036 8388
الفاكس +61 2 8036 8388
البريد الإلكتروني support@tmgm.com
الموقع الإلكتروني https://www.tmgmasia.com/en



المعلومات المقدمة على هذا الموقع الإلكتروني ذات طبيعة عامة فقط ولا تشكل نصيحة مالية شخصية. قبل اتخاذ أي إجراء بناءً على أي معلومات واردة في هذا الموقع الإلكتروني، ينبغي عليك النظر في مدى ملاءمة هذه المعلومات لأهدافك ووضعك المالي واحتياجاتك. ينطوي الاستثمار في عقود الفروقات وعقود الهامش على الفوركس على مخاطر كبيرة، وهو غير مناسب لجميع المستثمرين. قد تخسر أكثر من إيداعك الأولي. أنت لا تملك الأصل الأساسي، ولا لديك أي مصلحة فيه. نوصي بأن تطلب مشورة مستقلة وأن تتأكد من أنك تفهم تمامًا المخاطر التي تنطوي عليها قبل التداول. من المهم أن تقرأ وثيقة الإفصاح وتدرسها قبل الحصول على أي منتج مدرج على الموقع الإلكتروني. إن المعلومات والإعلانات المعروضة على هذا الموقع الإلكتروني غير مخصصة للاستخدام من قبل أي شخص في أي بلد أو ولاية قضائية يكون فيها هذا الاستخدام مخالفًا للقوانين واللوائح المحلية. المنتجات والخدمات المعروضة على هذا الموقع الإلكتروني غير مخصصة للمقيمين في الولايات المتحدة وماليزيا وتايلاند.
TMGM مرخصة ومنظمة في ولايات قضائية مختلفة.
شركة Trademax Australia Limited، التي تتداول باسم TMGM، منظمة من قبل لجنة الأوراق المالية والاستثمارات الأسترالية (ASIC)، رقم AFSL 436416 وتقع في المستوى 28، برج دولي واحد، 100 شارع بارانجارو، 2000 سيدني، نيو ساوث ويلز أستراليا.
البريد الإلكتروني: support@tmgm.com.au
شركة Trademax Global Limited، التي تتداول باسم TMGM، مرخصة ومنظمة من قبل لجنة الخدمات المالية في فانواتو (VFSC)، رقم التسجيل 40356 ومسجلة في 1276، طريق كومول السريع، بورت فيلا، فانواتو، جمهورية فانواتو.
البريد الإلكتروني: support@tmgm.com
شركة Trademax Global Markets (SE) Limited، المعروفة باسم TMGM، مرخصة ومنظمة من قبل هيئة الخدمات المالية (FSA) في سيشيل، برقم الترخيص SD224. الشركة مسجلة في المكتب رقم 13، مركز ABIS العقاري، ماهي، سيشيل.
البريد الإلكتروني: support@tmgm.com
شركة Trademax Global Markets (International) Pty Ltd، التي تتداول باسم TMGM، مرخصة ومنظمة من قبل لجنة الخدمات المالية، موريشيوس (FSC) برقم الترخيص GB22201012، ومسجلة في 33، شارع إديث كافيل c/o IQ EQ Fund Services (Mauritius) Ltd بورت لويس، 11324 موريشيوس.
البريد الإلكتروني: support@tmgm.com
حقوق الطبع والنشر © TMGM. جميع الحقوق محفوظة