

Dow Jones Industrial Average loses another round to rising bond yields
- DJIA loses another round, down around 200 points just under 52,400 as bond yields climb
- 10-year yield tops 5% for the first time since October 2023, two days before the Fed
- WTI Crude Oil above $103 after Saudi Arabia shuts its 7 million barrel-a-day Hormuz bypass
The Dow Jones Industrial Average is down around 200 points and trades just under 52,400, and the reason is less exciting than the headlines. Those are about artificial intelligence (AI) and a sell-off in chip stocks, and that story belongs to the Nasdaq Composite, down about 1%. The Dow's problem is plainer. Treasury yields are hitting their highest levels since 2023, and a government bond that pays 5% is a good reason not to buy a stock.

Why a 5% bond yield costs the Dow money
The 10-year Treasury yield sits just above 5%. Almost everything Americans borrow is priced off that number: the average 30-year mortgage is 6.76%, up from 6.15% at the start of the year, and car loans, credit cards and corporate debt reprice off the same line. It also changes the math of owning stocks. The fund that tracks the Dow pays about 1.4% a year in dividends, and the government now pays 5% to borrow your money for a decade.
The bill lands on the Dow's housing names first. Home Depot (HD) and Sherwin-Williams (SHW) sell lumber and paint into a market where fewer people move at 6.76%, so the bond market is doing the Fed's job on housing two days before the Fed votes. The 10-year last touched 5% in October 2023 and managed it for one day.
The Dow fell less because it owns the customers, not the suppliers
The AI story is real, and it started on Saturday, when the head of Anthropic published a long essay arguing that AI companies should slow how fast they make their best models more capable. The head of OpenAI agreed, and so did Elon Musk, and OpenAI ruled out a stock market listing this year. The market read that as fewer chips and data centres getting bought, which is the trade that has carried tech stocks for three years.
Nvidia (NVDA) is down around 3%, the only chipmaker the Dow owns. Broadcom (AVGO), Advanced Micro Devices (AMD), Intel (INTC) and Marvell Technology (MRVL) are down between 4% and 7%, and none of them is in the index. Microsoft (MSFT) and Amazon (AMZN), the Dow's other big tech names, buy the chips rather than sell them, and they are holding up better. The three loudest rivals in the business agreed inside a day, and the chip stocks decided that was the alarming part.
Crude Oil at $103 is a bill for 29 of the 30
Saudi Arabia shut its East-West pipeline on Friday after drone strikes, and West Texas Intermediate (WTI) Crude Oil is up about 3% above $103 a barrel, with Brent above $108. The pipeline carries up to 7 million barrels a day to the Red Sea, the kingdom's main way out since the Strait of Hormuz effectively shut in March. Saudi Arabia built it so it would not depend on the strait. It now depends on neither.
For the Dow, pricier Crude Oil is a cost. Chevron (CVX) is the one Dow company that earns more when the barrel goes up. Walmart (WMT) and McDonald's (MCD) sell to people who just paid more at the pump, and Caterpillar (CAT) sells machines that run on diesel. Crude Oil is also why the bond market is nervous: energy is most of the gap between headline inflation at 3.4% and core at 2.4%, and the bond market prices the headline.
Wednesday's hike is priced, Wednesday's chart is not
The Fed decides at 18:00 GMT on Wednesday, and futures put roughly 90% on a quarter-point increase that would lift the Fed's rate from 3.50-3.75% to 3.75-4.00%, the first hike since 2023. A hike is the Fed charging banks more to borrow overnight, and everything else follows. The decision isn't the risk, because 90% means the market has already moved for it, and part of today's 5% is that move. The risk is the chart the Fed publishes alongside it.
The Fed's June projections put the rate at 3.8% for the end of this year, 3.6% for next year and 3.4% for 2028, which is a hike now and cuts later. The bond market has priced a hike now and more hikes later, with economists polled this week expecting at least one more by March. Wednesday's projections say whether the Fed agrees with it by 2027. One of them has to move, and the press conference at 18:30 GMT is where the index finds out which.
August retail sales land at 12:30 GMT on Wednesday, with the forecast at 0.9% after a 0.6% fall. Retail sales are counted in dollars, so a jump can be the shopper coming back or the same shopper buying the same gasoline at a higher price. The control group, which strips out fuel, cars and building materials, was last at a 0.4% fall and tells you which, five and a half hours before the vote it is supposed to inform. Thursday's housing starts and building permits at 12:30 GMT are the first read on what a 6.76% mortgage does to Home Depot's customers. A Fed governor speaks Friday at 07:30 GMT.
Levels and bias
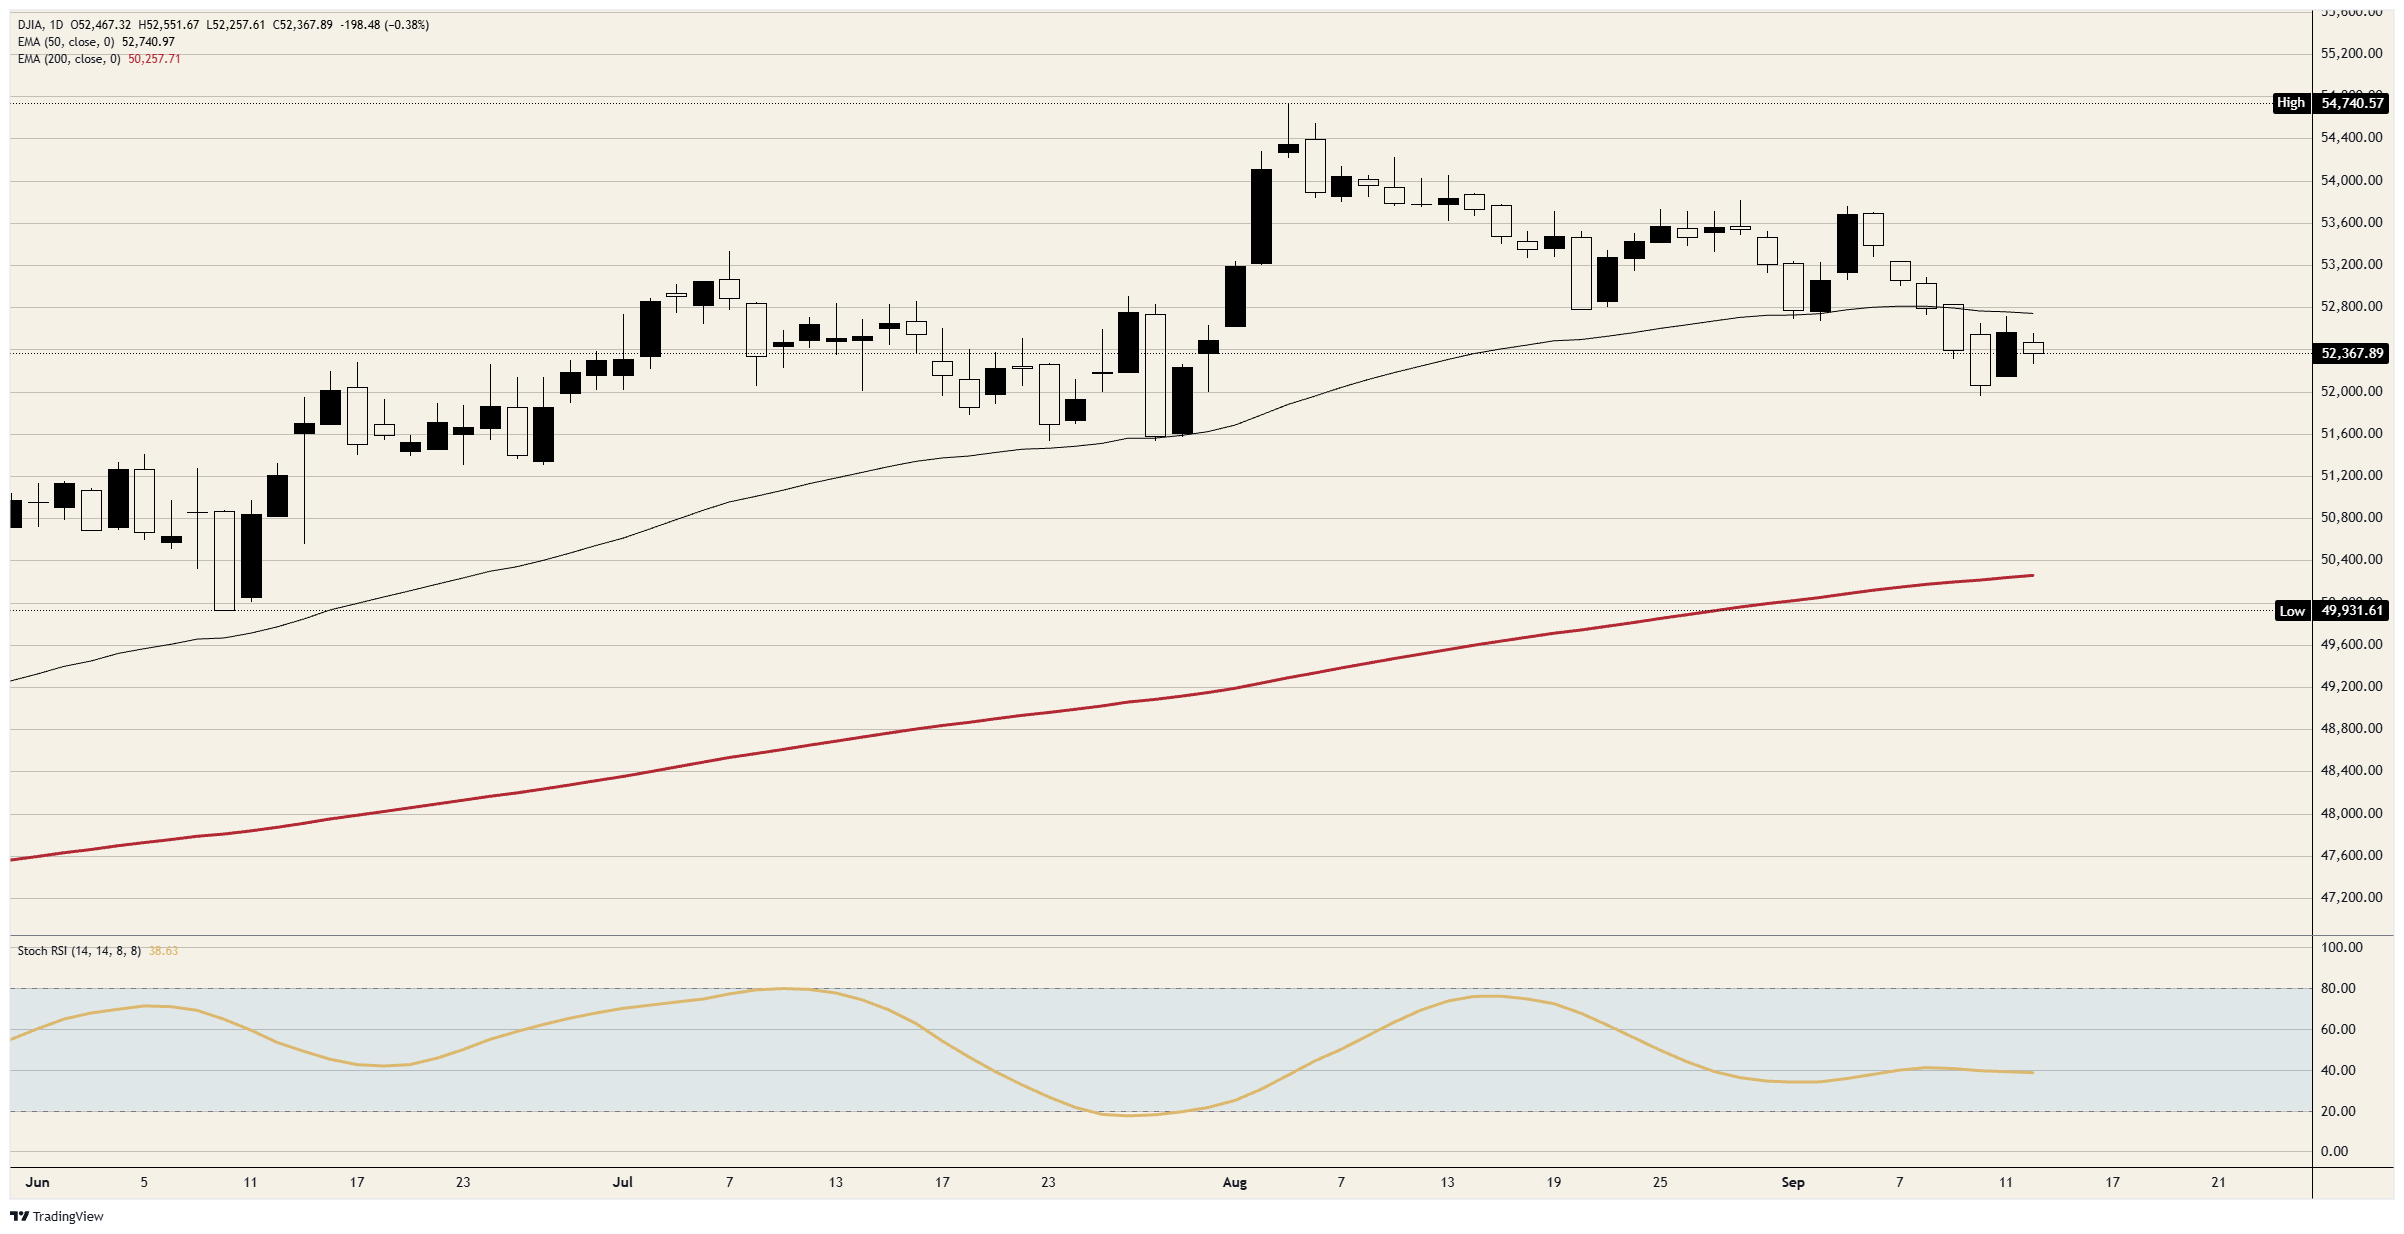
Resistance: The day's early high just above 52,500 is the first hurdle. The 50-day Exponential Moving Average (EMA) near 52,750 is the one that counts, because the index has spent three sessions failing to get back above it and Friday's rally stopped just short. 53,000 is the next one.
Support: Today's low just above 52,250 is the first floor. Thursday's low just under 52,000 is the one that matters, and below it there is nothing until the late-July base near 51,500.
Bias: Bearish while the 50-day EMA near 52,750 caps, with Thursday's low just under 52,000 the first objective and 51,500 behind it. The daily Stochastic Relative Strength Index (Stoch RSI), a momentum gauge, reads near 39 and is pointing down, so the selling has room to run. A daily close back above 53,000 voids the case.
Dow Jones daily chart
Dow Jones FAQs
The Dow Jones Industrial Average, one of the oldest stock market indices in the world, is compiled of the 30 most traded stocks in the US. The index is price-weighted rather than weighted by capitalization. It is calculated by summing the prices of the constituent stocks and dividing them by a factor, currently 0.152. The index was founded by Charles Dow, who also founded the Wall Street Journal. In later years it has been criticized for not being broadly representative enough because it only tracks 30 conglomerates, unlike broader indices such as the S&P 500.
Many different factors drive the Dow Jones Industrial Average (DJIA). The aggregate performance of the component companies revealed in quarterly company earnings reports is the main one. US and global macroeconomic data also contributes as it impacts on investor sentiment. The level of interest rates, set by the Federal Reserve (Fed), also influences the DJIA as it affects the cost of credit, on which many corporations are heavily reliant. Therefore, inflation can be a major driver as well as other metrics which impact the Fed decisions.
Dow Theory is a method for identifying the primary trend of the stock market developed by Charles Dow. A key step is to compare the direction of the Dow Jones Industrial Average (DJIA) and the Dow Jones Transportation Average (DJTA) and only follow trends where both are moving in the same direction. Volume is a confirmatory criteria. The theory uses elements of peak and trough analysis. Dow’s theory posits three trend phases: accumulation, when smart money starts buying or selling; public participation, when the wider public joins in; and distribution, when the smart money exits.
There are a number of ways to trade the DJIA. One is to use ETFs which allow investors to trade the DJIA as a single security, rather than having to buy shares in all 30 constituent companies. A leading example is the SPDR Dow Jones Industrial Average ETF (DIA). DJIA futures contracts enable traders to speculate on the future value of the index and Options provide the right, but not the obligation, to buy or sell the index at a predetermined price in the future. Mutual funds enable investors to buy a share of a diversified portfolio of DJIA stocks thus providing exposure to the overall index.











