
News & AnalysisCareer

The $3.40 support level prompted a rebound on Monday, leaving NEAR Protocol (NEAR) holding above $3.50 on Tuesday. The AI token nevertheless faces pressure from subdued institutional interest and steadily weakening retail demand, alongside a negative Coinbase premium and futures outflows. With several resistance levels continuing to cap the price, NEAR’s technical outlook remains bearish.

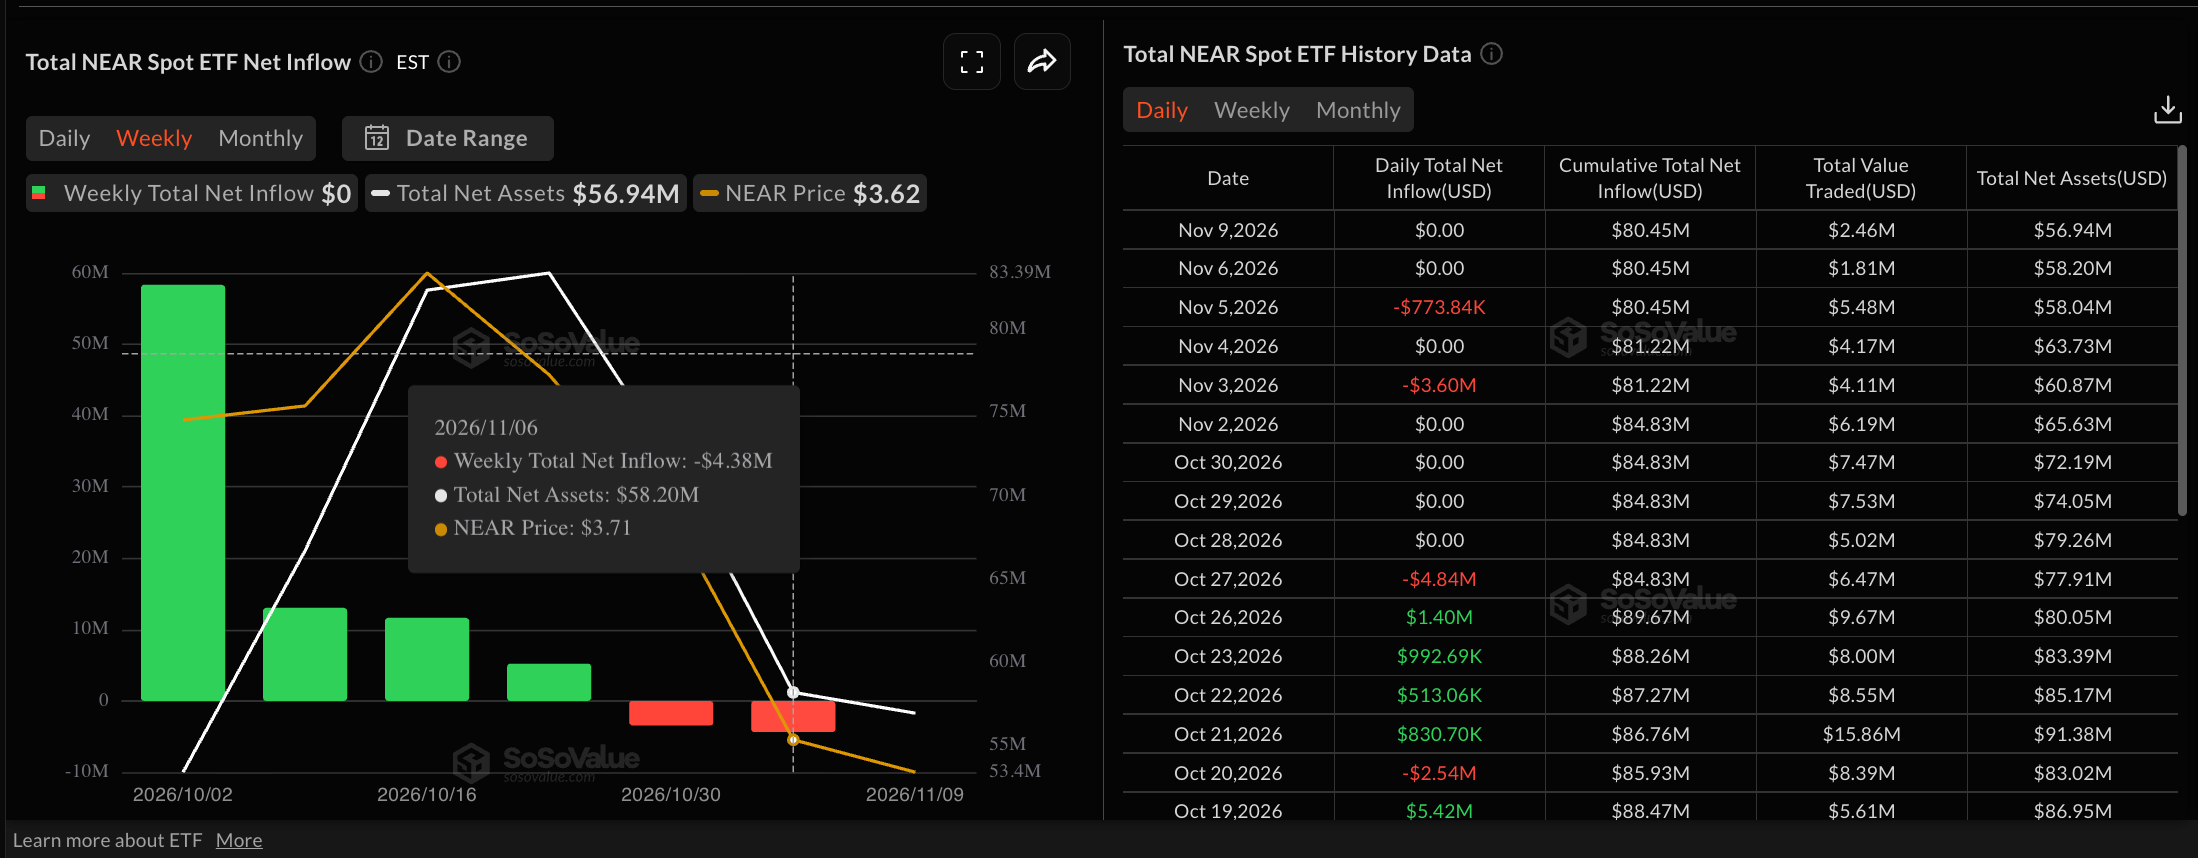
Zero net flows on Monday followed withdrawals of $4.38 million and $3.43 million over the preceding two weeks, according to SoSoValue data. NEAR ETFs therefore remain under pressure after a couple of weeks of net redemptions. Sustained outflows generally indicate that institutional investors are withdrawing funds, signalling diminished confidence in the asset.
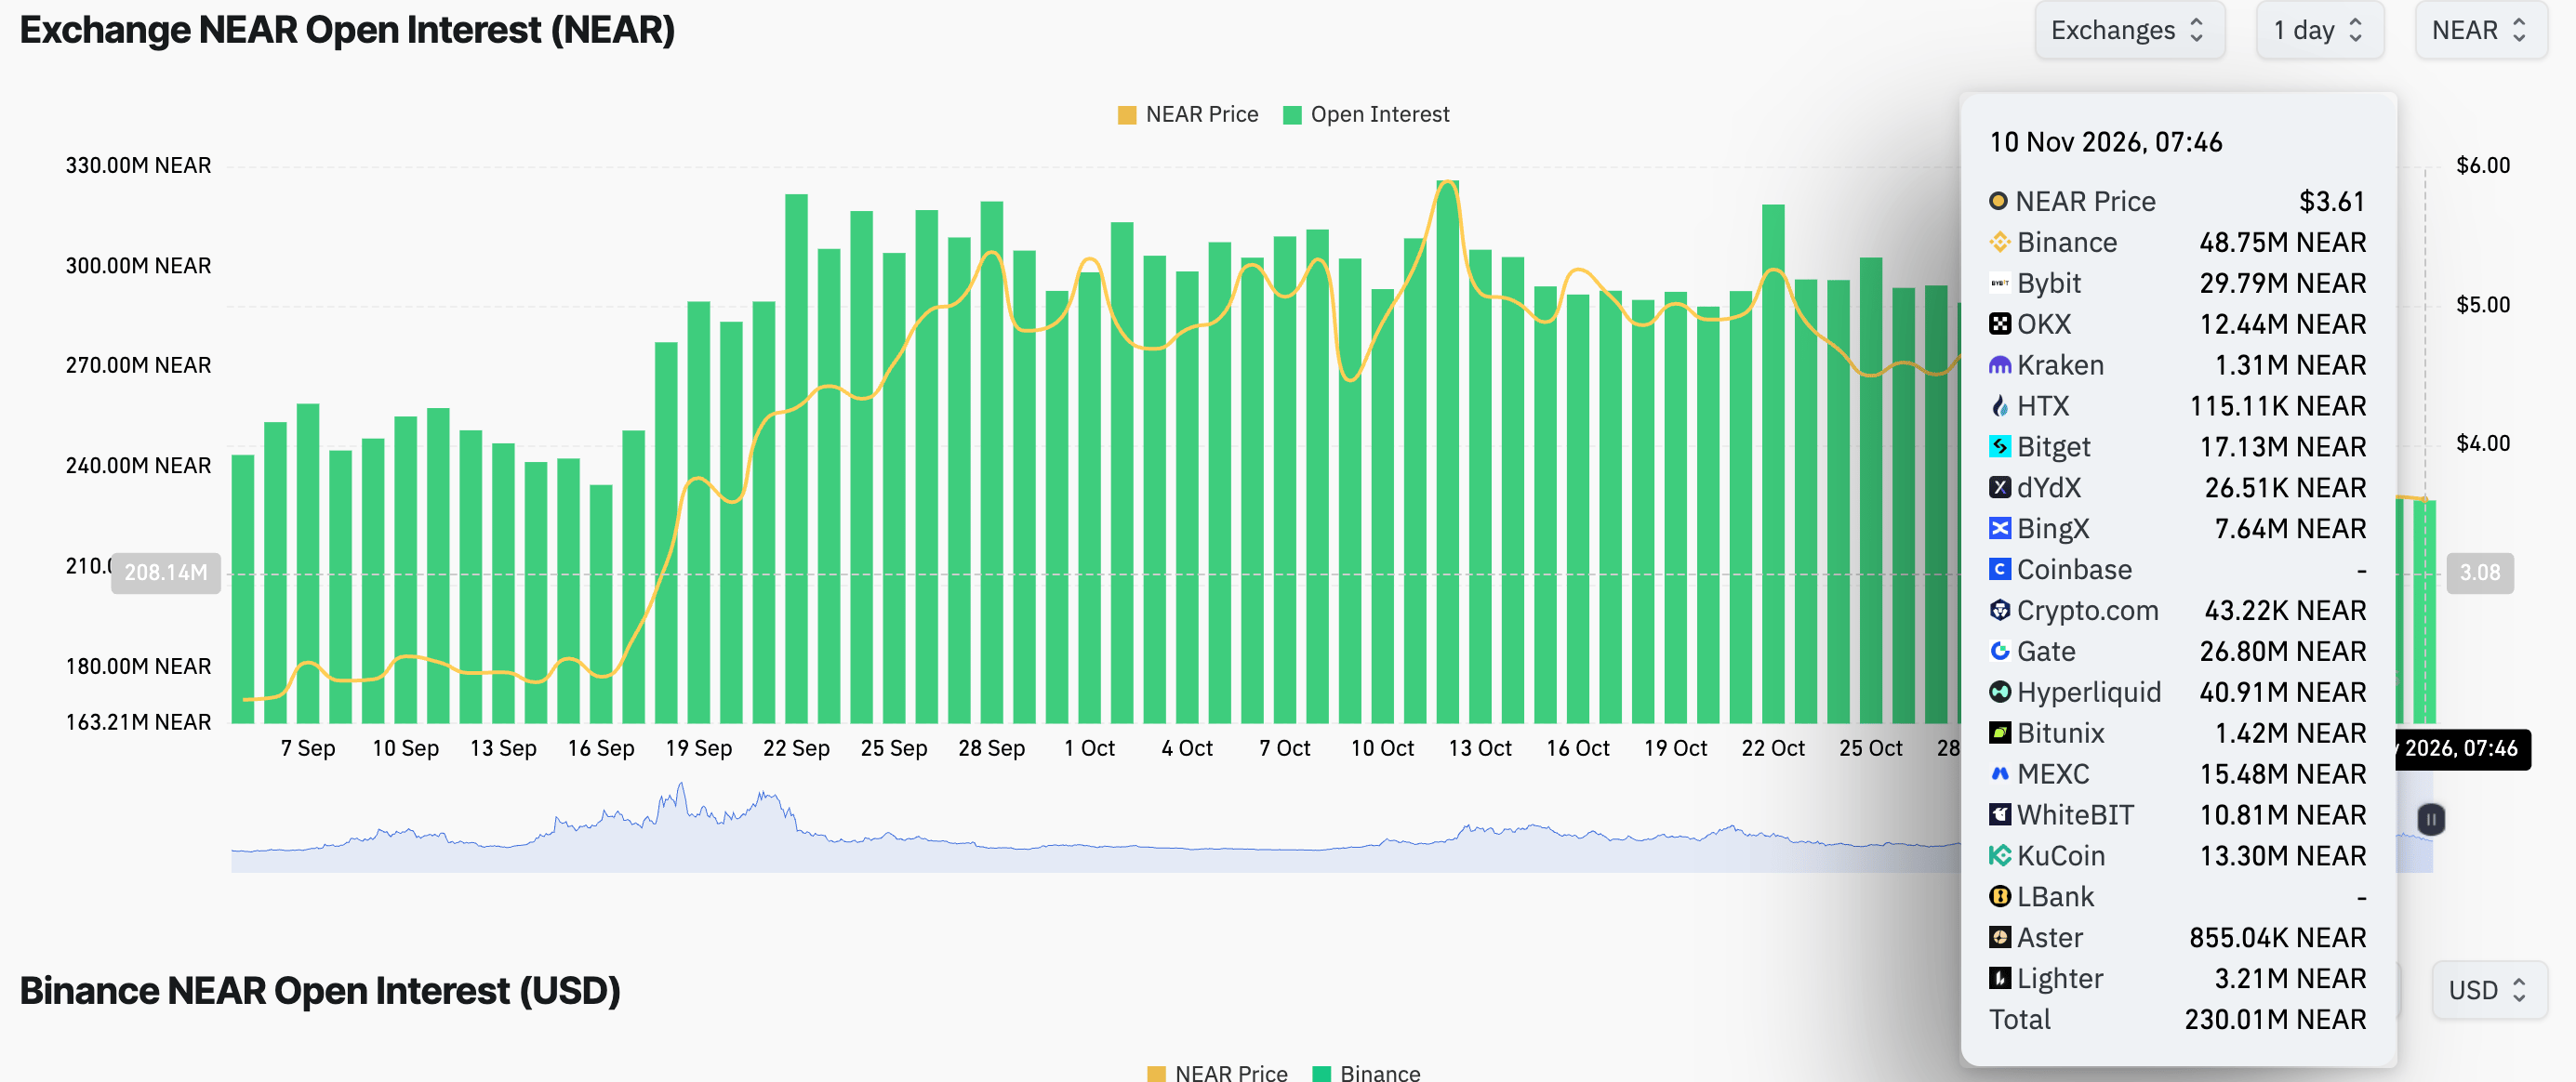
A comparable weakening in demand can be seen among retail investors. At 230 million NEAR on Tuesday, NEAR Open Interest (OI) has fallen from 318 million NEAR on 22 October, CoinGlass data shows. The decline indicates a lower notional value of active contracts and points to risk aversion, consistent with increasing net outflows from the futures market.
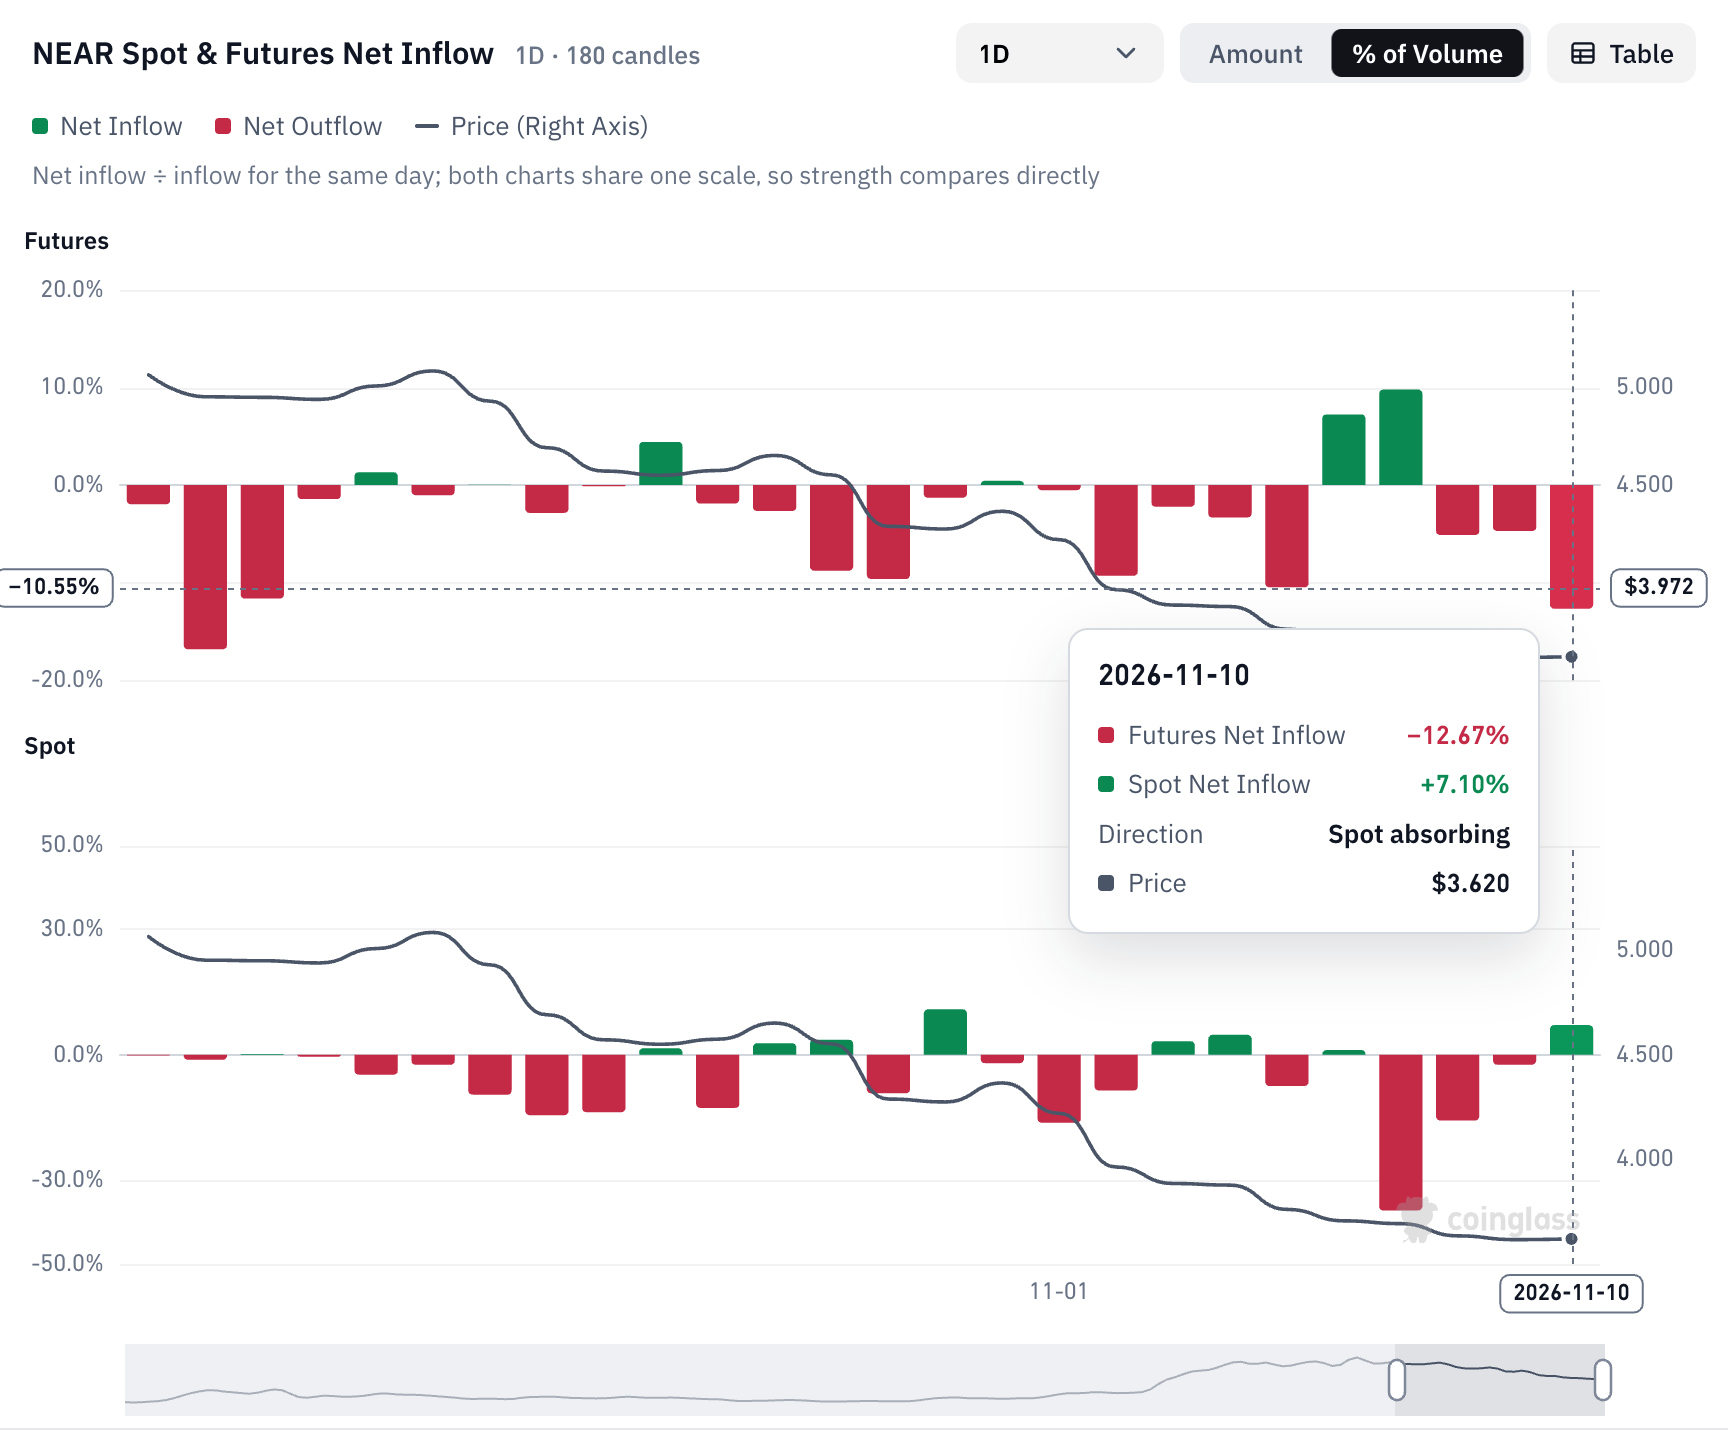
While outflows from NEAR futures represented 17% of daily volume, the spot market absorbed the supply, recording inflows equivalent to nearly 10% of daily volume.
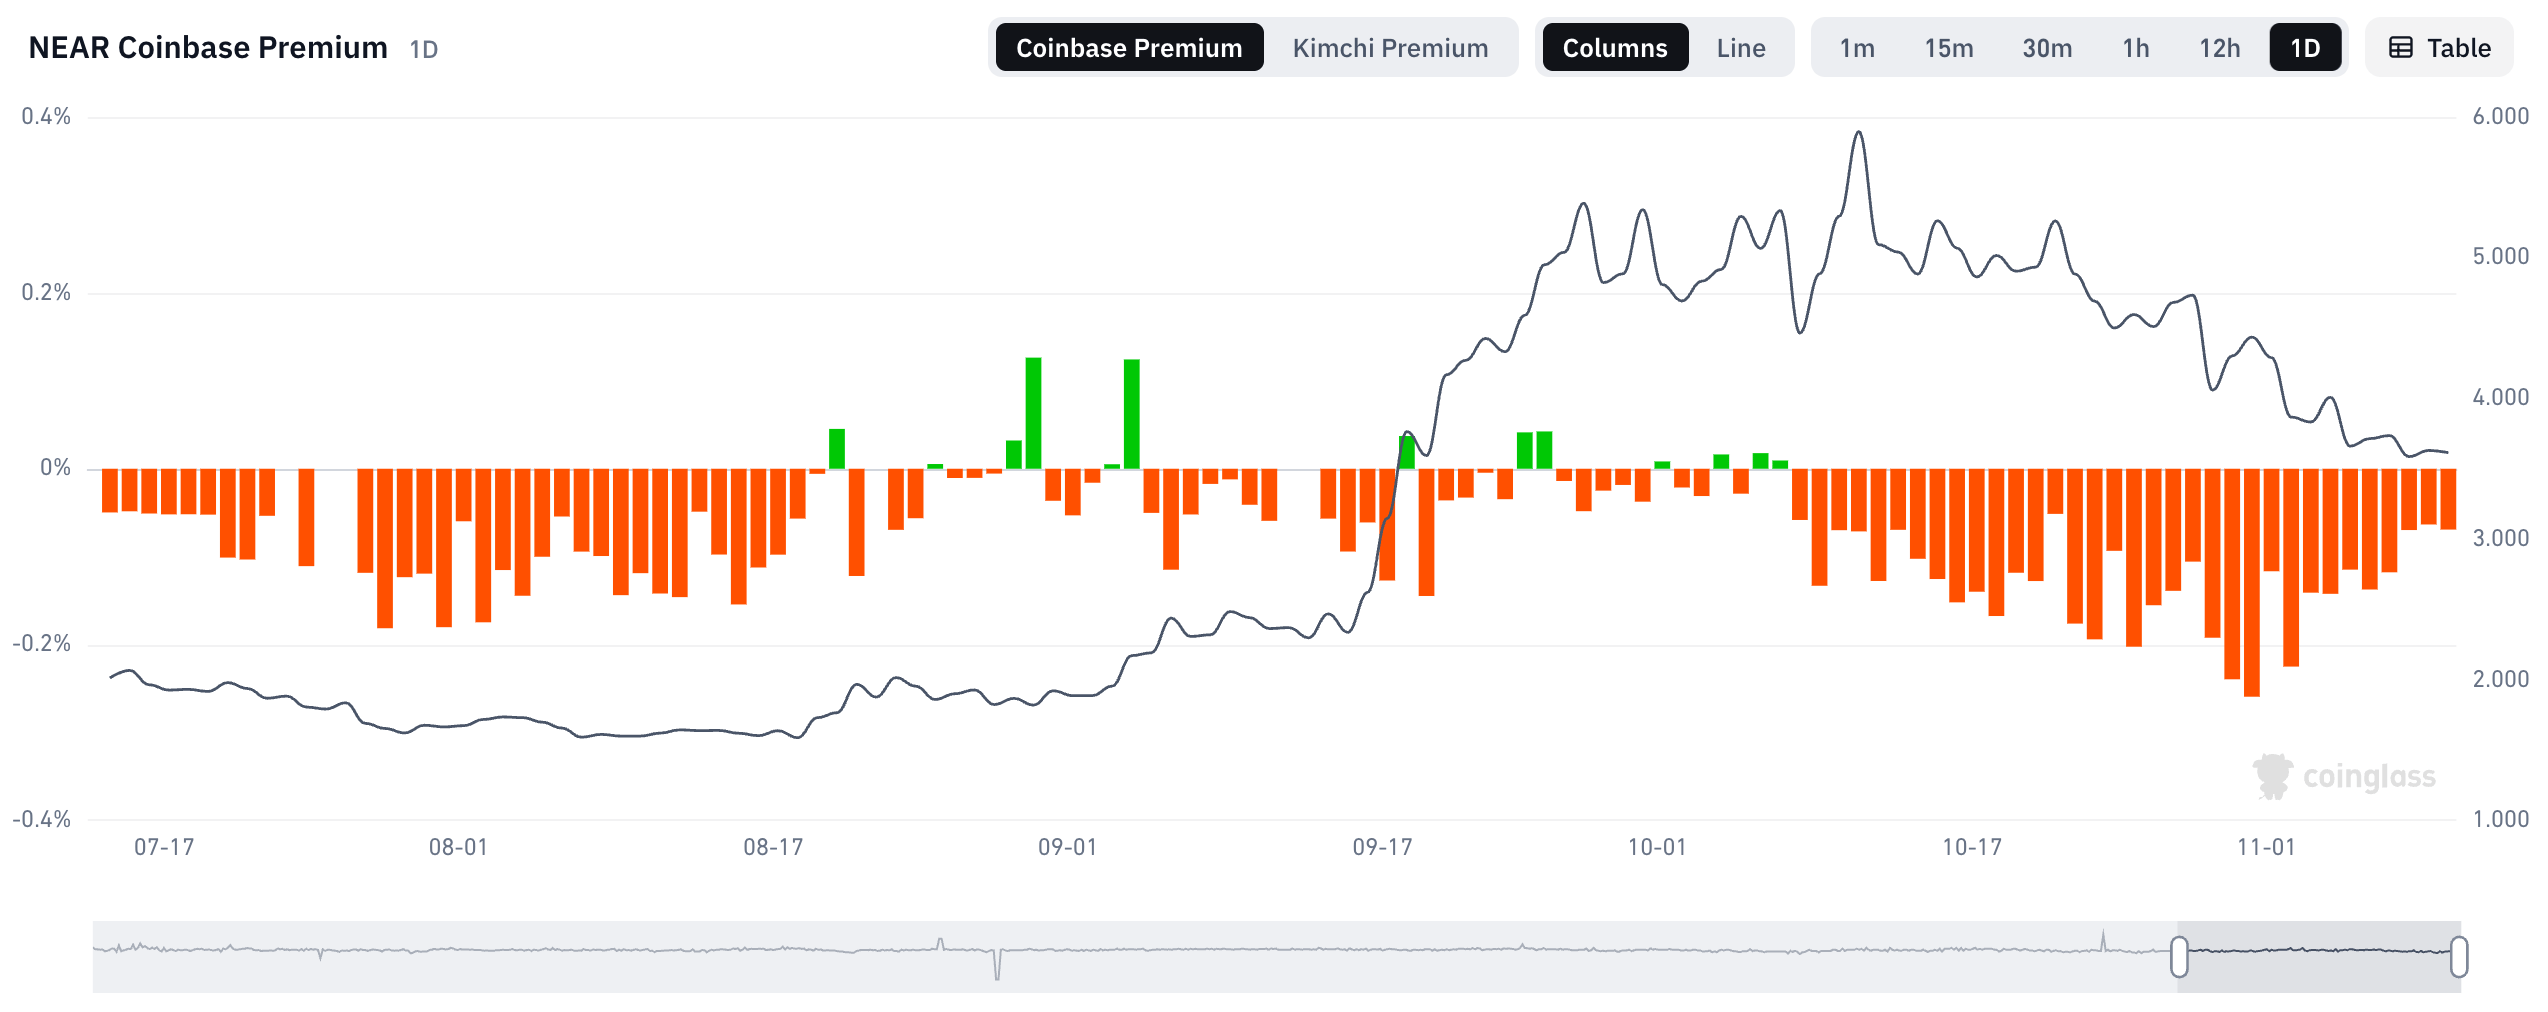
US demand for the NEAR token is also subdued. A negative Coinbase premium of -0.097% means the token trades at a discount on the exchange, suggesting limited interest among US investors. Those watching for a recovery may view a positive spike in the Coinbase premium as a possible signal of a bullish trend reversal. Such a move was previously seen on 4 September, followed by several smaller spikes in late September.
At $3.6130 at the time of writing on Tuesday, NEAR Protocol retains a bearish short-term bias. The four-hour chart reinforces the downtrend, with the token trading beneath both the 50-period Exponential Moving Average (EMA) at $3.8332 and the 200-period EMA at $4.2614.
A falling wedge defines NEAR’s technical structure, bounded by a descending trendline at $3.7981 and a support trendline near $3.4000. Horizontal support around $3.4030 provides an immediate floor, reinforcing the lower trendline. Should a break beneath this zone be confirmed, the token would be vulnerable to a deeper correction, with subsequent support at $2.9780 and $2.7280.
The momentum picture is mixed. Modest downward momentum is suggested by both the Moving Average Convergence Divergence (MACD) line remaining below and the Relative Strength Index (RSI) sitting close to 43.
On the upside, the first resistance lies around $3.7981, where the price would break the descending trendline, with the 50-EMA at $3.8332 just above it. The next hurdle is the horizontal level at $3.9160, followed by the 200-EMA near $4.2614.
(The technical analysis of this story was written with the help of an AI tool. Know more.)







Phone: +61 2 8036 8388
Fax: +61 2 8036 8388
Email: support@tmgm.com



The information provided on this website is of a general nature only and does not constitute personal financial advice. Before acting on any information on this website, you should consider the suitability of the information in relation to your objectives, financial situation and needs. Investing in CFDs and FX Margin Contracts carries significant risks and is not suitable for all investors. You may lose more than your initial deposit. You do not own, or have, any interest in the underlying asset. We recommend that you seek independent advice and ensure you fully understand the risks involved before trading. It is important that you read and consider the disclosure document before you acquire any product listed on the website. The information and advertisements offered on this website are not intended for use by any person in any country or jurisdiction where such use would be contrary to local laws and regulations. The Products and Services offered on this website are not intended for residents of the United States, Malaysia and Thailand.
TMGM is authorized and regulated in various jurisdictions.
Trademax Australia Limited, trading as TMGM, is regulated by the Australian Securities and Investments Commission (ASIC), AFSL no. 436416 and is located at Level 28, One International Tower, 100 Barangaroo Avenue, 2000 Sydney, NSW Australia.
Email: support@tmgm.com.au
Trademax Global Limited, trading as TMGM, is authorized and regulated by the Vanuatu Financial Services Commission (VFSC), registration number 40356 and registered at 1276, Kumul Highway, Port Vila, Vanuatu, Republic of Vanuatu.
Email: support@tmgm.com
Trademax Global Markets (SE) Limited, trading as TMGM, is authorized and regulated by the Financial Services Authority (FSA) of Seychelles, with license number SD224. The company is registered at Office No 13, Providence Estate ABIS Centre, Mahe, Seychelles.
Email: support@tmgm.com
Trademax Global Markets (International) Pty Ltd, trading as TMGM, is authorized and regulated by the Financial Services Commission, Mauritius (FSC) with license no. GB22201012, and registered at 33, Edith Cavell Street C/o IQ EQ Fund Services (Mauritius) Ltd Port Louis, 11324 Mauritius.
Email: support@tmgm.com
Copyright © TMGM. All rights reserved


