
News & AnalysisCareer

Below $1.093 for Ripple (XRP) and near $0.146 for Stellar (XLM), Tuesday’s prices reflect continued pressure as sellers retain the upper hand on momentum. Deteriorating on-chain and derivatives metrics also point to the risk of a more pronounced correction in both XRP and XLM over the coming days.

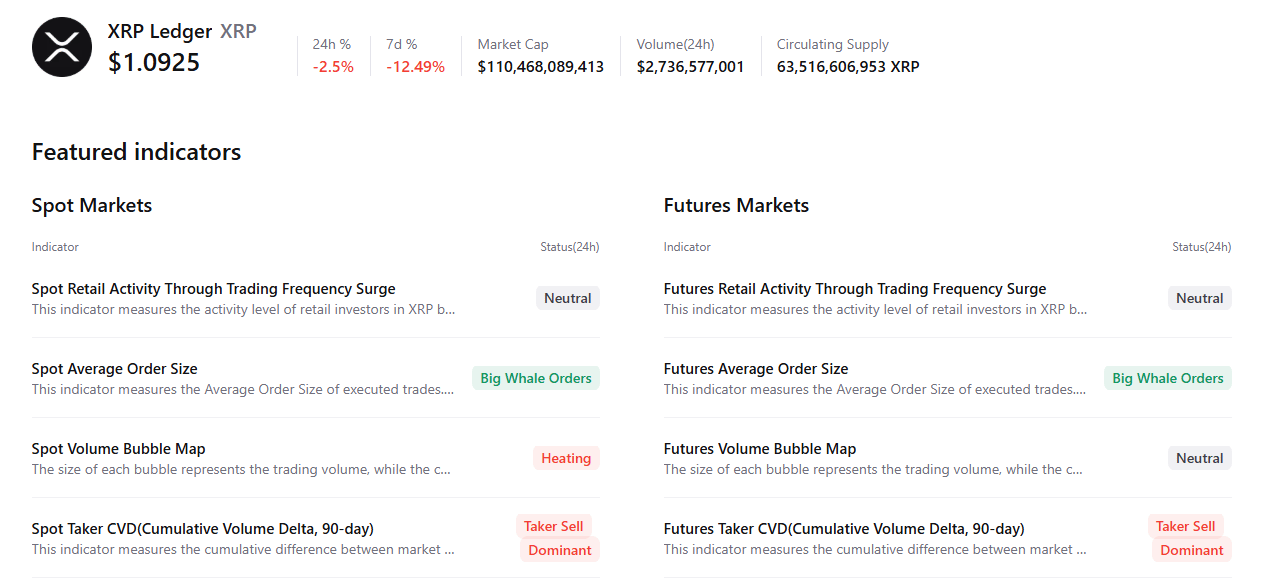
A bearish picture for both altcoins emerges from CryptoQuant’s summary data. Large whale orders and a predominance of selling characterise XRP’s spot and futures markets. Conditions in the spot market are also heating up, underscoring the cautious, bearish bias among Ripple traders.
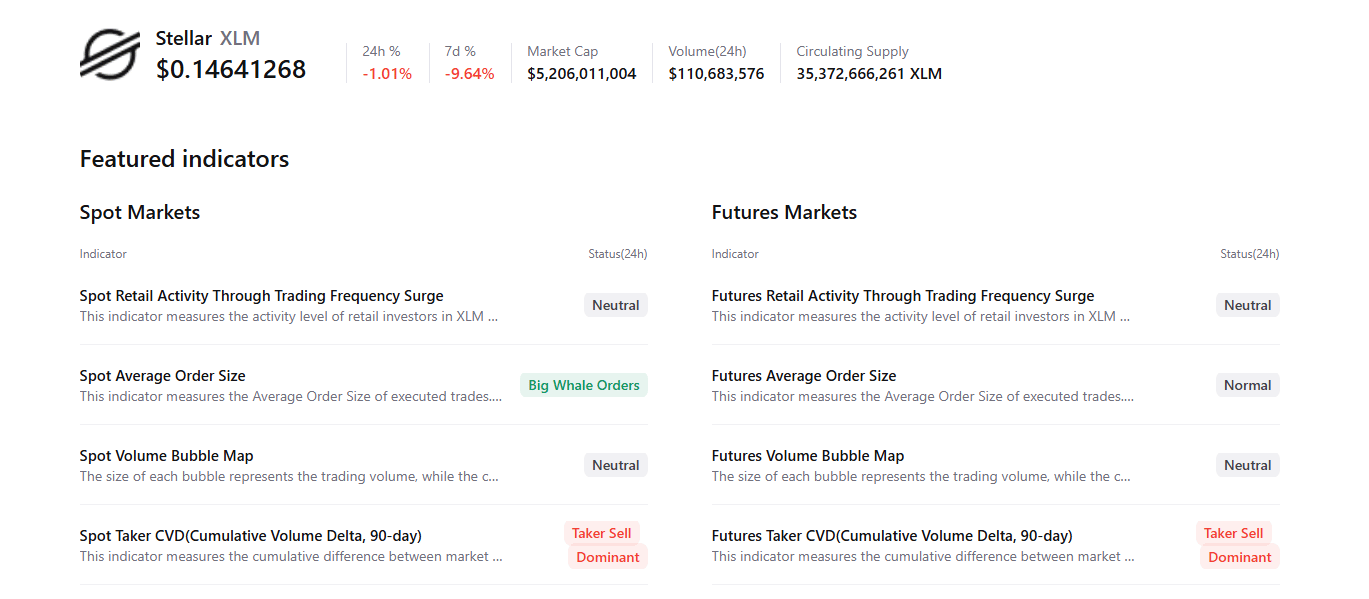
Selling likewise dominates XLM’s spot and futures markets, pointing to a pessimistic view among Stellar traders.
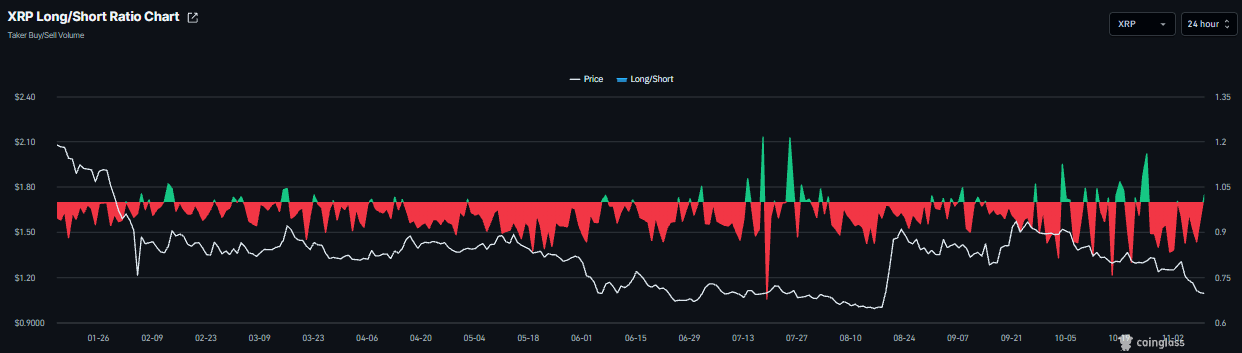
The signals from derivatives metrics, however, are mixed. On Tuesday, CoinGlass’ XRP long-to-short ratio moved into positive territory at 1.02, pointing to a mildly bullish outlook.
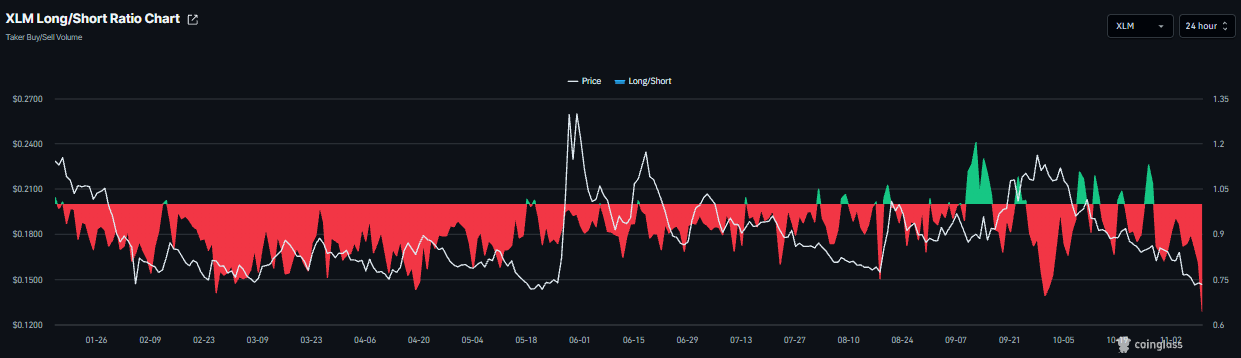
By contrast, Tuesday’s reading of 0.64 left XLM’s long-to-short ratio in negative territory and at its lowest in over a month. When the ratio is below one, it signals bearish sentiment, with traders positioning for a fall in asset prices.
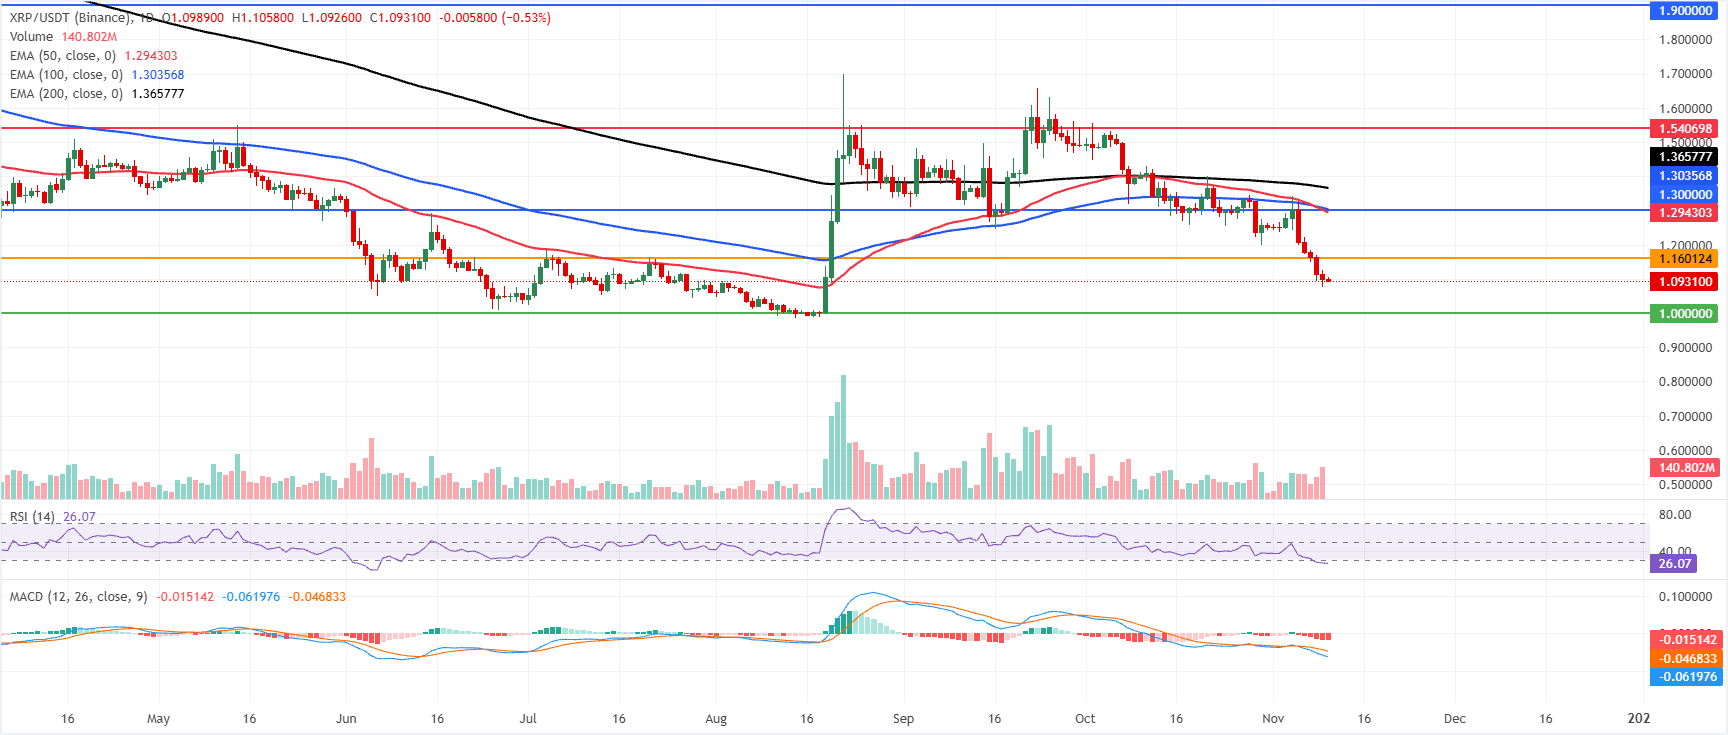
At $1.093 on Tuesday, XRP remains in a bearish phase. The price sits well beneath the 50-day, 100-day and 200-day Exponential Moving Averages (EMAs), which are grouped between approximately $1.290 and $1.370.
A Relative Strength Index (RSI) reading near 26 places XRP firmly in oversold territory, while the Moving Average Convergence Divergence (MACD) stays negative. Together, these indicators point to selling pressure retaining the upper hand, although stretched conditions mean short-term rebounds cannot be excluded.
Any recovery would first encounter resistance at $1.160. Beyond that lies a concentrated resistance zone, where the 50-day EMA at $1.294 meets the horizontal barrier at $1.300 and the 100-day EMA at $1.303. The longer-term 200-day EMA at $1.365 adds weight to the broader bearish pattern, ahead of additional obstacles at $1.540 and $1.900.
Should the prevailing downtrend continue, the next significant support is the psychological $1.000 zone, where buyers may try to stem the fall.
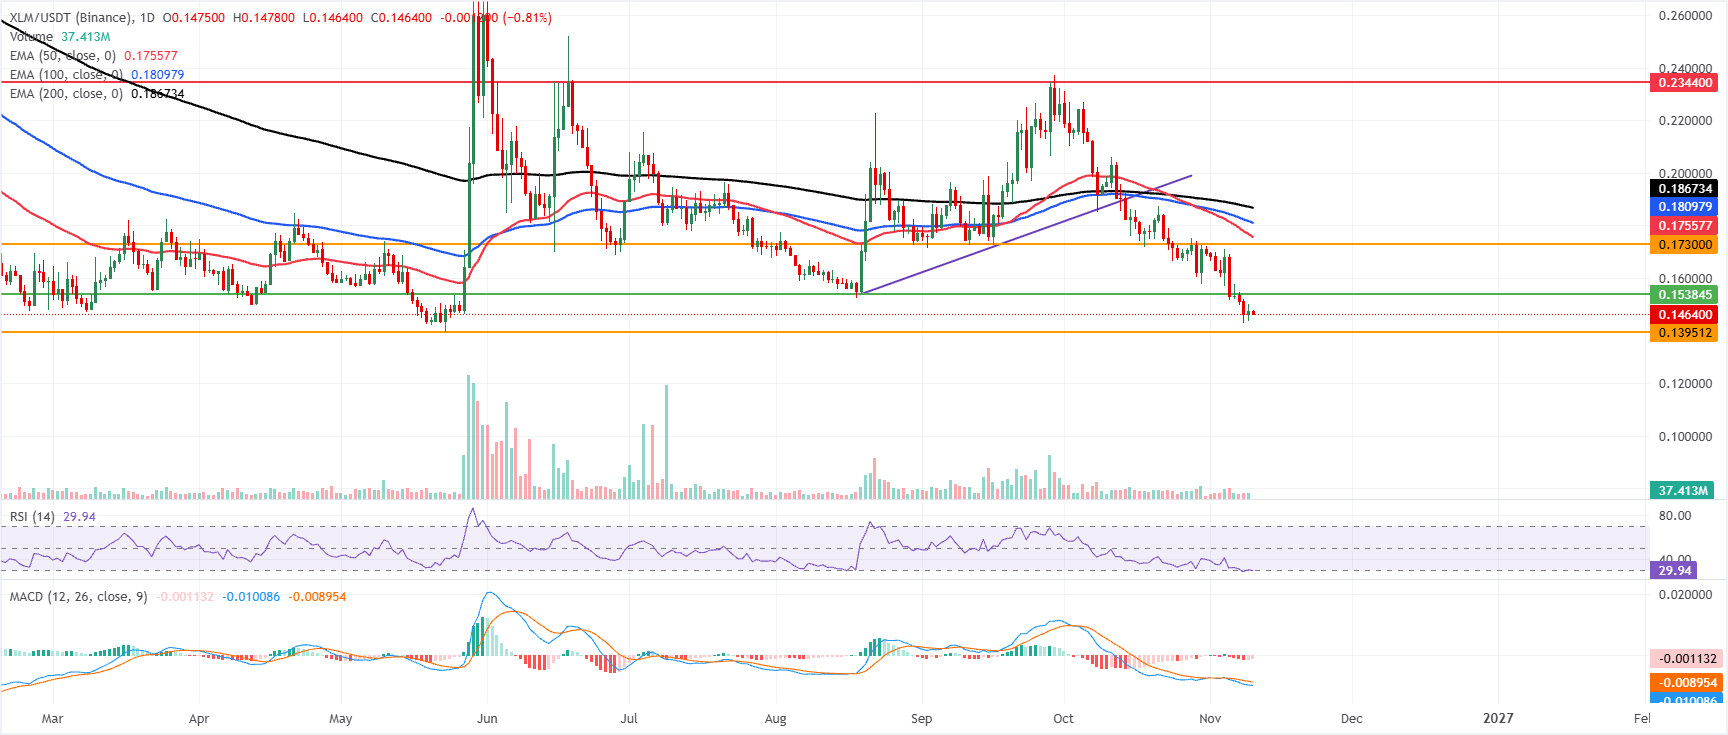
Trading at $0.146 on Tuesday, XLM retains a bearish short-term bias. Following a prolonged retreat from the $0.190 region, the price remains below the 50-day, 100-day and 200-day EMAs, grouped between approximately $0.175 and $0.186, reinforcing the overhead resistance structure.
With the RSI close to 30, conditions appear oversold. Nevertheless, the negative MACD indicates that downward momentum continues, even though selling pressure may be starting to fade.
A rebound would initially face the previous horizontal resistance near $0.153, followed by $0.173, with the 50-day EMA at $0.175 providing a nearby technical ceiling. Further up, a more concentrated supply zone is formed by the 100-day EMA at $0.180 and the 200-day EMA near $0.186. Beyond this zone, the next significant resistance is the higher horizontal level around $0.234.
The horizontal floor near $0.139 provides immediate support. A daily close beneath it would leave the pair vulnerable to a deeper pullback, notwithstanding the already stretched momentum conditions.
(The technical analysis of this story was written with the help of an AI tool. Find out more.)







Phone: +61 2 8036 8388
Fax: +61 2 8036 8388
Email: support@tmgm.com



The information provided on this website is of a general nature only and does not constitute personal financial advice. Before acting on any information on this website, you should consider the suitability of the information in relation to your objectives, financial situation and needs. Investing in CFDs and FX Margin Contracts carries significant risks and is not suitable for all investors. You may lose more than your initial deposit. You do not own, or have, any interest in the underlying asset. We recommend that you seek independent advice and ensure you fully understand the risks involved before trading. It is important that you read and consider the disclosure document before you acquire any product listed on the website. The information and advertisements offered on this website are not intended for use by any person in any country or jurisdiction where such use would be contrary to local laws and regulations. The Products and Services offered on this website are not intended for residents of the United States, Malaysia and Thailand.
TMGM is authorized and regulated in various jurisdictions.
Trademax Australia Limited, trading as TMGM, is regulated by the Australian Securities and Investments Commission (ASIC), AFSL no. 436416 and is located at Level 28, One International Tower, 100 Barangaroo Avenue, 2000 Sydney, NSW Australia.
Email: support@tmgm.com.au
Trademax Global Limited, trading as TMGM, is authorized and regulated by the Vanuatu Financial Services Commission (VFSC), registration number 40356 and registered at 1276, Kumul Highway, Port Vila, Vanuatu, Republic of Vanuatu.
Email: support@tmgm.com
Trademax Global Markets (SE) Limited, trading as TMGM, is authorized and regulated by the Financial Services Authority (FSA) of Seychelles, with license number SD224. The company is registered at Office No 13, Providence Estate ABIS Centre, Mahe, Seychelles.
Email: support@tmgm.com
Trademax Global Markets (International) Pty Ltd, trading as TMGM, is authorized and regulated by the Financial Services Commission, Mauritius (FSC) with license no. GB22201012, and registered at 33, Edith Cavell Street C/o IQ EQ Fund Services (Mauritius) Ltd Port Louis, 11324 Mauritius.
Email: support@tmgm.com
Copyright © TMGM. All rights reserved


