
News & AnalysisCareer

A narrow range between the psychological $0.94 level and $0.98 resistance largely contains Ripple (XRP) on Tuesday, with the token trading just above $0.95. Following the recent retreat below $1.00, further losses remain the path of least resistance. Weak technical levels, capital leaving associated products such as spot exchange-traded funds (ETFs), and a sharp increase in whale withdrawals continue to weigh on the outlook.

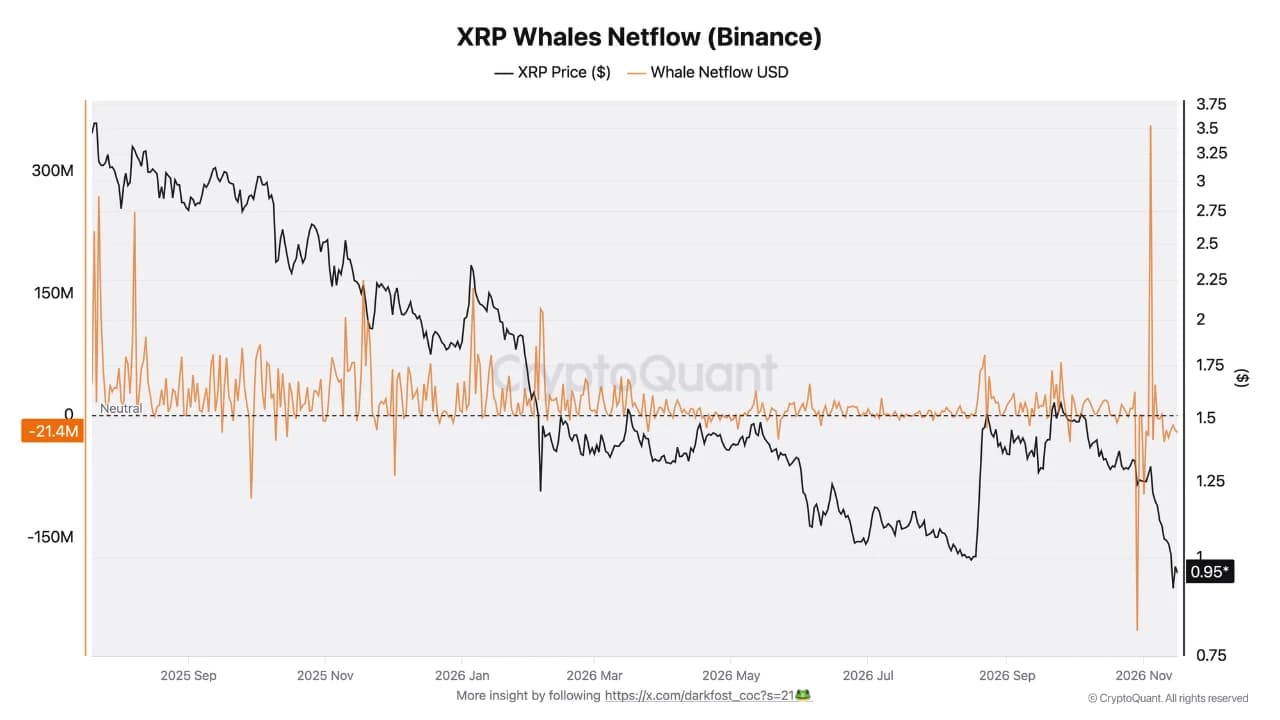
About $21 million worth of XRP was withdrawn by large investors on Monday, according to CryptoQuant’s on-chain analyst, Darkfost. Daily net outflows over the past week ranged from $12 million to $33 million. The jump in withdrawals from Binance, the largest cryptocurrency exchange, appeared to suggest that XRP’s fall below $1.00 had pushed whales to the edge.
Since 10 November, net whale withdrawals from Binance have reached about $127 million, pointing to a marked change in investor behaviour. That contrasts with August’s XRP rally, when inflows were prominent and daily deposits averaged $75 million.
Roughly $19 million left spot ETFs in the week ending 13 November, leaving the bearish picture across key investment products unchanged.
Darkfost stated: “This dominance of withdrawals could therefore reflect a growing willingness among whales to accumulate and hold XRP for the longer term, a potentially very positive development for establishing a stronger price floor just below the $1.00 mark,”
The analyst nevertheless cautions traders against excessive expectations, noting that internal transfers at Binance could account for some withdrawals. This interpretation refers back to the $6.3 billion Binance hack, after which the exchange had to replenish its reserves.
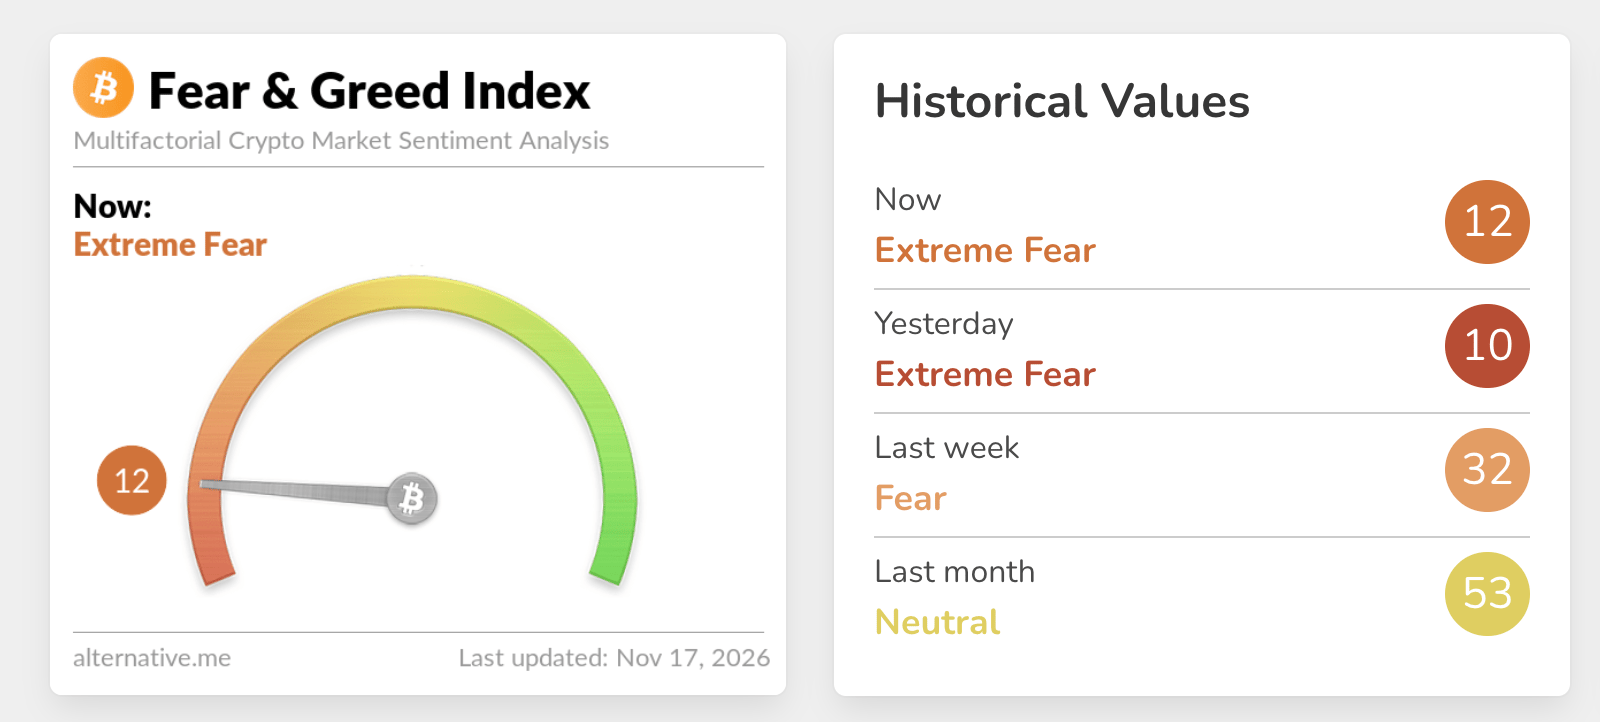
At 12 on Tuesday, the Fear & Greed Index remains in Fear territory following a substantial decline, recovering only slightly from the previous day’s reading of 10. With risk appetite still subdued, a sustained recovery could prove difficult over the short to medium term.
Trading above $0.95, XRP remains in a slide well beneath its main exponential moving averages (EMAs), leaving the near-term bias clearly bearish. Far above the current price, the 50-day, 100-day and 200-day EMAs cluster between $1.22 and $1.33, indicating continued heavy pressure on the broader trend. The SuperTrend line at $1.13 adds to the evidence that earlier breakdown levels are still limiting the market’s upside.
An oversold Relative Strength Index (RSI) reading of 26 and a negative Moving Average Convergence Divergence (MACD) underline the lack of momentum. Although a corrective rebound is possible, these signals suggest that selling pressure remains dominant.
Around $1.13, the SuperTrend barrier provides the first resistance, with the 50-day EMA at $1.22 next in line. Beyond that, a stronger rebound would encounter a more substantial obstacle near $1.24, where the previous trendline broke, before reaching the 100-day EMA at $1.26. Further up, the 200-day EMA at $1.33 remains a broader bearish pivot; a move back above it would be needed to alleviate the prevailing downtrend.
The daily chart shows no clear structural support beneath the current price. Short-term traders may therefore monitor intraday responses around these higher levels for indications of whether XRP can establish a base or remains exposed to further declines.
(The technical analysis of this story was written with the help of an AI tool. Know more.)
For each cryptocurrency, its developer or creator sets the total number of tokens that may be minted or issued. The underlying blockchain’s algorithm determines how many of these assets can be minted through mining, staking or other mechanisms. Circulating supply can also fall, whether through token burning or assets being sent by mistake to addresses on incompatible blockchains.
Multiplying an asset’s circulating supply by its current market value gives its market capitalisation.
Over a defined trading period, such as 24 hours, trading volume measures the total number of tokens of a particular asset exchanged between buyers and sellers. Combining activity across centralised and decentralised exchanges, this metric helps assess market sentiment. Rising volume often indicates demand for an asset, as more participants buy and sell the cryptocurrency.
To encourage traders to take positions and keep perpetual contract prices aligned with spot markets, exchanges use funding rates. Through regular periodic payments, this mechanism is intended to bring futures prices and index prices into line. A positive funding rate means the perpetual contract trades above the mark price, so bullish traders holding long positions pay those holding short positions. Conversely, when the funding rate is negative, perpetual prices sit below the mark price and traders with short positions pay those with long positions.







Phone: +61 2 8036 8388
Fax: +61 2 8036 8388
Email: support@tmgm.com



The information provided on this website is of a general nature only and does not constitute personal financial advice. Before acting on any information on this website, you should consider the suitability of the information in relation to your objectives, financial situation and needs. Investing in CFDs and FX Margin Contracts carries significant risks and is not suitable for all investors. You may lose more than your initial deposit. You do not own, or have, any interest in the underlying asset. We recommend that you seek independent advice and ensure you fully understand the risks involved before trading. It is important that you read and consider the disclosure document before you acquire any product listed on the website. The information and advertisements offered on this website are not intended for use by any person in any country or jurisdiction where such use would be contrary to local laws and regulations. The Products and Services offered on this website are not intended for residents of the United States, Malaysia and Thailand.
TMGM is authorized and regulated in various jurisdictions.
Trademax Australia Limited, trading as TMGM, is regulated by the Australian Securities and Investments Commission (ASIC), AFSL no. 436416 and is located at Level 28, One International Tower, 100 Barangaroo Avenue, 2000 Sydney, NSW Australia.
Email: support@tmgm.com.au
Trademax Global Limited, trading as TMGM, is authorized and regulated by the Vanuatu Financial Services Commission (VFSC), registration number 40356 and registered at 1276, Kumul Highway, Port Vila, Vanuatu, Republic of Vanuatu.
Email: support@tmgm.com
Trademax Global Markets (SE) Limited, trading as TMGM, is authorized and regulated by the Financial Services Authority (FSA) of Seychelles, with license number SD224. The company is registered at Office No 13, Providence Estate ABIS Centre, Mahe, Seychelles.
Email: support@tmgm.com
Trademax Global Markets (International) Pty Ltd, trading as TMGM, is authorized and regulated by the Financial Services Commission, Mauritius (FSC) with license no. GB22201012, and registered at 33, Edith Cavell Street C/o IQ EQ Fund Services (Mauritius) Ltd Port Louis, 11324 Mauritius.
Email: support@tmgm.com
Copyright © TMGM. All rights reserved


