
News & AnalysisCareer

Inflation concerns and the resignation of Nvidia CEO Jensen Huang continue to fuel volatility across broader markets. Against this backdrop, persistent selling leaves leading altcoins Ripple (XRP), Cardano (ADA) and Solana (SOL) exposed to further declines.
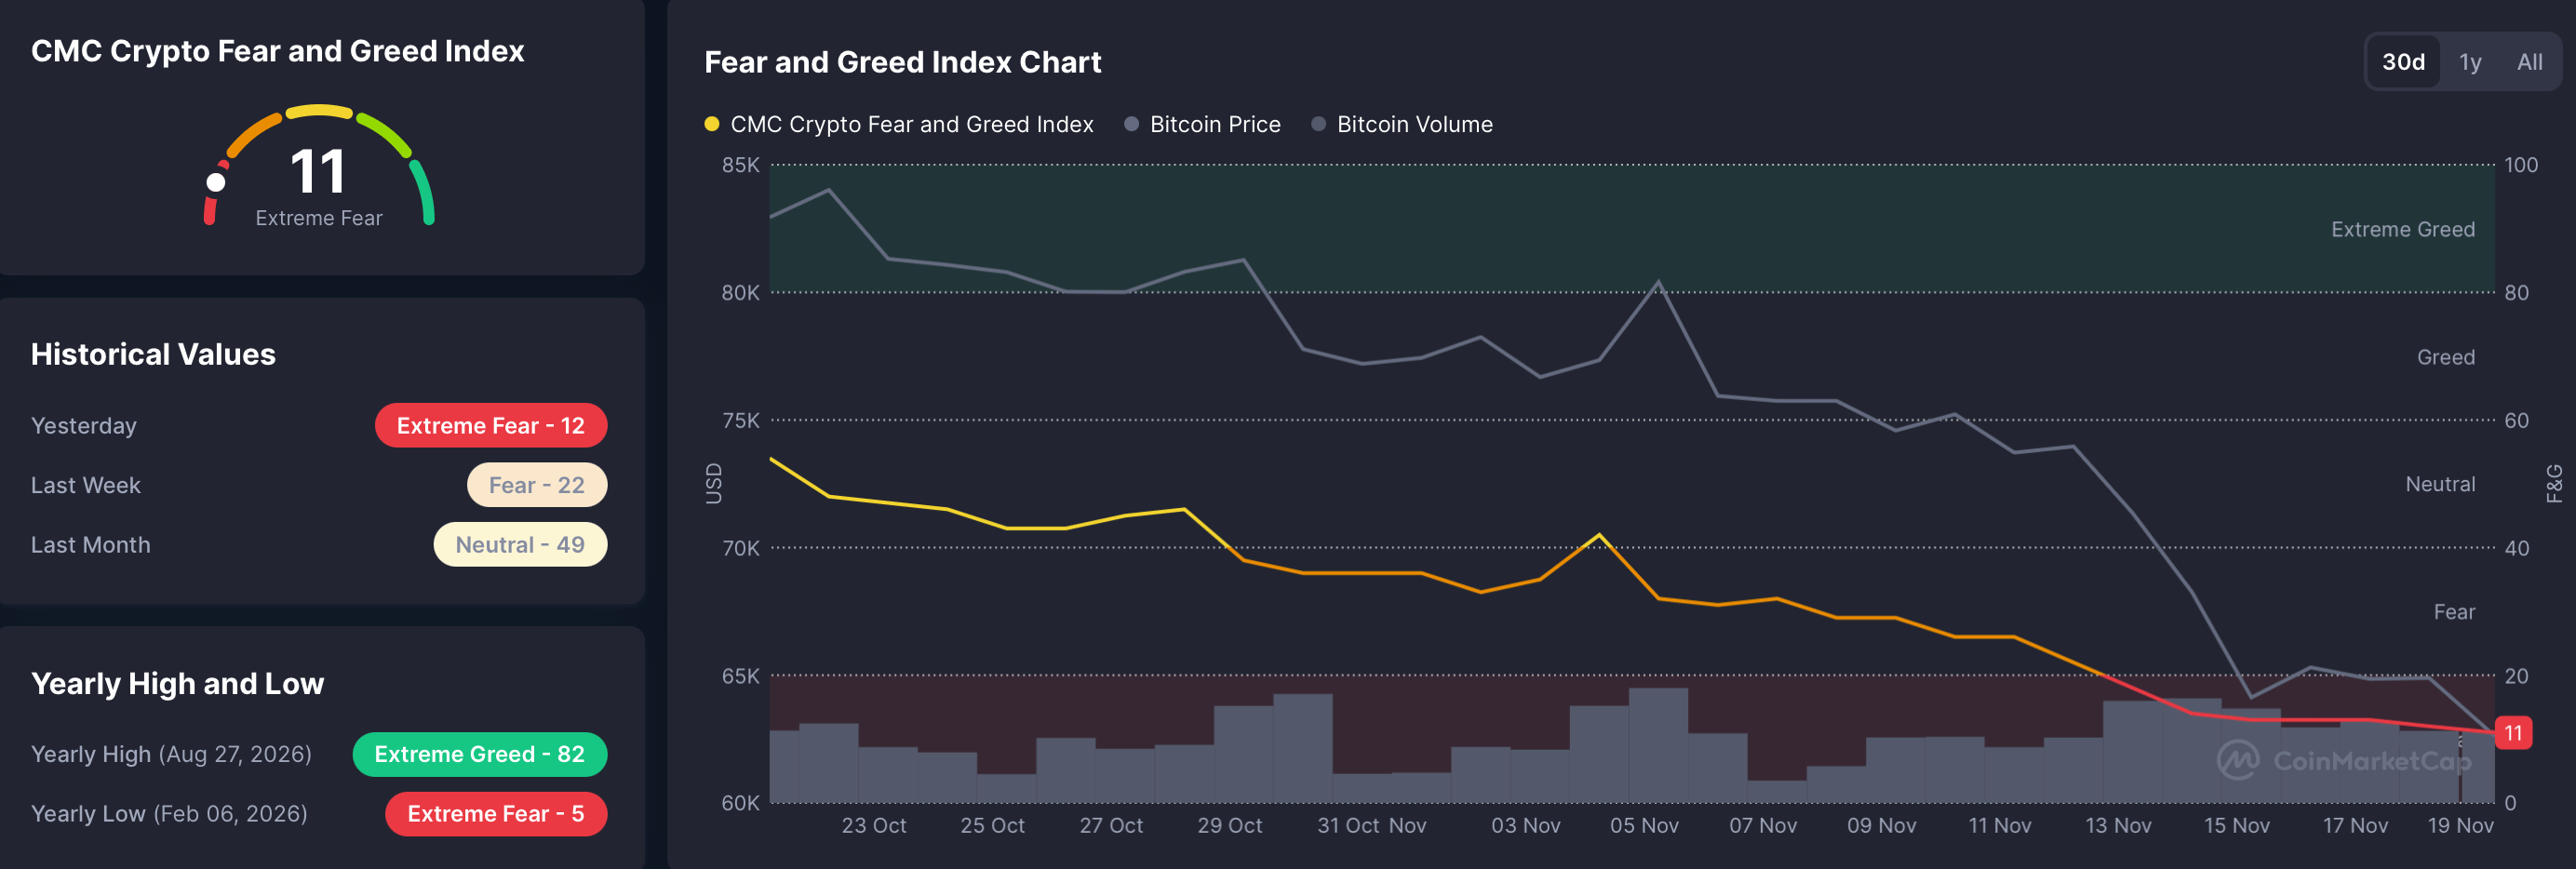
At 11 on Thursday, CoinMarketCap’s Fear and Greed Index is at its lowest in four months, pointing to pronounced risk aversion across the market. Meanwhile, October’s Fed meeting minutes, released on Wednesday, strengthen the likelihood of a December rate rise, as FXStreet previously reported.
With downward momentum still prevailing, the technical picture for XRP, ADA and SOL remains persistently bearish.
At $0.9687 at the time of writing on Thursday, Ripple remains well beneath its 50- and 200-day Exponential Moving Averages (EMAs), at $1.1992 and $1.3204 respectively, reinforcing the bearish short-term outlook. The broken downward trendline resistance near $1.2279 also remains above XRP, continuing to constrain the broader technical structure.
While the Moving Average Convergence Divergence (MACD) line holds below zero, the Relative Strength Index (RSI) is close to 30. These readings suggest oversold conditions, but do not yet point to a decisive recovery.
Any advance would first encounter resistance at $0.9862, with a stronger obstacle at $1.0692. Further up, a concentrated supply zone spans the 50-day EMA at $1.1992 and trendline resistance near $1.2279, forming a distant structural ceiling.
The next substantial downside support lies at $0.8930. A sustained breach of that level would leave the pair vulnerable to fresh selling, even with momentum becoming increasingly stretched.
The steady slide seen over the past six weeks continues, with Cardano at $0.1510 at the time of writing on Thursday. Trading well beneath the 50-day EMA at $0.1929 and the 200-day EMA at $0.2239, ADA continues to retreat, indicating that the wider downtrend remains intact.
An RSI reading of 27 places ADA in oversold territory, while the MACD line remains negative. Together, these weak momentum signals point to continued selling pressure, although the short-term decline may be stretched.
Any recovery would initially meet resistance around $0.1929 at the 50-day EMA. The next, more substantial hurdle is the 200-day EMA near $0.2239, where a rebound would be likely to falter.
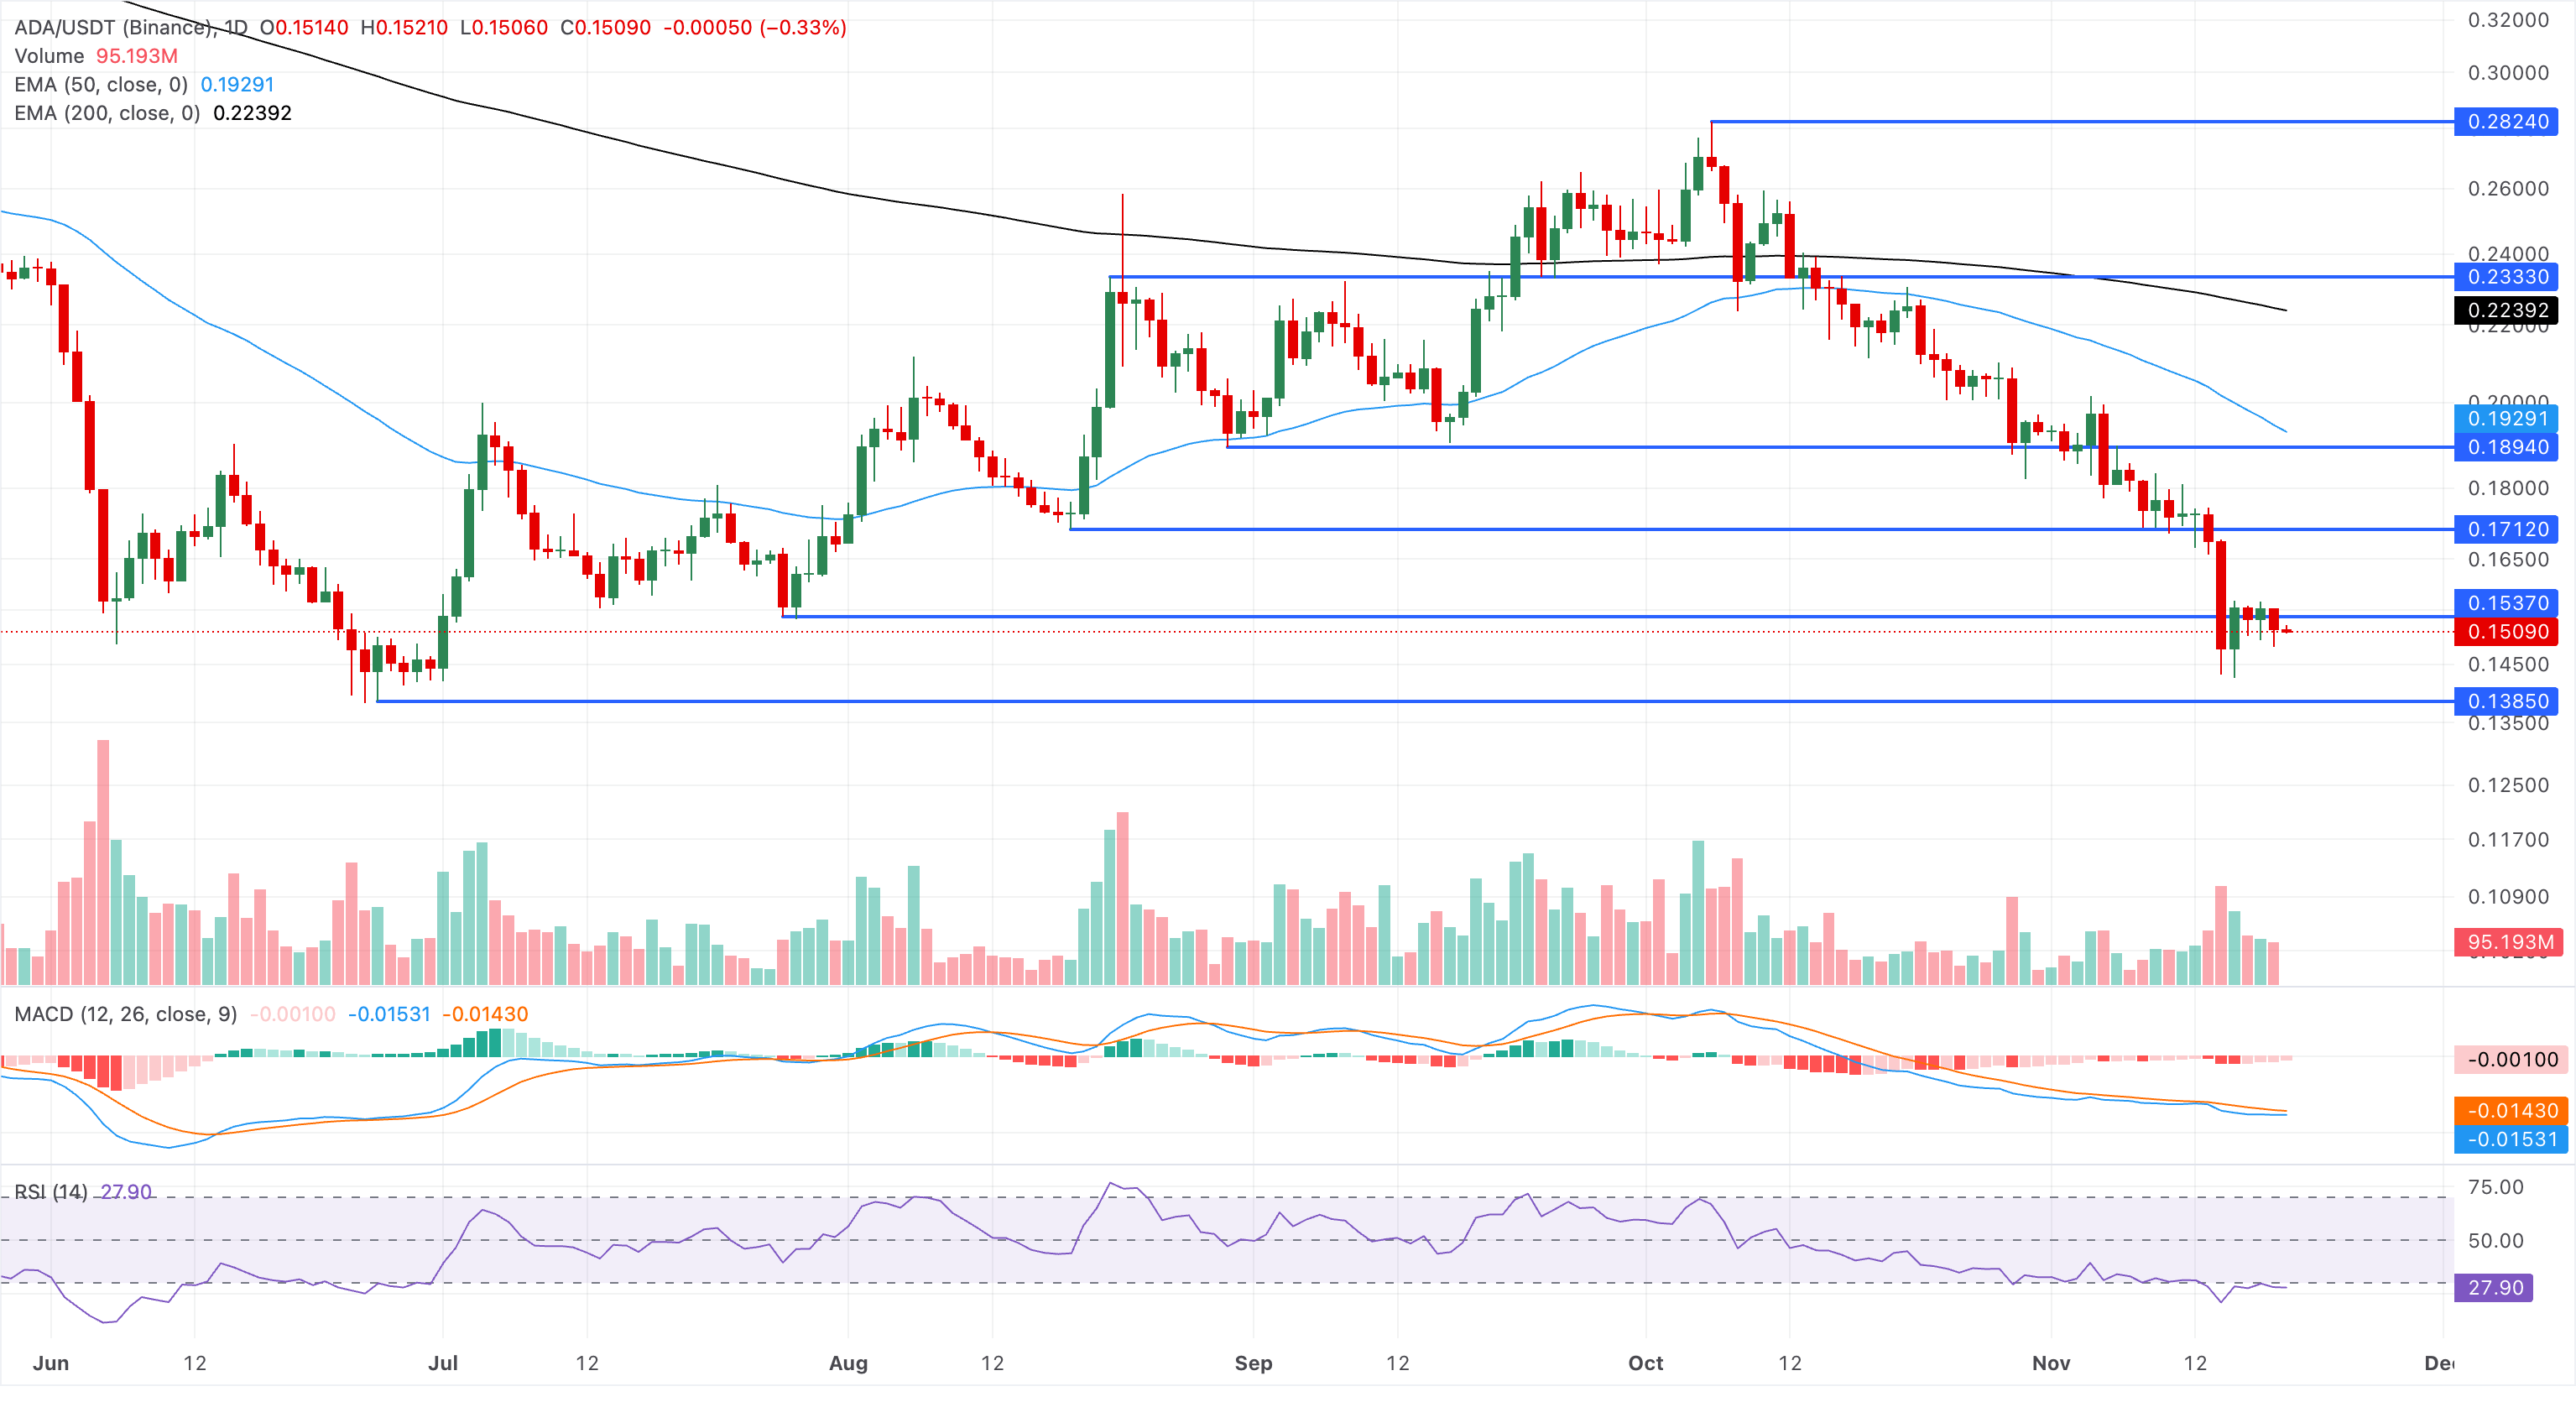
Further down, buyers could find a more durable base from which to arrest the decline at $0.1385, the support level established by the 26 June low.
Following the previous day’s 2% fall, Solana has slipped to $73.32 at the time of writing on Thursday. With SOL trading well beneath its 50-day EMA at $92.28 and 200-day EMA at $96.76, the short-term outlook remains bearish.
Although an RSI of 27 signals deeply oversold conditions, downward momentum remains strong. The MACD reading is still negative but continues to recover, suggesting that selling pressure is easing.
A recovery would face its first resistance at $77.60 and a more substantial hurdle at $87.46. Beyond those levels lie the previous horizontal ceiling at $95.82 and the EMA cluster bounded by the 50-day average at $92.28 and the 200-day average at $96.76.
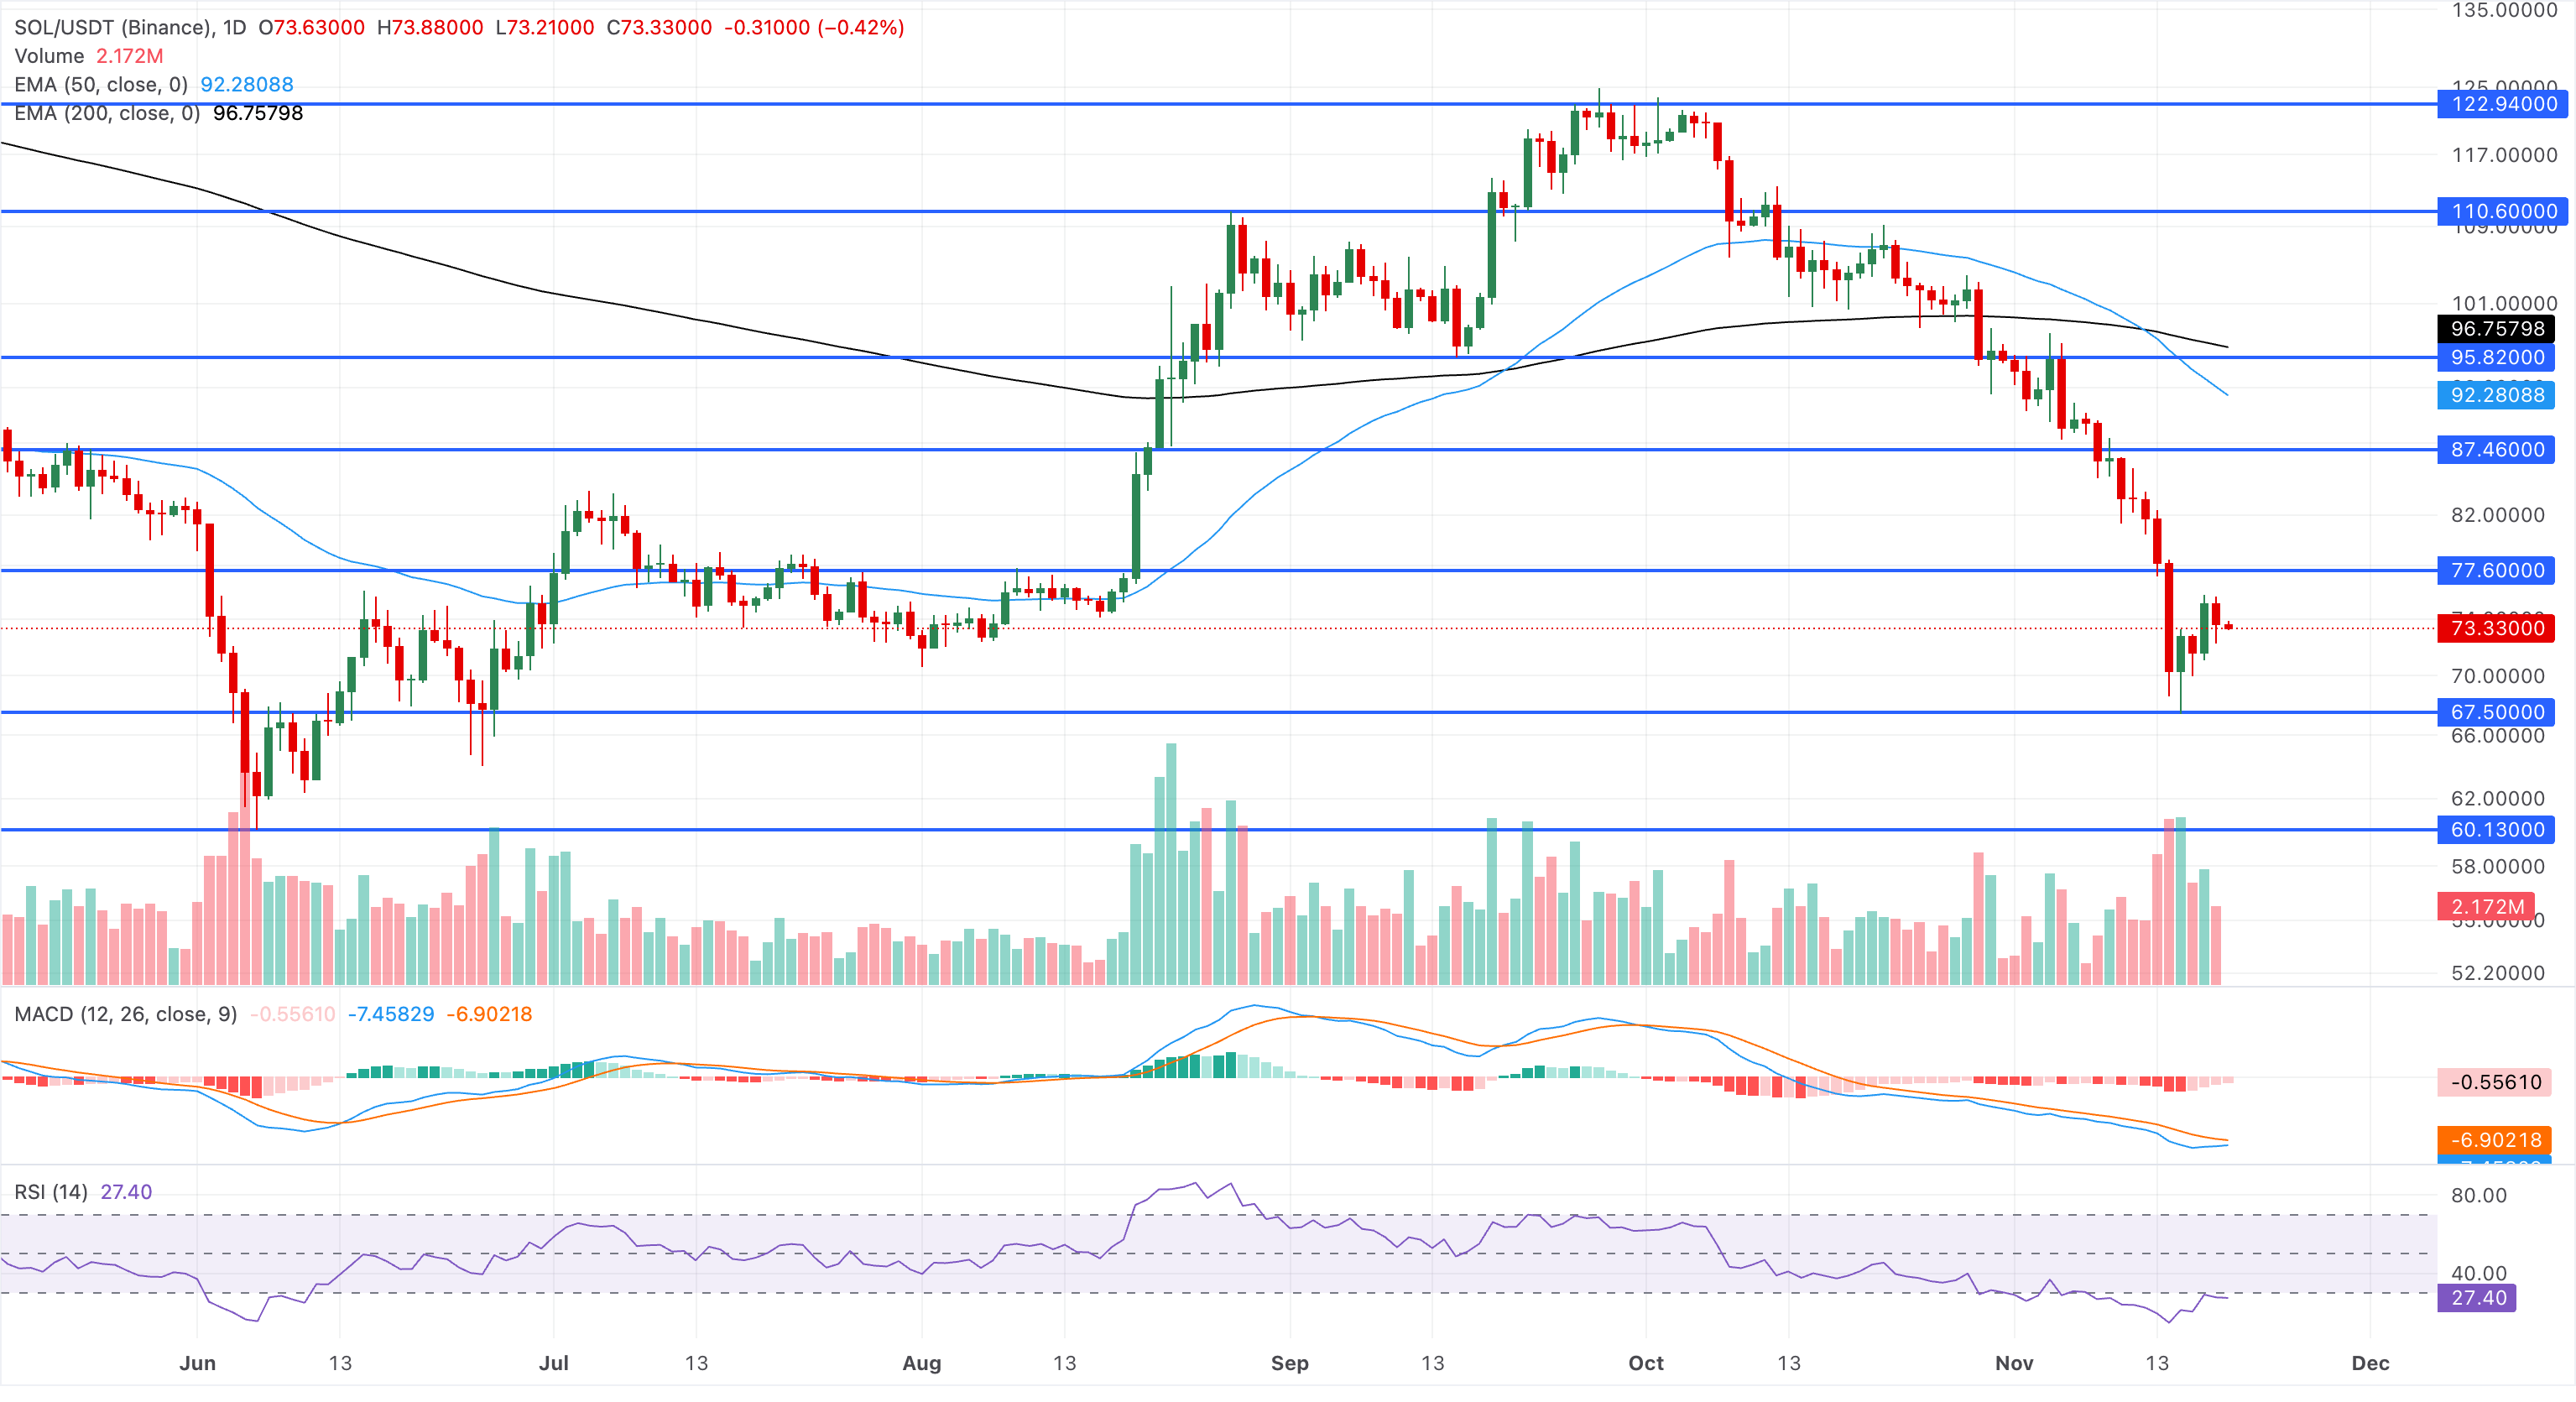
Should prices fall further, $67.50 provides immediate support, followed by a firmer structural base near $60.13.
(The technical analysis of this story was written with the help of an AI tool. Know more.)







Phone: +61 2 8036 8388
Fax: +61 2 8036 8388
Email: support@tmgm.com



The information provided on this website is of a general nature only and does not constitute personal financial advice. Before acting on any information on this website, you should consider the suitability of the information in relation to your objectives, financial situation and needs. Investing in CFDs and FX Margin Contracts carries significant risks and is not suitable for all investors. You may lose more than your initial deposit. You do not own, or have, any interest in the underlying asset. We recommend that you seek independent advice and ensure you fully understand the risks involved before trading. It is important that you read and consider the disclosure document before you acquire any product listed on the website. The information and advertisements offered on this website are not intended for use by any person in any country or jurisdiction where such use would be contrary to local laws and regulations. The Products and Services offered on this website are not intended for residents of the United States, Malaysia and Thailand.
TMGM is authorized and regulated in various jurisdictions.
Trademax Australia Limited, trading as TMGM, is regulated by the Australian Securities and Investments Commission (ASIC), AFSL no. 436416 and is located at Level 28, One International Tower, 100 Barangaroo Avenue, 2000 Sydney, NSW Australia.
Email: support@tmgm.com.au
Trademax Global Limited, trading as TMGM, is authorized and regulated by the Vanuatu Financial Services Commission (VFSC), registration number 40356 and registered at 1276, Kumul Highway, Port Vila, Vanuatu, Republic of Vanuatu.
Email: support@tmgm.com
Trademax Global Markets (SE) Limited, trading as TMGM, is authorized and regulated by the Financial Services Authority (FSA) of Seychelles, with license number SD224. The company is registered at Office No 13, Providence Estate ABIS Centre, Mahe, Seychelles.
Email: support@tmgm.com
Trademax Global Markets (International) Pty Ltd, trading as TMGM, is authorized and regulated by the Financial Services Commission, Mauritius (FSC) with license no. GB22201012, and registered at 33, Edith Cavell Street C/o IQ EQ Fund Services (Mauritius) Ltd Port Louis, 11324 Mauritius.
Email: support@tmgm.com
Copyright © TMGM. All rights reserved


