
News & AnalysisCareer

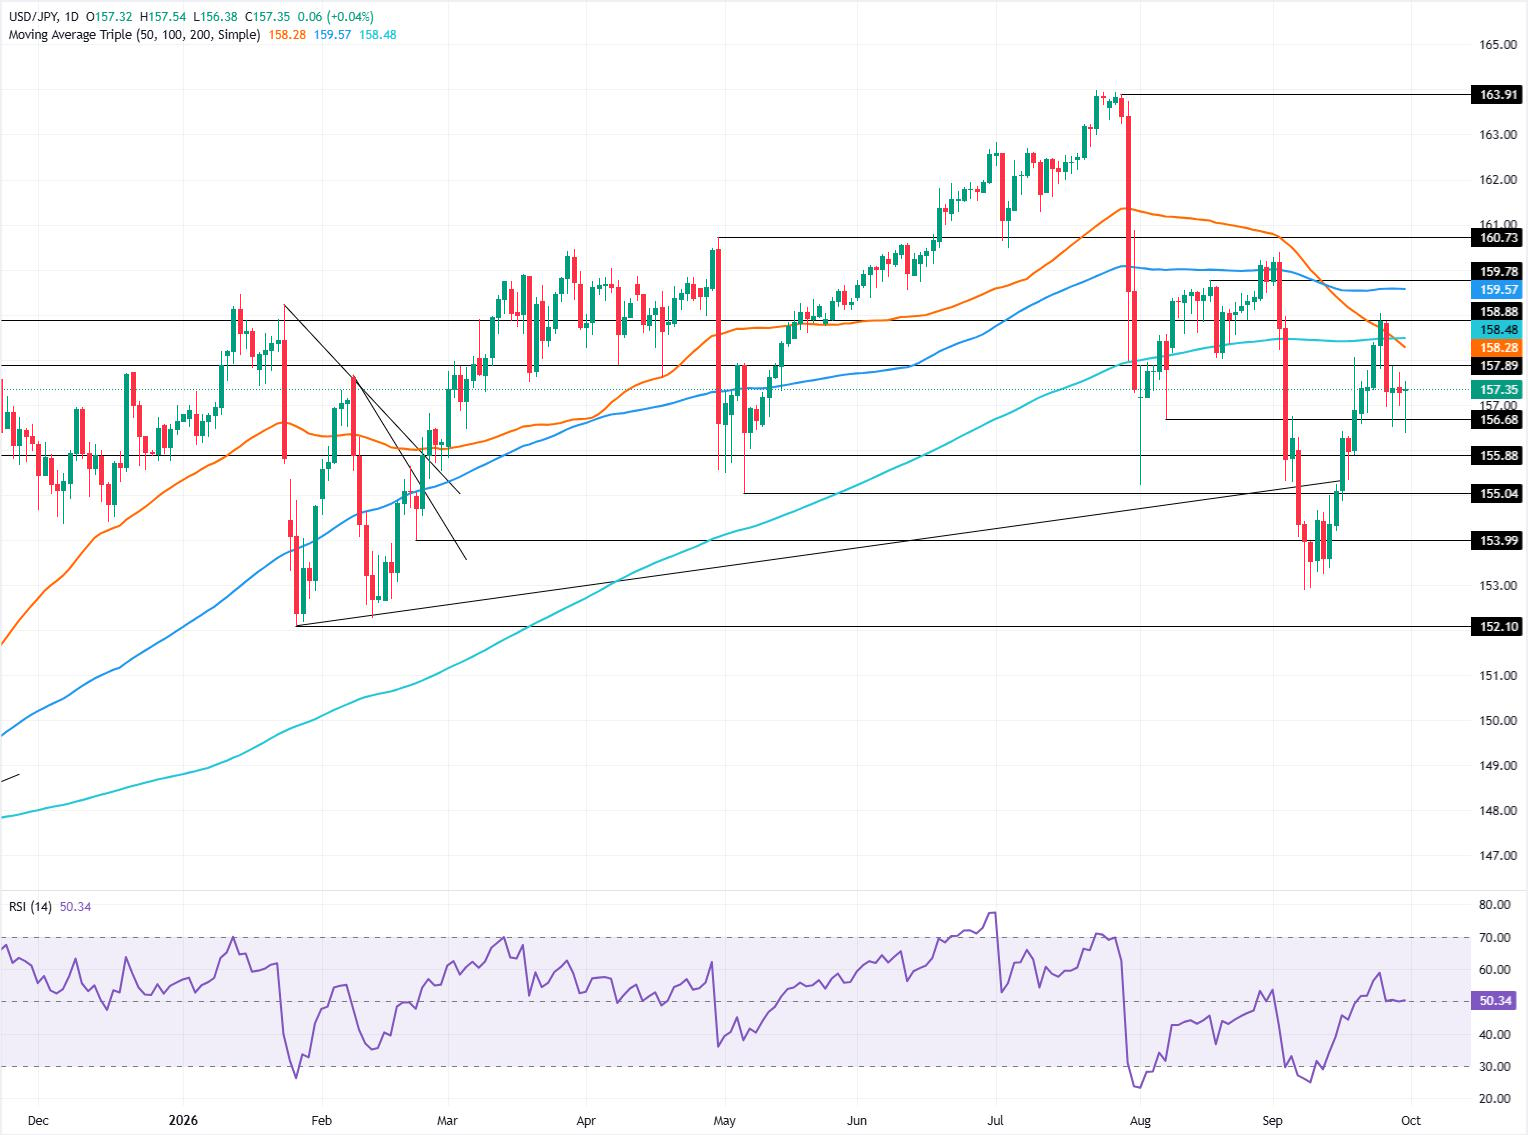
The USD/JPY registers modest gains of 0.08% on Wednesday after US inflation data trimmed market bets on a Federal Reserve rate hike at the October 28 meeting. At the time of writing, the pair trades at 157.42.
Price action shows that USD/JPY is neutral to downward-biased, following the last intervention by US and Japanese authorities, which pushed the pair from around 160.00 to 153.00 before recovering some ground to the current exchange rate.
Momentum favoured buyers, but recently sellers have stepped in as the Relative Strength Index (RSI) peaked at 60 before reversing to the 50-neutral level, indicating that further consolidation lies ahead.
For a bullish continuation, the pair must climb above the 50-day Simple Moving Average (SMA) at 158.28. Above the next resistance is 159.00, followed by the 100-day SMA at 159.57. UP next lies 160.00.
On the flip side, if USD/JPY dives below the low of the day (LOD) of 156.38, it opens the door to challenge 156.00. A breach of the latter will expose the May 6 low of 155.04, followed by the September 8 low of 152.89.
The table below shows the percentage change of Japanese Yen (JPY) against listed major currencies this month. Japanese Yen was the strongest against the New Zealand Dollar.
| USD | EUR | GBP | JPY | CAD | AUD | NZD | CHF | |
|---|---|---|---|---|---|---|---|---|
| USD | 2.53% | 2.13% | -1.49% | 2.73% | 3.17% | 4.97% | 3.35% | |
| EUR | -2.53% | -0.37% | -3.92% | 0.16% | 0.64% | 2.41% | 0.82% | |
| GBP | -2.13% | 0.37% | -3.57% | 0.54% | 1.01% | 2.78% | 1.21% | |
| JPY | 1.49% | 3.92% | 3.57% | 4.26% | 4.75% | 6.51% | 5.02% | |
| CAD | -2.73% | -0.16% | -0.54% | -4.26% | 0.48% | 2.17% | 0.65% | |
| AUD | -3.17% | -0.64% | -1.01% | -4.75% | -0.48% | 1.74% | 0.19% | |
| NZD | -4.97% | -2.41% | -2.78% | -6.51% | -2.17% | -1.74% | -1.54% | |
| CHF | -3.35% | -0.82% | -1.21% | -5.02% | -0.65% | -0.19% | 1.54% |
The heat map shows percentage changes of major currencies against each other. The base currency is picked from the left column, while the quote currency is picked from the top row. For example, if you pick the Japanese Yen from the left column and move along the horizontal line to the US Dollar, the percentage change displayed in the box will represent JPY (base)/USD (quote).







Phone: +61 2 8036 8388
Fax: +61 2 8036 8388
Email: support@tmgm.com



The information provided on this website is of a general nature only and does not constitute personal financial advice. Before acting on any information on this website, you should consider the suitability of the information in relation to your objectives, financial situation and needs. Investing in CFDs and FX Margin Contracts carries significant risks and is not suitable for all investors. You may lose more than your initial deposit. You do not own, or have, any interest in the underlying asset. We recommend that you seek independent advice and ensure you fully understand the risks involved before trading. It is important that you read and consider the disclosure document before you acquire any product listed on the website. The information and advertisements offered on this website are not intended for use by any person in any country or jurisdiction where such use would be contrary to local laws and regulations. The Products and Services offered on this website are not intended for residents of the United States, Malaysia and Thailand.
TMGM is authorized and regulated in various jurisdictions.
Trademax Australia Limited, trading as TMGM, is regulated by the Australian Securities and Investments Commission (ASIC), AFSL no. 436416 and is located at Level 28, One International Tower, 100 Barangaroo Avenue, 2000 Sydney, NSW Australia.
Email: support@tmgm.com.au
Trademax Global Limited, trading as TMGM, is authorized and regulated by the Vanuatu Financial Services Commission (VFSC), registration number 40356 and registered at 1276, Kumul Highway, Port Vila, Vanuatu, Republic of Vanuatu.
Email: support@tmgm.com
Trademax Global Markets (SE) Limited, trading as TMGM, is authorized and regulated by the Financial Services Authority (FSA) of Seychelles, with license number SD224. The company is registered at Office No 13, Providence Estate ABIS Centre, Mahe, Seychelles.
Email: support@tmgm.com
Trademax Global Markets (International) Pty Ltd, trading as TMGM, is authorized and regulated by the Financial Services Commission, Mauritius (FSC) with license no. GB22201012, and registered at 33, Edith Cavell Street C/o IQ EQ Fund Services (Mauritius) Ltd Port Louis, 11324 Mauritius.
Email: support@tmgm.com
Copyright © TMGM. All rights reserved


