

Trading
Explora una amplia gama de mercados con precios competitivos, liquidez profunda y herramientas de trading avanzadas.
Más información 
Plataforma
Opera sin interrupciones con la potente plataforma de TMGM, diseñada para ofrecer velocidad, precisión y una experiencia de trading superior.
Más información Plataforma de trading
Herramientas de trading
Academia
Aprende los fundamentos del trading con recursos ideales para principiantes, incluidas guías, seminarios web y análisis del mercado.
Más información Academia TMGM
Noticias y análisis
Obtén actualizaciones del mercado en tiempo real y análisis de expertos para adelantarte a las oportunidades de trading
Más información Noticias y análisis
Acerca de
Descubre qué distingue a TMGM: nuestra presencia global, solidez regulatoria y compromiso con la innovación en el trading.
Más información Por qué elegir TMGM
US Dollar Index roars towards 103 as hot CPI reignite Fed hike bets
- Dollar Index jumps 0.69% as headline inflation accelerates to 3.7%.
- Core CPI rises to 2.6%, reinforcing concerns over persistent inflation.
- October Fed hike odds surge to 42%, lifting Treasury yields.
The US Dollar Index (DXY), which tracks the performance of the Greenback against a basket of six major currencies, surges over 0.69% as US inflation data trumps the Fed’s dovish rhetoric that no rate hikes are needed in 2027. The DXY is up 0.69% at 102.90
DXY surges to 102.90 as accelerating inflation drives Treasury yields higher
The US Consumer Price Index (CPI) in September exceeded estimates, with the print coming at 0.6% MoM as expected, while on an annual basis it rose from 3.4% to 3.7% YoY, above forecasts. The core CPI, which excludes volatile items like energy and food, expanded by 0.3% MoM, above projections, and, in the twelve months to September, rose from 2.4% to 2.6%, also higher than expected.
A surge in gasoline and diesel prices, as well as food prices, underpinned headline inflation. Core CPI increased due to higher costs for shelter, owner-equivalent rent, recreation, and education, as well as a jump in used-car and truck prices.
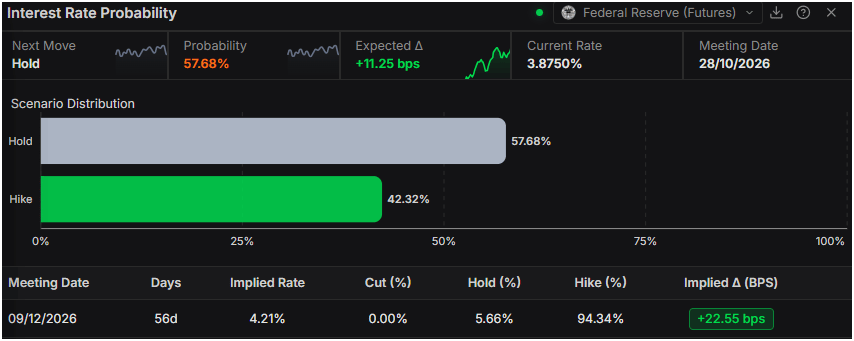
After the report, money markets increased the chances for a Fed rate hike at the October meeting. A day ago, the odds were close to 22%; at the time of writing, they surged to 42% and for 2027, investors are pricing in 54 basis points of tightening, according to Prime Terminal data.
US inflation data contradicts remarks by New York Fed President John Williams on Tuesday, who said he sees another rate hike in 2026 and none in 2027.
Worth noting that US Treasury yields surged, with the 10-year T-note yielding 5.251%, up 3.5 basis points. Meanwhile, the 2-year Treasury yield, the most sensitive to changes in short-term interest rates, rose nearly 7 basis points to 4.865%.
What’s next for the US Dollar?
The economic docket will feature the Fed’s Beige Book, the release of the Producer Price Index (PPI), Retail Sales, Initial Jobless Claims, and further Fed speaking.
US Dollar Index Price Forecast: Technical outlook
In the daily chart, Dollar Index Spot trades at 102.87. The index holds a bullish near-term bias as price stands well above the 50/100/200-day simple moving average cluster near 100.25 and rides an ascending medium-term trend line that is being tested around the current level. A long-term upward trend line offering support around 101.84 sits just below price, while the Relative Strength Index (14) at 71.85 shows overbought conditions, hinting that the advance is stretched but still underpinned by strong momentum.
On the downside, immediate support is aligned with the medium-term rising trend line at 102.87, followed by the long-term ascending trend line around 101.84. A deeper pullback would target the key moving average floor near 100.25, where the 50-, 100- and 200-day simple moving averages cluster to reinforce broader bullish structure.
(The technical analysis of this story was written with the help of an AI tool. Know more.)
US Dollar Price Today
The table below shows the percentage change of US Dollar (USD) against listed major currencies today. US Dollar was the strongest against the British Pound.
| USD | EUR | GBP | JPY | CAD | AUD | NZD | CHF | |
|---|---|---|---|---|---|---|---|---|
| USD | 0.70% | 0.81% | 0.29% | 0.44% | 0.40% | 0.74% | 0.72% | |
| EUR | -0.70% | 0.11% | -0.39% | -0.22% | -0.32% | 0.01% | 0.02% | |
| GBP | -0.81% | -0.11% | -0.50% | -0.38% | -0.41% | -0.08% | -0.09% | |
| JPY | -0.29% | 0.39% | 0.50% | 0.17% | 0.11% | 0.46% | 0.44% | |
| CAD | -0.44% | 0.22% | 0.38% | -0.17% | -0.05% | 0.29% | 0.27% | |
| AUD | -0.40% | 0.32% | 0.41% | -0.11% | 0.05% | 0.34% | 0.31% | |
| NZD | -0.74% | -0.01% | 0.08% | -0.46% | -0.29% | -0.34% | -0.01% | |
| CHF | -0.72% | -0.02% | 0.09% | -0.44% | -0.27% | -0.31% | 0.00% |
The heat map shows percentage changes of major currencies against each other. The base currency is picked from the left column, while the quote currency is picked from the top row. For example, if you pick the US Dollar from the left column and move along the horizontal line to the Japanese Yen, the percentage change displayed in the box will represent USD (base)/JPY (quote).
Artículos destacados
1New Zealand Dollar plunges to 18-month low as hot US inflation fuels US Dollar rally2US Dollar Index roars towards 103 as hot CPI reignite Fed hike bets3Swiss Franc slides as hot US inflation reinforces hawkish Fed outlook4United States: Core CPI and PCE re-accelerate – TD Securities5Bitcoin and Gold Forecast: BTC and XAU drop after hot US CPI6South Korean Won: Equity rout drives downside hedging – MUFG7Australian Dollar reverses gains as hot US inflation boosts US Dollar8Canadian Dollar weakens as US CPI puts October Fed hike in play9European Central Bank: October skip and limited hikes – BNY
COTIZACIONES EN VIVO


TODO SOBRE FOREX
Margin Call Meaning: What It Is, What Triggers It and How to Avoid One
Top 15 Weakest Currencies in the World
Top 15 Strongest Currencies in the World
Is Forex Trading Halal?
Best Time to Trade Forex
Forex Trading vs Futures Trading
Forex Trading vs Stock Trading
Forex Trading vs Crypto Trading
Is Forex Trading Profitable In 2026?
¡Comience ahora!
Regístrese y acceda a los mercados globales en menos de 3 minutos

Conéctese con nosotros









Contactos
Teléfono: +61 2 8036 8388
Fax: +61 2 8036 8388
Correo electrónico: support@tmgm.com



La información proporcionada en este sitio web es únicamente de carácter general y no constituye asesoramiento financiero personal. Antes de actuar sobre cualquier información de este sitio web, debe considerar la idoneidad de la información en relación con sus objetivos, situación financiera y necesidades. Invertir en CFD y contratos de margen de FX conlleva riesgos significativos y no es adecuado para todos los inversores. Puede perder más que su depósito inicial. Usted no posee ni tiene ningún interés en el activo subyacente. Le recomendamos que busque asesoramiento independiente y se asegure de comprender plenamente los riesgos involucrados antes de operar. Es importante que lea y considere el documento de divulgación antes de adquirir cualquier producto listado en el sitio web. La información y los anuncios ofrecidos en este sitio web no están destinados al uso por parte de ninguna persona en ningún país o jurisdicción donde dicho uso sea contrario a las leyes y regulaciones locales. Los productos y servicios ofrecidos en este sitio web no están destinados a residentes de Estados Unidos, Malasia y Tailandia.
TMGM está autorizado y regulado en varias jurisdicciones.
Trademax Australia Limited, que opera como TMGM, está regulada por la Comisión Australiana de Valores e Inversiones (ASIC), AFSL n.º 436416, y está ubicada en Level 28, One International Tower, 100 Barangaroo Avenue, 2000 Sydney, NSW Australia.
Correo electrónico: support@tmgm.com.au
Trademax Global Limited, que opera como TMGM, está autorizada y regulada por la Comisión de Servicios Financieros de Vanuatu (VFSC), número de registro 40356, y está registrada en 1276, Kumul Highway, Port Vila, Vanuatu, República de Vanuatu.
Correo electrónico: support@tmgm.com
Trademax Global Markets (SE) Limited, que opera como TMGM, está autorizada y regulada por la Autoridad de Servicios Financieros (FSA) de Seychelles, con número de licencia SD224. La empresa está registrada en Office No 13, Providence Estate ABIS Centre, Mahe, Seychelles.
Correo electrónico: support@tmgm.com
Trademax Global Markets (International) Pty Ltd, que opera como TMGM, está autorizada y regulada por la Comisión de Servicios Financieros de Mauricio (FSC) con licencia n.º GB22201012, y está registrada en 33, Edith Cavell Street C/o IQ EQ Fund Services (Mauritius) Ltd Port Louis, 11324 Mauricio.
Correo electrónico: support@tmgm.com
Copyright © TMGM. Todos los derechos reservados