

British Pound extends losses against Euro with BoE decision in focus
- EUR/GBP advances for a second day as traders trim British Pound exposure before the BoE interest rate decision.
- The 100-day SMA near 0.8600 caps the upside, while the 50-day SMA provides initial support.
- Neutral RSI and weak ADX readings point to a lack of strong directional momentum.
EUR/GBP extends its recovery on Wednesday after bouncing from the 50-day Simple Moving Average (SMA) at 0.8555 on Monday, its lowest level in two weeks. The British Pound (GBP) underperforms across the board as traders trim their exposure ahead of the Bank of England’s (BoE) interest-rate decision on Thursday, while broadly in-line UK inflation data fail to trigger a strong market reaction. At the time of writing, the cross trades around 0.8573, up roughly 0.10% on the day.

Strategists at Brown Brothers Harriman note that the BoE is “widely expected to keep the policy rate at 3.75% for a sixth straight meeting tomorrow given contained UK inflation pressures and ongoing labor market slack.” They highlight that market pricing remains more aggressive, with “the swaps curve [implying] 100bps of BoE rate hikes to 4.75%” over the next twelve months.
However, BBH cautions that “the BoE may not need to tighten as much as markets expect.” They point out that “the UK economy is already operating below capacity,” that “Bank Rate at 3.75% is near the top of the BoE’s estimated 2% to 4% neutral range,” and that “fiscal policy will likely turn more restrictive.” In their view, the “bottom line: GBP is vulnerable to a dovish BoE repricing.”
Société Générale flags risk of autumn sterling wobble ahead of UK Budget
Strategists at Société Générale argue that the recent move in EUR/GBP below 0.86 has largely run its course, and that the focus now shifts to fiscal policy. They contend that “the key event in the coming weeks is really the Budget, on October 28, rather than either tomorrow’s MPC meeting, or the November 5 one, when the market currently prices in a hike.” While noting that “the consensus forecaster expects 1.2% growth in both the US and Eurozone next year,” they caution that “fiscal austerity in the UK could cast doubt about the UK outlook.”
With “UK rates already 125bp higher than in the Eurozone,” Société Générale sees “less urgency about further Bank of England tightening,” and warns that “a narrowing rate differential and concerns about tighter fiscal policy suggest that if we are going to see a sterling wobble, it is likely to come this autumn.” In their view, “a wobble could take EUR/GBP back to 0.88 in Q4.”
Technical analysis
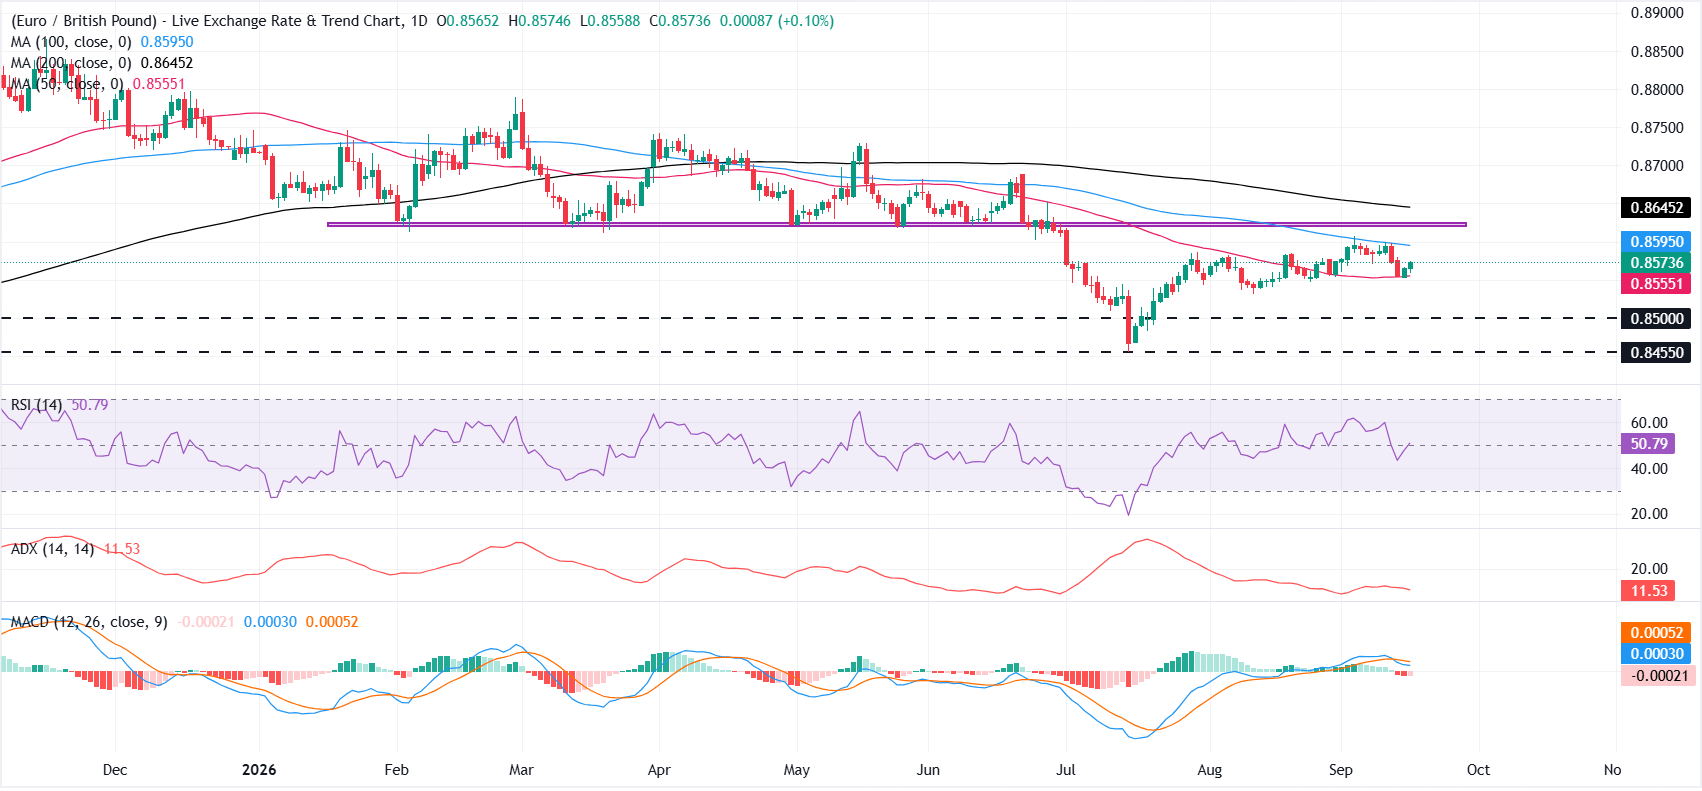
From a technical perspective, EUR/GBP is seeing limited follow-through after rebounding from below 0.8500 in mid-July, with gains capped by the 0.8600-0.8610 region. This former multi-month support zone now acts as resistance and closely aligns with the 100-day Simple Moving Average (SMA) at 0.8595, creating a firm barrier for buyers.
The Relative Strength Index (RSI) near 51 hints at mildly positive but largely balanced momentum, and the low Average Directional Index (ADX) reinforces that trend strength remains weak, leaving price oscillating between nearby moving-average barriers. The Moving Average Convergence Divergence (MACD) line sits fractionally negative and close to the signal line, hinting at a lack of decisive directional pressure in the near term.
On the topside, a clear break above the 100-day SMA at 0.8595 and the 0.8600-0.8610 resistance region would open the door toward the 200-day SMA at 0.8645.
On the downside, immediate support is seen at the 50-day SMA near 0.8554. A break below this level would expose the psychological 0.8500 mark, followed by the July low near 0.8455.
(The technical analysis of this story was written with the help of an AI tool. Know more.)
Pound Sterling Price Today
The table below shows the percentage change of British Pound (GBP) against listed major currencies today. British Pound was the strongest against the Canadian Dollar.
| USD | EUR | GBP | JPY | CAD | AUD | NZD | CHF | |
|---|---|---|---|---|---|---|---|---|
| USD | 0.06% | 0.16% | -0.05% | 0.14% | 0.00% | -0.09% | 0.03% | |
| EUR | -0.06% | 0.11% | -0.09% | 0.10% | -0.07% | -0.13% | -0.02% | |
| GBP | -0.16% | -0.11% | -0.19% | -0.02% | -0.19% | -0.23% | -0.12% | |
| JPY | 0.05% | 0.09% | 0.19% | 0.18% | 0.03% | -0.02% | 0.06% | |
| CAD | -0.14% | -0.10% | 0.02% | -0.18% | -0.15% | -0.21% | -0.12% | |
| AUD | -0.00% | 0.07% | 0.19% | -0.03% | 0.15% | -0.05% | 0.00% | |
| NZD | 0.09% | 0.13% | 0.23% | 0.02% | 0.21% | 0.05% | 0.11% | |
| CHF | -0.03% | 0.02% | 0.12% | -0.06% | 0.12% | -0.01% | -0.11% |
The heat map shows percentage changes of major currencies against each other. The base currency is picked from the left column, while the quote currency is picked from the top row. For example, if you pick the British Pound from the left column and move along the horizontal line to the US Dollar, the percentage change displayed in the box will represent GBP (base)/USD (quote).














