


British Pound gains ground as Japanese Yen underperforms
- GBP/JPY edges higher as falling Japanese bond yields weigh on the Yen.
- The wide UK-Japan yield gap supports the British Pound, although intervention and UK fiscal risks cap gains.
- The cross remains below all major daily SMAs, keeping the broader bias bearish.
GBP/JPY trades with a mild positive bias on Friday as the Japanese Yen (JPY) underperforms across the board. A pause in the global bond sell-off has pushed government bond yields lower, with Japanese yields falling more sharply than their UK counterparts. Japan’s relatively low interest rates and broader fiscal concerns also remain persistent headwinds for the Yen. At the time of writing, the cross trades around 209.16, up 0.14% on the day.

Japan’s benchmark 10-year government bond yield falls toward 3.00% after reaching 3.153% earlier this week, its highest level in around 30 years. Meanwhile, the UK 10-year gilt yield stands near 5.432%, below Thursday’s peak of 5.527%, its highest level since 2007. This leaves UK yields roughly 243 basis points above Japanese yields, helping the Pound hold firm against the Yen.
Expectations that the Bank of England (BoE) could raise interest rates before the end of the year also favour the British Pound (GBP), even as the Bank of Japan (BoJ) remains on a gradual tightening path.
BoE Governor Andrew Bailey said on Thursday, “Monetary policy needs an unwavering commitment to returning inflation to target.” Bailey added, “Evidence of pass-through of energy costs into broader inflation is currently quite subdued, but there are risks. Inflation risks rise the longer high energy prices persist.”
On the Japanese side, BoJ Governor Kazuo Ueda said on Tuesday, “We’re to keep raising rates in response to the economy and inflation.” However, Ueda added that the “pace and timing of future policy adjustment will be decided based on the likelihood of our baseline projections materialising, as well as risks.”
Meanwhile, traders remain cautious about building aggressive bullish positions. Intervention risks keep traders wary as USD/JPY holds around 158.00, not far from the 160.00 level. Concerns over the UK’s fiscal outlook ahead of the October 28 budget also limit demand for the British Pound, keeping GBP/JPY within the narrow range in place since early September.
Technical analysis
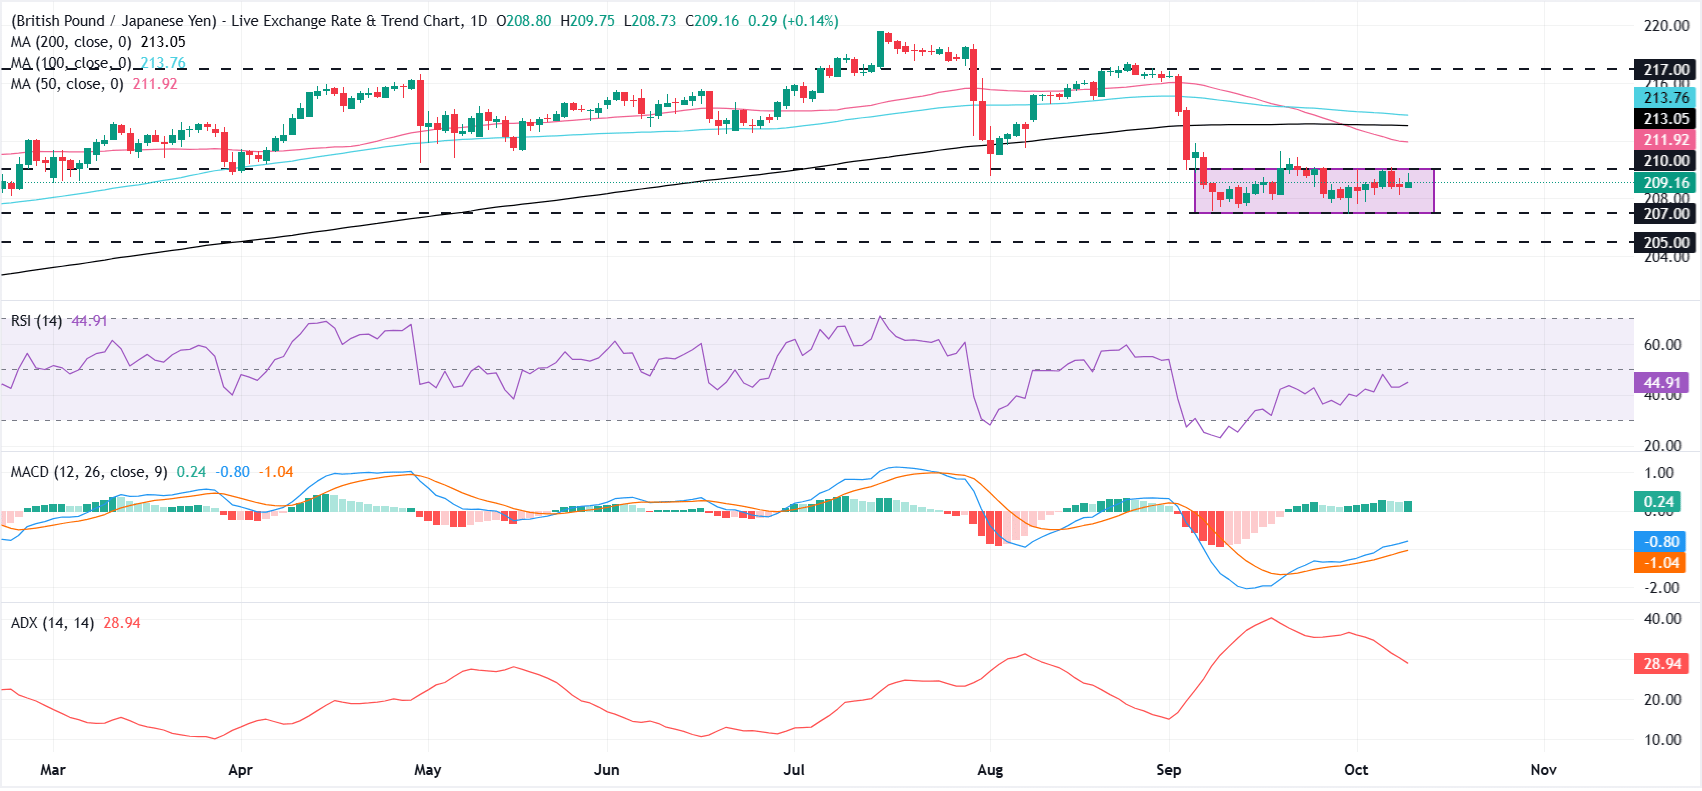
On the daily chart, GBP/JPY remains trapped within the 207-210range. The cross trades below the 50-day, 100-day and 200-day Simple Moving Averages (SMAs), which collectively cap the topside and keep the near-term bias bearish.
Momentum indicators offer mixed signals. The Relative Strength Index (RSI) stands near 46, slightly below the neutral 50 level, while the Moving Average Convergence Divergence (MACD) has turned positive, pointing to an attempt to stabilise rather than a clear bullish reversal.
On the downside, initial support is seen at 207, ahead of a deeper floor at 205 that would come into view on a renewed slide. On the topside, a daily close above 210 would be the first step to easing bearish pressure, though bulls would still need to reclaim the 50-day SMA at 211.92, followed by the 200-day SMA at 213.05 and the 100-day SMA at 213.77, before the broader picture turns more constructive, with the distant horizontal barrier at 217 marking a stronger resistance zone.
(The technical analysis of this story was written with the help of an AI tool. Know more.)
Japanese Yen Price Today
The table below shows the percentage change of Japanese Yen (JPY) against listed major currencies today. Japanese Yen was the strongest against the Euro.
| USD | EUR | GBP | JPY | CAD | AUD | NZD | CHF | |
|---|---|---|---|---|---|---|---|---|
| USD | 0.07% | 0.08% | 0.19% | 0.01% | -0.34% | -0.18% | -0.12% | |
| EUR | -0.07% | 0.02% | 0.12% | -0.06% | -0.40% | -0.20% | -0.20% | |
| GBP | -0.08% | -0.02% | 0.13% | -0.04% | -0.40% | -0.23% | -0.15% | |
| JPY | -0.19% | -0.12% | -0.13% | -0.18% | -0.54% | -0.37% | -0.29% | |
| CAD | -0.01% | 0.06% | 0.04% | 0.18% | -0.38% | -0.20% | -0.11% | |
| AUD | 0.34% | 0.40% | 0.40% | 0.54% | 0.38% | 0.17% | 0.28% | |
| NZD | 0.18% | 0.20% | 0.23% | 0.37% | 0.20% | -0.17% | 0.10% | |
| CHF | 0.12% | 0.20% | 0.15% | 0.29% | 0.11% | -0.28% | -0.10% |
The heat map shows percentage changes of major currencies against each other. The base currency is picked from the left column, while the quote currency is picked from the top row. For example, if you pick the Japanese Yen from the left column and move along the horizontal line to the US Dollar, the percentage change displayed in the box will represent JPY (base)/USD (quote).
인기 기사
1United States: Core CPI trend seen moderating – TD Securities2Has Bitcoin really escaped the macro forces it was built to fight?3Norwegian Krone: Rate hike risks support currency – BBH4British Pound gains ground as Japanese Yen underperforms5Japanese Yen: Choppy trade inside defined range – UOB6Bitcoin Weekly Forecast: Uptober or Rektober?7Oil: Iran tensions keep crude prices elevated - Rabobank8Ripple Price Forecast: XRP bulls gather recovery momentum amid returning ETF inflows9EUR/USD Price Forecast: Rallies fail above 1.1200 amid high Oil prices, debt woes
실시간 시세


TECHNICAL에 대한 모든 것
ICT 트레이딩이란 무엇인가요? 이너 서클 트레이더(Inner Circle Trader) 개념 설명
지지선과 저항선: 의미, 유형, 레벨을 그리는 방법 및 트레이딩 전략
유동성이란 무엇인가요? 트레이딩 및 금융시장에서의 의미
유동성 스윕: 의미, 예시 및 트레이딩 전략
트레이딩의 시장 구조: 완벽 가이드 (상승장, 하락장, 횡보장)
캐릭터 변화 (CHoCH): 정의, 예시 및 전략
강세 키커 패턴이란 무엇이며, 어떻게 트레이딩에 활용할 수 있을까요?
역망치형 캔들스틱 패턴이란 무엇이며, 이를 어떻게 트레이딩하나요?
강세형 버려진 아기형 패턴(Bullish Abandoned Baby Pattern)이란 무엇이며, 어떻게 트레이딩하나요?

소셜 미디어












이 웹사이트에 제공된 정보는 일반적인 성격의 정보일 뿐이며 개인 맞춤형 금융 자문을 구성하지 않습니다. 이 웹사이트의 정보를 바탕으로 행동하기 전에, 귀하의 목표, 재정 상황 및 필요에 비추어 해당 정보의 적합성을 고려해야 합니다. CFD 및 FX 마진 계약에 대한 투자는 상당한 위험을 수반하며 모든 투자자에게 적합하지 않을 수 있습니다. 귀하는 최초 예치금보다 더 큰 손실을 입을 수 있습니다. 귀하는 기초자산에 대한 소유권이나 어떠한 이해관계도 보유하지 않습니다. 거래를 시작하기 전에 독립적인 자문을 구하고 관련 위험을 충분히 이해하시기를 권장합니다. 웹사이트에 기재된 상품을 취득하기 전에 공시 문서를 읽고 검토하는 것이 중요합니다. 이 웹사이트에서 제공되는 정보 및 광고는 그러한 사용이 현지 법률 및 규정에 위배되는 국가 또는 관할권의 개인이 사용하도록 의도된 것이 아닙니다. 이 웹사이트에서 제공되는 상품 및 서비스는 미국, 말레이시아 및 태국 거주자를 대상으로 하지 않습니다.
TMGM은 다양한 관할권에서 승인 및 규제를 받고 있습니다.
TMGM으로 거래하는 Trademax Australia Limited는 호주 증권투자위원회(ASIC)의 규제를 받으며, AFSL 번호 436416이고 Level 28, One International Tower, 100 Barangaroo Avenue, 2000 Sydney, NSW Australia에 위치하고 있습니다.
이메일: support@tmgm.com.au
TMGM으로 거래하는 Trademax Global Limited는 바누아투 금융서비스위원회(VFSC)의 승인 및 규제를 받으며, 등록 번호 40356이고 1276, Kumul Highway, Port Vila, Vanuatu, Republic of Vanuatu에 등록되어 있습니다.
이메일: support@tmgm.com
Trademax Global Markets (SE) Limited(이하 TMGM)는 세이셸 금융청(FSA)의 인가 및 규제를 받으며, 허가 번호는 SD224입니다. 회사는 세이셸 마헤, 프로비던스 에스테이트 ABIS 센터, 사무실 번호 13에 등록되어 있습니다.
이메일: support@tmgm.com
TMGM으로 거래하는 Trademax Global Markets (International) Pty Ltd는 모리셔스 금융서비스위원회(FSC)의 승인 및 규제를 받으며 라이선스 번호 GB22201012이고, 33, Edith Cavell Street C/o IQ EQ Fund Services (Mauritius) Ltd Port Louis, 11324 Mauritius에 등록되어 있습니다.
이메일: support@tmgm.com
Copyright © TMGM. All rights reserved