

Торговля
Изучите широкий спектр рынков с конкурентными ценами, высокой ликвидностью и передовыми торговыми инструментами.
Узнать больше 
Платформа
Торгуйте без сбоев на мощной платформе TMGM, созданной для скорости, точности и превосходного торгового опыта.
Узнать больше Торговая платформа
Торговые инструменты
Академия
Изучите основы торговли с помощью материалов для начинающих, включая руководства, вебинары и аналитические обзоры рынка.
Узнать больше Новости и аналитика
Получайте актуальные рыночные обновления и экспертную аналитику, чтобы быть на шаг впереди торговых возможностей
Узнать больше Новости и аналитика
О нас
Узнайте, что отличает TMGM — наше глобальное присутствие, надежное регулирование и приверженность инновациям в трейдинге.
Узнать больше Почему выбирают TMGM
Спонсорство
Pi Network Price Forecast: PI defends key support as crypto sentiment sinks
- Pi Network hovers around $0.0750 on Tuesday after three consecutive days of losses, with a resistance trendline capping the rebound attempt.
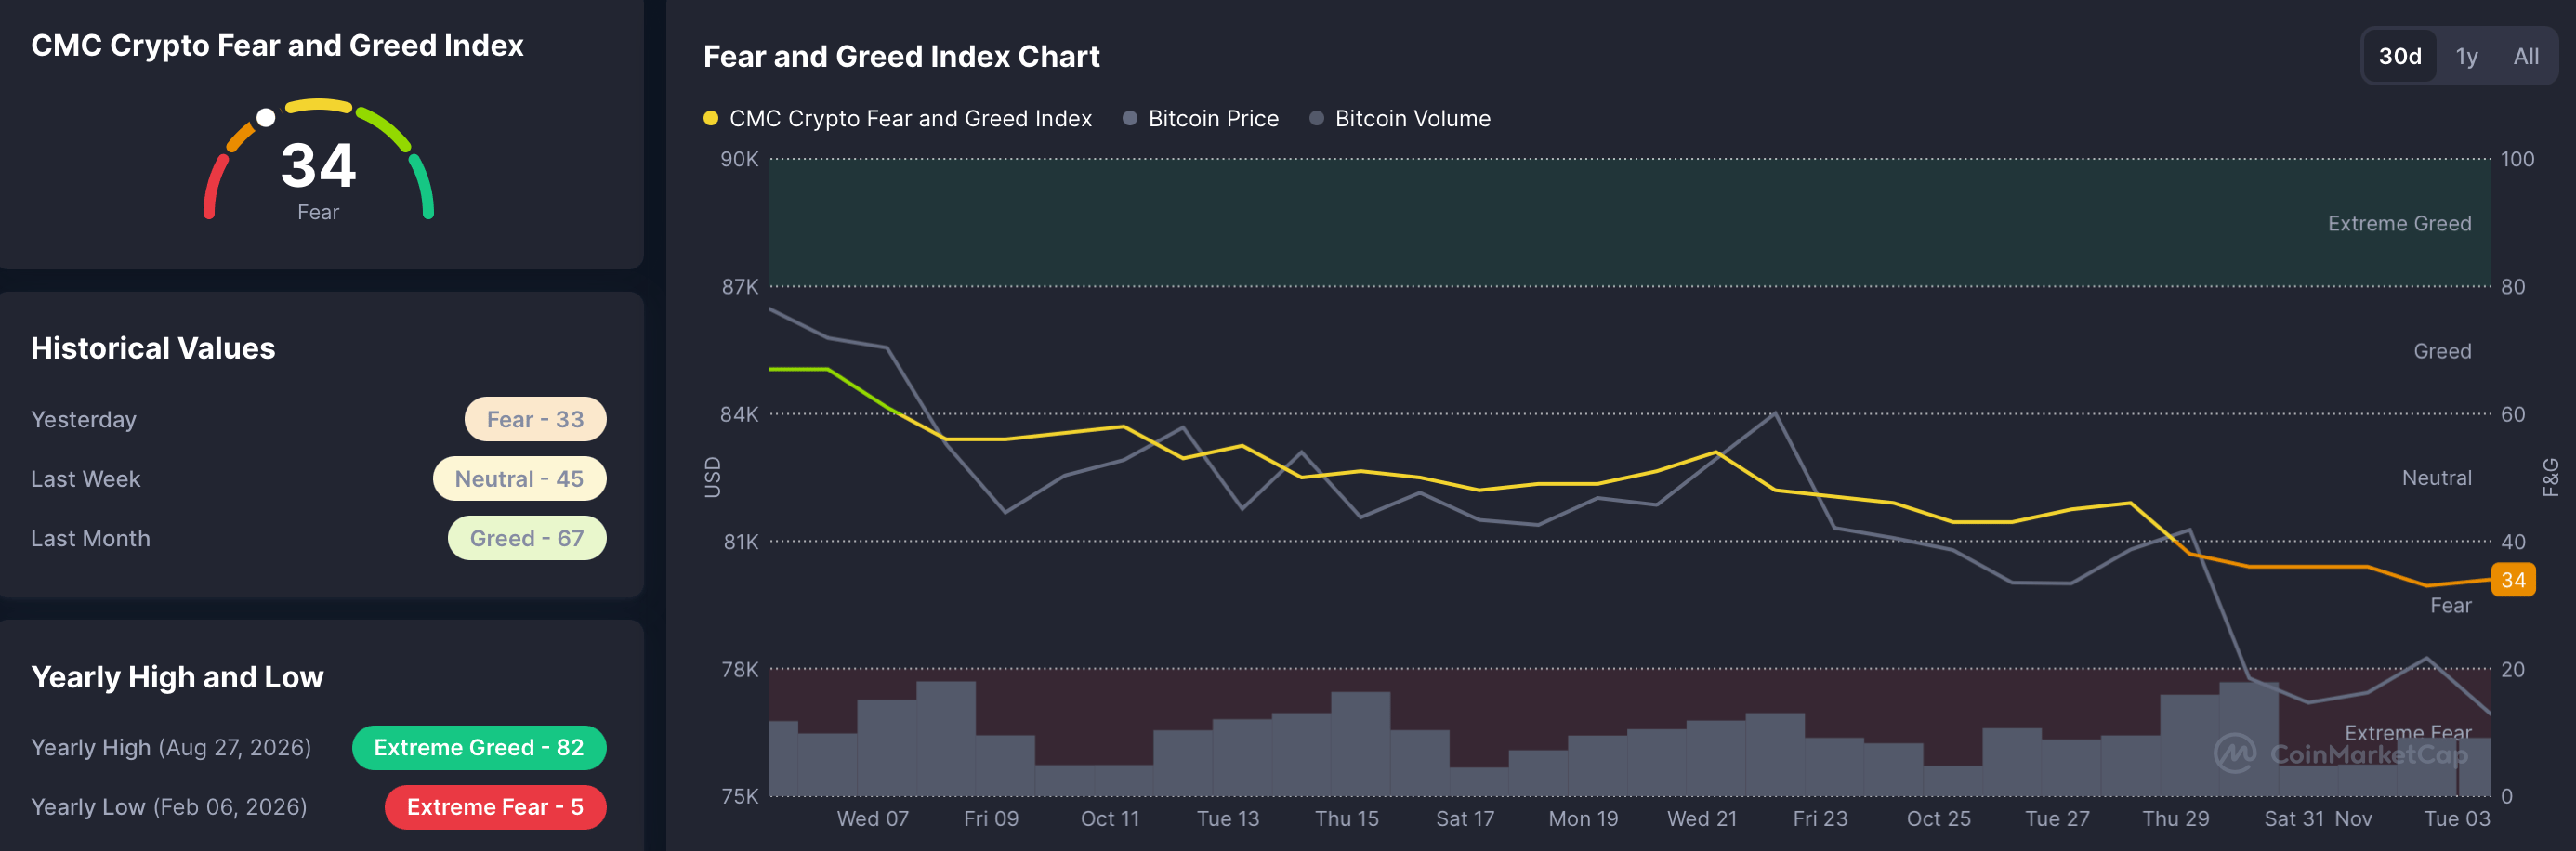
- Crypto market sentiment is weak following the $6.3 billion Binance hack, with the Fear and Greed Index down to 34.
- The technical outlook for the PI token is mixed, as the price remains capped while momentum recovers to neutral levels.
Pi Network (PI) trades around $0.0750 at press time on Tuesday, after three straight bearish daily closes amid intense headwinds. The broader cryptocurrency market is seeing weakening social sentiment following the $6.3 billion Binance hack, weighing on speculative tokens. The technical outlook for Pi Network is mixed, as the price defends a near-term support but remains capped below a long-term overhead resistance trendline.

Broader market fear weighs on PI
The $6.3 billion Binance hack accelerated the decline in social sentiment in the broader crypto market. CoinMarketCap’s Fear and Greed Index is down to 34 on Tuesday from 45 last week, suggesting that fear is sinking into investors’ sentiment.
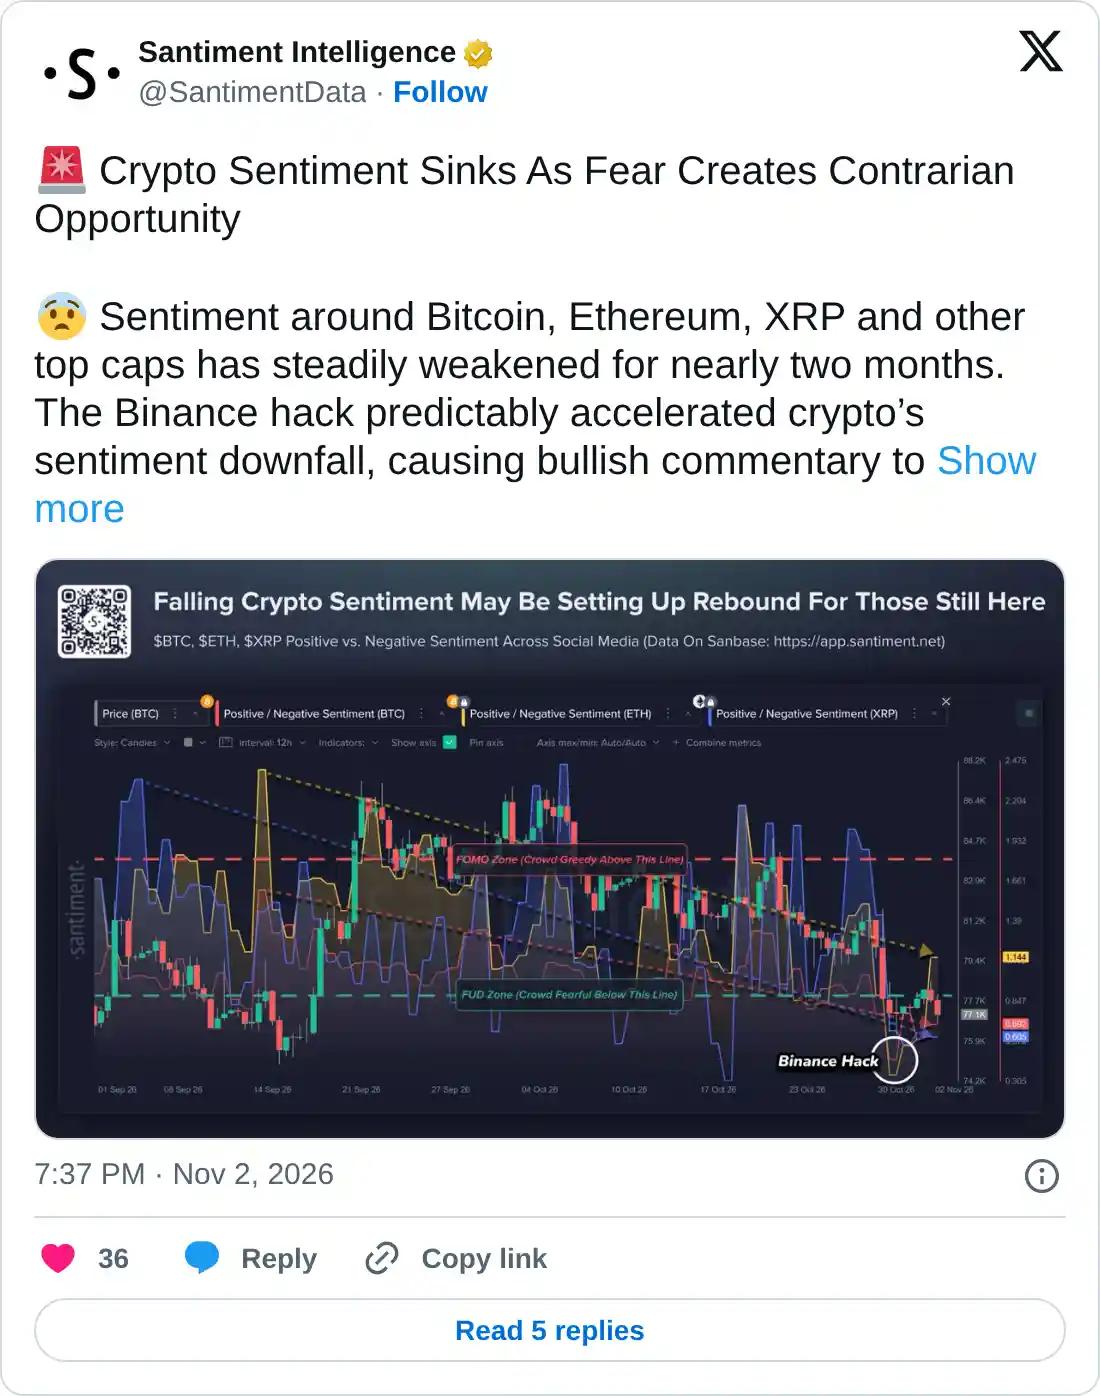
Santiment data shows that bullish comments for Bitcoin, Ethereum (ETH), and Ripple (XRP) are collapsing relative to bearish ones. The bullish-to-bearish comment ratios for BTC and XRP are 0.69 and 0.61, respectively, while ETH stands at 1.14.
If the Fear and Greed Index slips below 20 or the ratios remain below 1, it could indicate “Extreme Fear” in the market. However, such extreme Fear, Uncertainty, and Doubt (FUD) phases often create a strong rebound opportunity once the panic has had time to settle.
Technical outlook: Will Pi Network rebound to ignite a breakout rally?
Pi Network trades at $0.0766 at press time on Tuesday, keeping a bearish near-term tone. The price holds beneath both the downward resistance trendline at $0.0784, which has remained intact since July 20.
The 50-day Exponential Moving Average (EMA) at $0.0825 reinforces the resistance trendline, suggesting rallies are likely to be capped by overhead supply. A confirmed breakout above this zone could extend the rally toward the 50% retracement level of the downswing from $0.1394 to $0.0704 at $0.1049.
The Moving Average Convergence Divergence (MACD) hovers above the signal line in negative territory on the daily chart, while the Relative Strength Index (RSI) near 39 suggests only modest downside pressure.
On the downside, short-term demand is at the October 15 low of $0.0740, while the main structural floor sits at the Fibonacci cycle low near $0.0704, where a deeper slide would likely meet more meaningful buying interest.
(The technical analysis of this story was written with the help of an AI tool. Know more.)
Лучшие статьи
1GBP/USD Price Forecast: Holds steady above 1.3400, retains constructive tone above key support 2EUR/JPY Price Forecast: Holds above 176.50 near nine-day EMA3WTI Price Forecast: Clings to modest gains above $96.00 as US-Iran peace hopes cap upside4India Gold price today: Gold falls, according to FXStreet data5Gold weakens back below $3,950 as Fed hike bets weigh ahead of US midterm elections6Ripple and Stellar outlook: XRP and XLM slide as bearish signal grows7Australian Dollar declines after RBA hikes rates by 25 bps to 4.85%8Pi Network Price Forecast: PI defends key support as crypto sentiment sinks9Australian Dollar softens against Japanese Yen as RBA lifts rate to 4.85% in fifth hike this year


Начать!
Зарегистрируйтесь и получите доступ к глобальным рынкам менее чем за 3 минуты

Свяжитесь с нами









Контакты
Телефон: +61 2 8036 8388
Факс: +61 2 8036 8388
Эл. почта: support@tmgm.com
Веб-сайт: https://www.tmgmasia.com



Информация, представленная на этом веб-сайте, носит исключительно общий характер и не является персональной финансовой консультацией. Прежде чем действовать на основании любой информации на этом веб-сайте, вам следует оценить ее уместность с учетом ваших целей, финансового положения и потребностей. Инвестирование в CFD и маржинальные контракты на FX сопряжено со значительными рисками и подходит не всем инвесторам. Вы можете потерять больше, чем ваш первоначальный депозит. Вы не владеете базовым активом и не имеете в нем какой-либо доли. Мы рекомендуем вам обратиться за независимой консультацией и убедиться, что вы полностью понимаете связанные с этим риски, прежде чем начинать торговлю. Важно прочитать и принять во внимание документ с раскрытием информации, прежде чем приобретать любой продукт, указанный на веб-сайте. Информация и рекламные материалы, предлагаемые на этом веб-сайте, не предназначены для использования любым лицом в любой стране или юрисдикции, где такое использование противоречило бы местным законам и нормативным актам. Продукты и услуги, предлагаемые на этом веб-сайте, не предназначены для резидентов США, Малайзии и Таиланда.
TMGM уполномочена и регулируется в различных юрисдикциях.
Trademax Australia Limited, работающая под брендом TMGM, регулируется Australian Securities and Investments Commission (ASIC), AFSL № 436416 и находится по адресу: Level 28, One International Tower, 100 Barangaroo Avenue, 2000 Sydney, NSW Australia.
Email: support@tmgm.com.au
Trademax Global Limited, работающая под брендом TMGM, уполномочена и регулируется Vanuatu Financial Services Commission (VFSC), регистрационный номер 40356, и зарегистрирована по адресу: 1276, Kumul Highway, Port Vila, Vanuatu, Republic of Vanuatu.
Email: support@tmgm.com
Trademax Global Markets (SE) Limited, работающая под брендом TMGM, уполномочена и регулируется Financial Services Authority (FSA) Сейшельских Островов, номер лицензии SD224. Компания зарегистрирована по адресу: Office No 13, Providence Estate ABIS Centre, Mahe, Seychelles.
Email: support@tmgm.com
Trademax Global Markets (International) Pty Ltd, работающая под брендом TMGM, уполномочена и регулируется Financial Services Commission, Mauritius (FSC), лицензия № GB22201012, и зарегистрирована по адресу: 33, Edith Cavell Street C/o IQ EQ Fund Services (Mauritius) Ltd Port Louis, 11324 Mauritius.
Email: support@tmgm.com
Авторское право © TMGM. Все права защищены