

Торговля
Изучите широкий спектр рынков с конкурентными ценами, высокой ликвидностью и передовыми торговыми инструментами.
Узнать больше 
Платформа
Торгуйте без сбоев на мощной платформе TMGM, созданной для скорости, точности и превосходного торгового опыта.
Узнать больше Торговая платформа
Торговые инструменты
Академия
Изучите основы торговли с помощью материалов для начинающих, включая руководства, вебинары и аналитические обзоры рынка.
Узнать больше Новости и аналитика
Получайте актуальные рыночные обновления и экспертную аналитику, чтобы быть на шаг впереди торговых возможностей
Узнать больше Новости и аналитика
О нас
Узнайте, что отличает TMGM — наше глобальное присутствие, надежное регулирование и приверженность инновациям в трейдинге.
Узнать больше Почему выбирают TMGM
Спонсорство
USD/JPY Price Forecast: Remains close to 20-day EMA
- USD/JPY declines to near 157.90 as the US Dollar continues to underperform.
- The victory of US Democrats in midterm elections has jeopardized the continuations Republicans’ policies.
- Investors are confident that the Fed will hike interest rates in the December policy meeting.
The Japanese Yen (JPY) trades higher against the US Dollar (USD) on Thursday. In the European trade, the USD/JPY pair is down 0.3% to near 157.90. The pair faces selling pressure as the US Dollar underperforms due to fears that United States (US) Republicans would struggle to continue their policies after a setback in midterm elections against Democrats.

US Dollar Price Today
The table below shows the percentage change of US Dollar (USD) against listed major currencies today. US Dollar was the weakest against the New Zealand Dollar.
| USD | EUR | GBP | JPY | CAD | AUD | NZD | CHF | |
|---|---|---|---|---|---|---|---|---|
| USD | -0.29% | -0.16% | -0.32% | -0.12% | -0.17% | -0.41% | -0.33% | |
| EUR | 0.29% | 0.13% | -0.05% | 0.16% | 0.12% | -0.14% | -0.06% | |
| GBP | 0.16% | -0.13% | -0.17% | 0.03% | -0.01% | -0.25% | -0.19% | |
| JPY | 0.32% | 0.05% | 0.17% | 0.21% | 0.17% | -0.10% | -0.01% | |
| CAD | 0.12% | -0.16% | -0.03% | -0.21% | -0.04% | -0.30% | -0.22% | |
| AUD | 0.17% | -0.12% | 0.01% | -0.17% | 0.04% | -0.23% | -0.17% | |
| NZD | 0.41% | 0.14% | 0.25% | 0.10% | 0.30% | 0.23% | 0.10% | |
| CHF | 0.33% | 0.06% | 0.19% | 0.01% | 0.22% | 0.17% | -0.10% |
The heat map shows percentage changes of major currencies against each other. The base currency is picked from the left column, while the quote currency is picked from the top row. For example, if you pick the US Dollar from the left column and move along the horizontal line to the Japanese Yen, the percentage change displayed in the box will represent USD (base)/JPY (quote).
As of writing, the US Dollar Index (DXY), which gauges the Greenback’s value against six major currencies, is down 0.25% to near 101.24. The DXY is close to its monthly low of 101.10 posted the previous day.
Analysts at ING said Democrats sweep would likely “lead to gridlock on the debt ceiling, a prolonged government shutdown next year”, ING said. The bank further warned that “fears of tougher regulation could weigh on Artificial Intelligence (AI) stocks (we’ve recently seen how that can hit the greenback)”.
On the economic front, investors shift their focus to the US Nonfarm Payrolls (NFP) data for October, which will be released on Friday. The NFP data is expected to have a significant impact on Federal Reserve’s (Fed) monetary policy expectations.
USD/JPY Technical Analysis
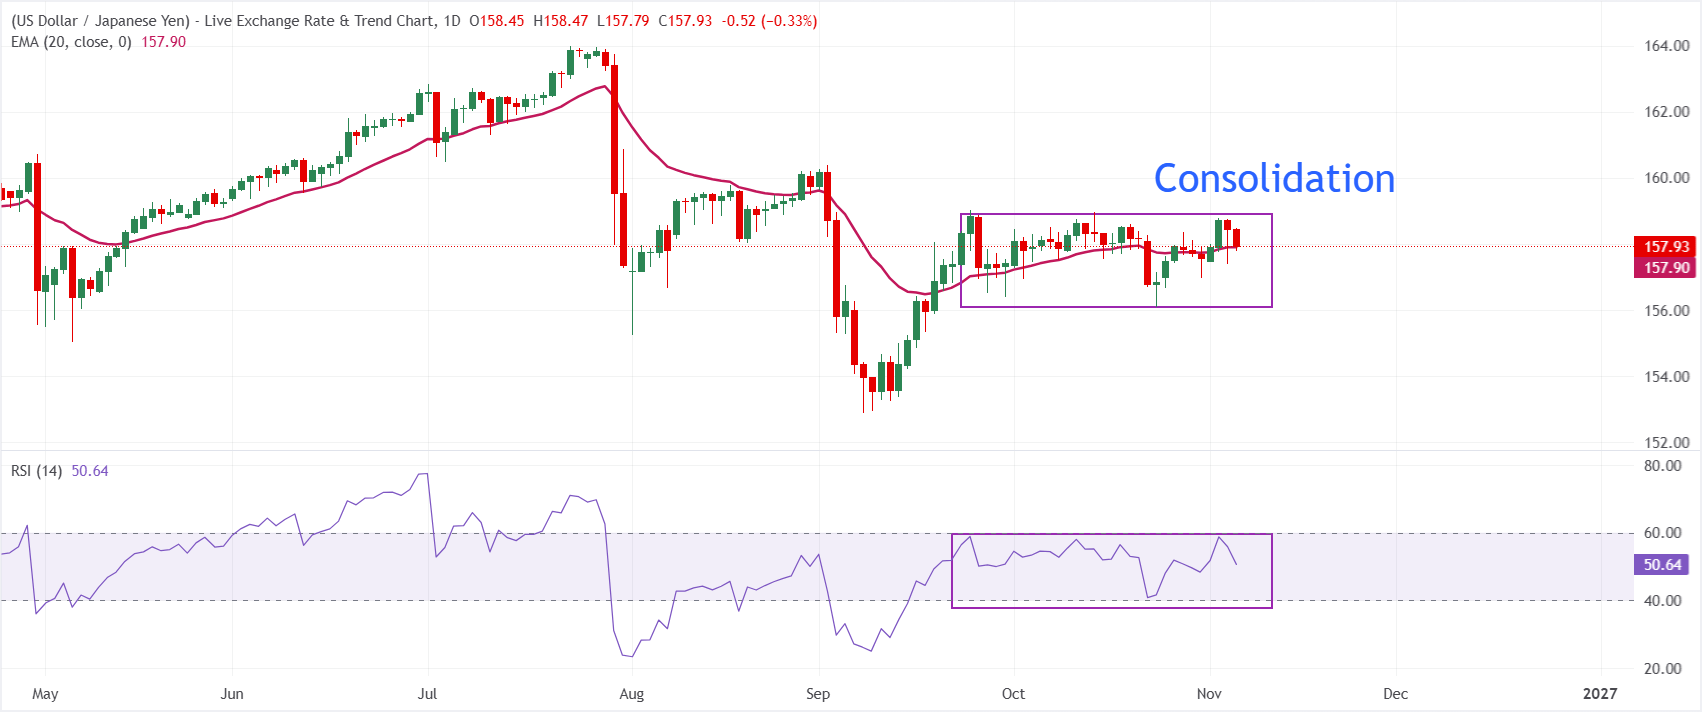
In the daily chart, USD/JPY trades at 157.93. The pair is hovering around the 20-day exponential moving average (EMA) at 157.90, leaving the near-term bias broadly neutral.
The Relative Strength Index (RSI) at 50.66 sits near the midline, hinting at a lack of directional conviction after recent swings, with neither bulls nor bears in clear control for now.
On the downside, initial support is seen at the 20-day EMA near 157.90, a break of which would expose further weakness toward recent lows if selling pressure accelerates. On the topside, with no nearby technical resistance levels from the provided dataset, traders may look to psychological round numbers and prior swing highs beyond the current price as the next areas where upside attempts could start to encounter supply.
(The technical analysis of this story was written with the help of an AI tool. Know more.)
Economic Indicator
Nonfarm Payrolls
The Nonfarm Payrolls release presents the number of new jobs created in the US during the previous month in all non-agricultural businesses; it is released by the US Bureau of Labor Statistics (BLS). The monthly changes in payrolls can be extremely volatile. The number is also subject to strong reviews, which can also trigger volatility in the Forex board. Generally speaking, a high reading is seen as bullish for the US Dollar (USD), while a low reading is seen as bearish, although previous months' reviews and the Unemployment Rate are as relevant as the headline figure. The market's reaction, therefore, depends on how the market assesses all the data contained in the BLS report as a whole.
Read more.Next release: Fri Nov 06, 2026 13:30
Frequency: Monthly
Consensus: 65K
Previous: 29K
Source: US Bureau of Labor Statistics
America’s monthly jobs report is considered the most important economic indicator for forex traders. Released on the first Friday following the reported month, the change in the number of positions is closely correlated with the overall performance of the economy and is monitored by policymakers. Full employment is one of the Federal Reserve’s mandates and it considers developments in the labor market when setting its policies, thus impacting currencies. Despite several leading indicators shaping estimates, Nonfarm Payrolls tend to surprise markets and trigger substantial volatility. Actual figures beating the consensus tend to be USD bullish.
Лучшие статьи
1US Dollar: Lower yields pressure USD after Democratic sweep – Danske Bank2Polygon Labs considers a hard fork to recover assets from Polymarket and Binance hacks34.4%: Germany’s Factory Orders rise in September, missed 4.8% estimates4BoE expected to hike interest rate to 4.00% 5USD/JPY Price Forecast: Remains close to 20-day EMA6Euro: Positive outlook hinges on 1.1280 against US Dollar - UOB7WTI slumps below $86.50 as midterm elections fuel hope for an end to Iran war8Indonesian Rupiah gains as Q3 GDP beats expectations9Swiss Franc strengthens on weaker US Dollar, inflationary pressure


Начать!
Зарегистрируйтесь и получите доступ к глобальным рынкам менее чем за 3 минуты

Свяжитесь с нами









Контакты
Телефон: +61 2 8036 8388
Факс: +61 2 8036 8388
Эл. почта: support@tmgm.com
Веб-сайт: https://www.tmgmasia.com



Информация, представленная на этом веб-сайте, носит исключительно общий характер и не является персональной финансовой консультацией. Прежде чем действовать на основании любой информации на этом веб-сайте, вам следует оценить ее уместность с учетом ваших целей, финансового положения и потребностей. Инвестирование в CFD и маржинальные контракты на FX сопряжено со значительными рисками и подходит не всем инвесторам. Вы можете потерять больше, чем ваш первоначальный депозит. Вы не владеете базовым активом и не имеете в нем какой-либо доли. Мы рекомендуем вам обратиться за независимой консультацией и убедиться, что вы полностью понимаете связанные с этим риски, прежде чем начинать торговлю. Важно прочитать и принять во внимание документ с раскрытием информации, прежде чем приобретать любой продукт, указанный на веб-сайте. Информация и рекламные материалы, предлагаемые на этом веб-сайте, не предназначены для использования любым лицом в любой стране или юрисдикции, где такое использование противоречило бы местным законам и нормативным актам. Продукты и услуги, предлагаемые на этом веб-сайте, не предназначены для резидентов США, Малайзии и Таиланда.
TMGM уполномочена и регулируется в различных юрисдикциях.
Trademax Australia Limited, работающая под брендом TMGM, регулируется Australian Securities and Investments Commission (ASIC), AFSL № 436416 и находится по адресу: Level 28, One International Tower, 100 Barangaroo Avenue, 2000 Sydney, NSW Australia.
Email: support@tmgm.com.au
Trademax Global Limited, работающая под брендом TMGM, уполномочена и регулируется Vanuatu Financial Services Commission (VFSC), регистрационный номер 40356, и зарегистрирована по адресу: 1276, Kumul Highway, Port Vila, Vanuatu, Republic of Vanuatu.
Email: support@tmgm.com
Trademax Global Markets (SE) Limited, работающая под брендом TMGM, уполномочена и регулируется Financial Services Authority (FSA) Сейшельских Островов, номер лицензии SD224. Компания зарегистрирована по адресу: Office No 13, Providence Estate ABIS Centre, Mahe, Seychelles.
Email: support@tmgm.com
Trademax Global Markets (International) Pty Ltd, работающая под брендом TMGM, уполномочена и регулируется Financial Services Commission, Mauritius (FSC), лицензия № GB22201012, и зарегистрирована по адресу: 33, Edith Cavell Street C/o IQ EQ Fund Services (Mauritius) Ltd Port Louis, 11324 Mauritius.
Email: support@tmgm.com
Авторское право © TMGM. Все права защищены