

Savdo
Raqobatbardosh narxlar, chuqur likvidlik va ilg‘or savdo vositalari bilan keng turdagi bozorlarni kashf eting.
Batafsil ma’lumot 
Platforma
TMGM’ning tezlik, aniqlik va yuqori savdo tajribasi uchun yaratilgan kuchli platformasi bilan uzluksiz savdo qiling.
Batafsil ma’lumot Savdo platformasi
Savdo vositalari
Akademiya
Boshlovchilar uchun qulay resurslar, jumladan qo‘llanmalar, vebinarlar va bozor tahlillari orqali savdoning asoslarini o‘rganing.
Batafsil ma’lumot Yangiliklar va tahlil
Savdo imkoniyatlaridan oldinda bo‘lish uchun bozor yangilanishlari va ekspert tahlillarini real vaqt rejimida oling
Batafsil ma’lumot Yangiliklar va tahlil
Haqida
TMGMni boshqalardan ajratib turadigan jihatlarni bilib oling — bizning global mavjudligimiz, tartibga solishdagi mustahkamligimiz va savdoda innovatsiyalarga sodiqligimiz.
Batafsil ma’lumot Nega TMGMni tanlash kerak
USD/JPY Price Forecast: Bullish pin bar faces 200-day SMA wall
- USD/JPY forms potential bullish pin bar below 200-day SMA resistance.
- RSI remains bullish but turns lower, signaling fading buying momentum.
- Break above 159.00 exposes 159.16, while losing 157.39 threatens 156.08.
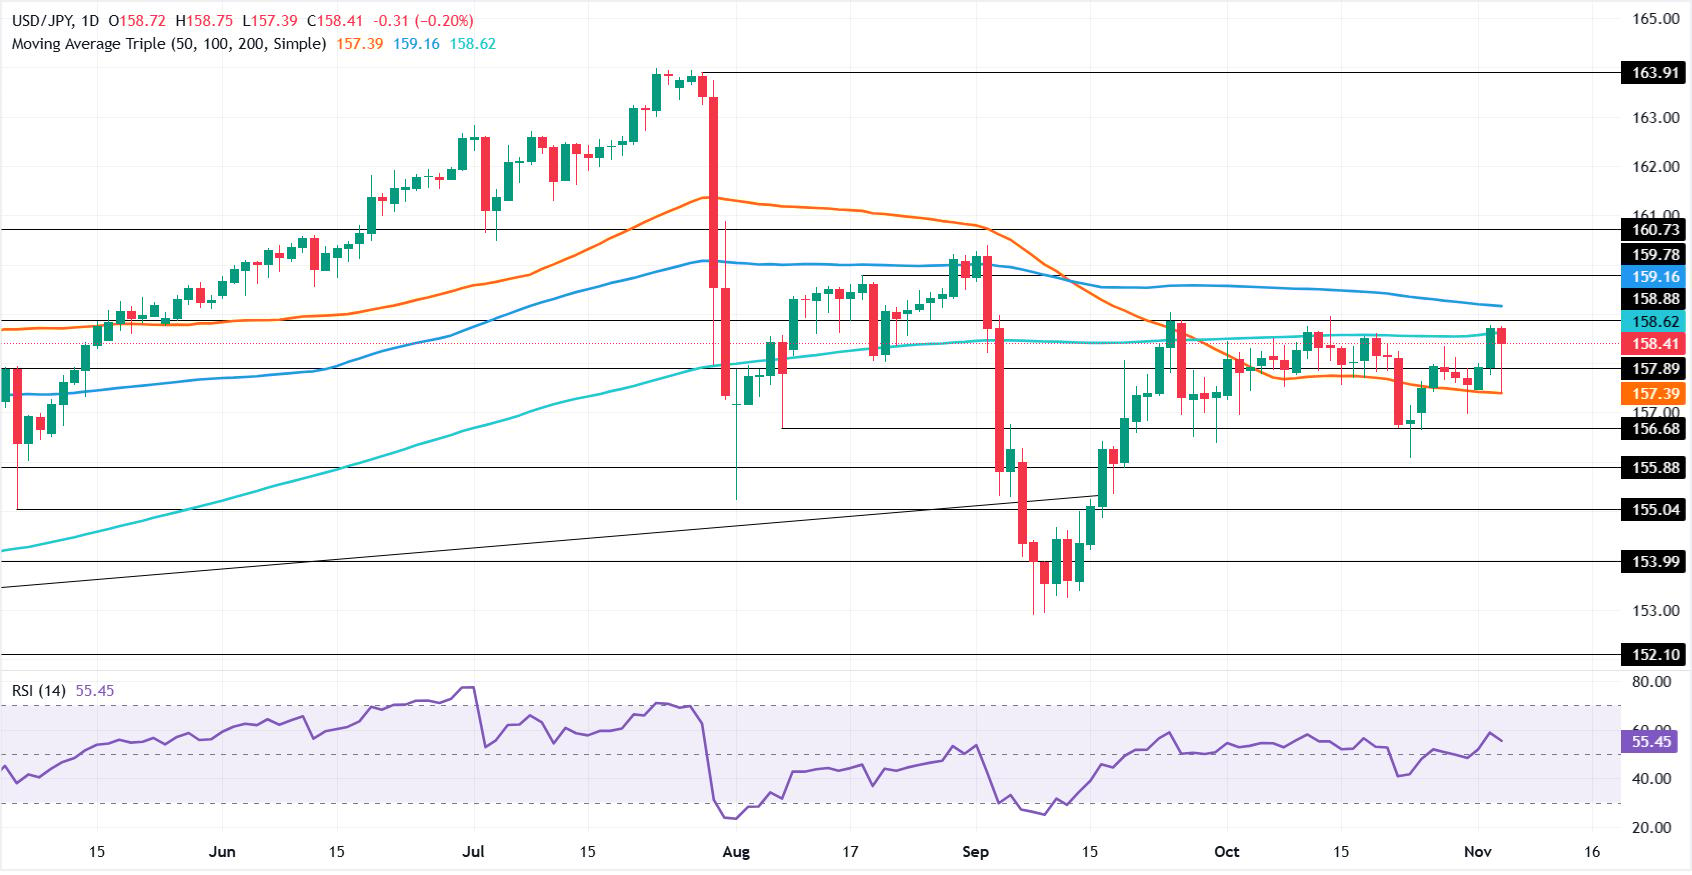
The USD/JPY edges lower but trims some of its earlier losses, down 0.20% in the aftermath of the US midterm election results. However, the pair seems to form a tilted bullish ‘pin bar ’, yet it remains consolidated within the 50- and 200-day SMAs, each at 157.39 and 158.62. At the time of writing, the pair trades at 158.41.

USD/JPY Price Forecast: Technical outlook
The USD/JPY remains subdued, with no clear bias. The market structure of lower highs and lower lows remains intact, but if buyers reclaim 159.00, a move to the 100-day SMA at 159.16 is on the cards, with buyers eyeing a test of 160.00.
From a momentum standpoint, that move seems remote. The Relative Strength Index (RSI), although bullish, is aiming downwards. Still, if USD/JPY clears 160.00, buyers could negate the bearish market structure on a breakout of the September 2 high of 160.39.
On the other hand, for a bearish continuation, sellers must drag the USD/JPY below 158.00 and clear the 50-day SMA at 157.39. A breach of the latter will expose 157.00, with sellers setting their sights on the October 23 low of the day (LOD) at 156.08.
USD/JPY Price Chart – Daily
Japanese Yen Price Today
The table below shows the percentage change of Japanese Yen (JPY) against listed major currencies today. Japanese Yen was the strongest against the US Dollar.
| USD | EUR | GBP | JPY | CAD | AUD | NZD | CHF | |
|---|---|---|---|---|---|---|---|---|
| USD | -0.37% | -0.44% | -0.21% | -0.27% | -0.54% | -0.22% | -0.52% | |
| EUR | 0.37% | -0.06% | 0.20% | 0.13% | -0.16% | 0.20% | -0.15% | |
| GBP | 0.44% | 0.06% | 0.23% | 0.17% | -0.10% | 0.23% | -0.09% | |
| JPY | 0.21% | -0.20% | -0.23% | -0.07% | -0.34% | -0.03% | -0.33% | |
| CAD | 0.27% | -0.13% | -0.17% | 0.07% | -0.27% | 0.04% | -0.26% | |
| AUD | 0.54% | 0.16% | 0.10% | 0.34% | 0.27% | 0.32% | 0.02% | |
| NZD | 0.22% | -0.20% | -0.23% | 0.03% | -0.04% | -0.32% | -0.29% | |
| CHF | 0.52% | 0.15% | 0.09% | 0.33% | 0.26% | -0.02% | 0.29% |
The heat map shows percentage changes of major currencies against each other. The base currency is picked from the left column, while the quote currency is picked from the top row. For example, if you pick the Japanese Yen from the left column and move along the horizontal line to the US Dollar, the percentage change displayed in the box will represent JPY (base)/USD (quote).
Eng yaxshi maqolalar
1SNB’s Schlegel says will not hesitate to modify policy if price stability is endangered2Gold surges above $4,050 as Democrats take control of Congress3USD/JPY Price Forecast: Bullish pin bar faces 200-day SMA wall4Aussie Dollar reclaims 0.7000 as blue wave sweep tumbles the US Dollar5Hong Kong: Growth outlook improves – UOB6Mexican Peso climbs on Democratic sweep ahead of Banxico call7Chinese Yuan: PBoC slows Yuan gains – MUFG8Circle reserve income falls 8% as ARC presale lifts Q3 revenue9Singapore Dollar: Holds tight range as PMI supports growth – Commerzbank

Boshlang!
Ro‘yxatdan o‘ting va 3 daqiqadan kamroq vaqt ichida Global bozorlariga kirish imkoniga ega bo‘ling

Biz bilan bog‘laning









Kontaktlar
Telefon: +61 2 8036 8388
Faks: +61 2 8036 8388
Email: support@tmgm.com



Ushbu veb-saytda taqdim etilgan ma’lumotlar faqat umumiy xususiyatga ega bo‘lib, shaxsiy moliyaviy maslahat hisoblanmaydi. Ushbu veb-saytdagi har qanday ma’lumot asosida harakat qilishdan oldin, ma’lumotning sizning maqsadlaringiz, moliyaviy ahvolingiz va ehtiyojlaringizga mosligini ko‘rib chiqishingiz kerak. CFD va FX Margin shartnomalariga sarmoya kiritish sezilarli xavflarni o‘z ichiga oladi va barcha investorlar uchun mos emas. Siz boshlang‘ich depozitingizdan ko‘proq yo‘qotishingiz mumkin. Siz asosiy aktivga egalik qilmaysiz va unda hech qanday manfaatga ega emassiz. Savdo qilishdan oldin mustaqil maslahat olishni va ishtirok etuvchi xavflarni to‘liq tushunishingizni tavsiya qilamiz. Veb-saytda keltirilgan har qanday mahsulotni xarid qilishdan oldin oshkor qilish hujjatini o‘qib chiqishingiz va ko‘rib chiqishingiz muhimdir. Ushbu veb-saytda taklif etilgan ma’lumotlar va reklama materiallari bunday foydalanish mahalliy qonunlar va qoidalarga zid bo‘ladigan har qanday mamlakat yoki yurisdiksiyadagi shaxslar tomonidan foydalanish uchun mo‘ljallanmagan. Ushbu veb-saytda taklif etilgan Mahsulotlar va Xizmatlar AQSh, Malayziya va Tailand rezidentlari uchun mo‘ljallanmagan.
TMGM turli yurisdiksiyalarda vakolatli va tartibga solinadi.
Trademax Australia Limited, TMGM nomi ostida faoliyat yuritadi, Avstraliya Qimmatli qog‘ozlar va investitsiyalar komissiyasi (ASIC) tomonidan tartibga solinadi, AFSL raqami 436416 va manzili: Level 28, One International Tower, 100 Barangaroo Avenue, 2000 Sydney, NSW Australia.
Email: support@tmgm.com.au
Trademax Global Limited, TMGM nomi ostida faoliyat yuritadi, Vanuatu Moliyaviy Xizmatlar Komissiyasi (VFSC) tomonidan vakolatli va tartibga solinadi, ro‘yxatga olish raqami 40356 va ro‘yxatdan o‘tgan manzili: 1276, Kumul Highway, Port Vila, Vanuatu, Vanuatu Respublikasi.
Email: support@tmgm.com
Trademax Global Markets (SE) Limited, TMGM nomi ostida faoliyat yuritadi, Seyshel orollari Moliyaviy Xizmatlar Boshqarmasi (FSA) tomonidan 224-sonli SD litsenziyasi bilan vakolatli va tartibga solinadi. Kompaniya Office No 13, Providence Estate ABIS Centre, Mahe, Seychelles manzilida ro‘yxatdan o‘tgan.
Email: support@tmgm.com
Trademax Global Markets (International) Pty Ltd, TMGM nomi ostida faoliyat yuritadi, Mauritius Moliyaviy Xizmatlar Komissiyasi (FSC) tomonidan GB22201012 litsenziya raqami bilan vakolatli va tartibga solinadi hamda 33, Edith Cavell Street C/o IQ EQ Fund Services (Mauritius) Ltd Port Louis, 11324 Mauritius manzilida ro‘yxatdan o‘tgan.
Email: support@tmgm.com
Mualliflik huquqi © TMGM. Barcha huquqlar himoyalangan