

Trading
Explore a wide range of markets with competitive pricing, deep liquidity, and advanced trading tools.
Learn More 
Platform
Trade seamlessly with TMGM's powerful platform, built for speed, precision, and a superior trading experience.
Learn More Trading Platform
Academy
Learn the fundamentals of trading with beginner-friendly resources, including guides, webinars, and market insights.
Learn More News & Analysis
Get real-time market updates and expert analysis to stay ahead of trading opportunities
Learn More News & Analysis
About
Learn what sets TMGM apart — our global presence, regulatory strength, and commitment to innovation in trading.
Learn More Why Choose TMGM
Sponsorship
Five consecutive weekly losses: EUR/GBP remains in a narrow range | Price Forecast
- EUR/GBP holds steady as the BoE's hawkish rate increase fails to give the Pound sustained support.
- Trading below key daily SMAs leaves the cross's wider bearish outlook unchanged.
- An elevated ADX indicates a strong downtrend, although RSI readings show oversold conditions.
EUR/GBP is trading around 0.8339 at the time of writing. The cross is little changed on Friday, close to levels last recorded in April 2025 and confined to this week's narrow range. After five consecutive weekly declines drove the pair into oversold territory, the muted trading suggests sellers are pausing.

A 25 basis point increase took the Bank of England’s (BoE) interest rate to 4% on Thursday. Markets barely responded, despite policymakers indicating that additional increases may be necessary to curb inflation. Meanwhile, worries about France’s fiscal outlook continue to support the Pound relative to the Euro (EUR).
BoE hawkishness fails to sustain Pound gains
The limited support for sterling was highlighted by Commerzbank analysts: “despite this rather hawkish decision, the Pound only benefited briefly and had to give up its gains as the day progressed.” While accepting that “at first glance, this may seem confusing,” they explain that “expectations ahead of the meeting were quite ambitious, with almost three further rate rises priced in by the middle of next year.” Markets also lacked a clearer policy path because Governor Andrew Bailey “gave no indication of the timetable following the next rate rise,” constraining their ability to price it in.
Commerzbank's assessment remains unchanged against this backdrop: “we remain firmly of the view that the BoE will not deliver a second interest rate rise until February rather than in December, as this would contradict its cautious approach to date.” The analysts also argue that “if the situation in the Middle East has stabilised by then and energy exports have normalised, the case for further interest rate hikes will be weaker.” Their conclusion is that “until then, the Pound is likely to struggle to trade any higher.”
EUR/GBP technical outlook
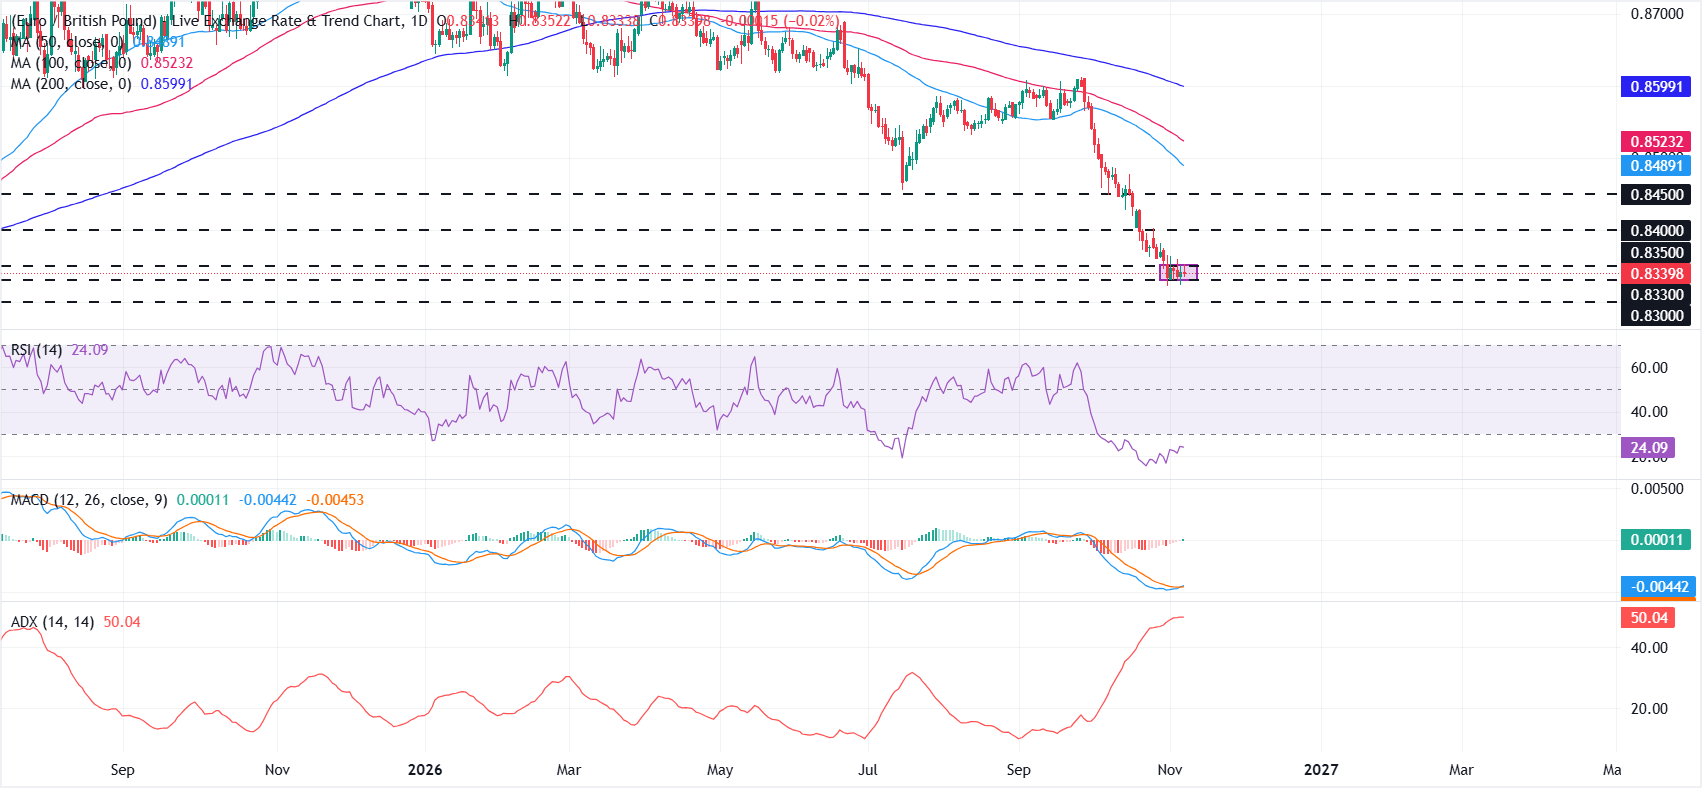
Trading beneath the 50-, 100- and 200-day Simple Moving Averages (SMAs) leaves EUR/GBP with a bearish short-term outlook on the daily chart. These averages are grouped between approximately 0.8489 and 0.8599.
At around 24, the Relative Strength Index (RSI) indicates oversold conditions. The Moving Average Convergence Divergence (MACD) has edged just above zero but retains a very shallow profile, suggesting selling momentum remains strong without accelerating. This is consistent with the elevated Average Directional Index near 50, which indicates a mature downtrend.
A recovery would first encounter resistance at 0.8350, then at 0.8400 and 0.8450. Further obstacles are the 50-day SMA at 0.8489, followed by the 100-day SMA at 0.8523 and the 200-day SMA at 0.8599.
The recent low around 0.8330 provides immediate support. Should selling pressure return and extend the decline, the next horizontal level to watch is 0.8300.
(The technical analysis of this story was written with the help of an AI tool. Know more.)
Pound Sterling: Today's Currency Performance
The British Pound (GBP) recorded its strongest performance against the New Zealand Dollar today. The table below details its percentage changes against the major currencies listed.
| USD | EUR | GBP | JPY | CAD | AUD | NZD | CHF | |
|---|---|---|---|---|---|---|---|---|
| USD | 0.40% | 0.36% | 0.33% | 0.30% | 0.77% | 0.84% | 0.13% | |
| EUR | -0.40% | -0.04% | -0.07% | -0.08% | 0.38% | 0.44% | -0.26% | |
| GBP | -0.36% | 0.04% | -0.02% | -0.05% | 0.42% | 0.47% | -0.23% | |
| JPY | -0.33% | 0.07% | 0.02% | -0.01% | 0.44% | 0.51% | -0.19% | |
| CAD | -0.30% | 0.08% | 0.05% | 0.00% | 0.46% | 0.52% | -0.18% | |
| AUD | -0.77% | -0.38% | -0.42% | -0.44% | -0.46% | 0.06% | -0.64% | |
| NZD | -0.84% | -0.44% | -0.47% | -0.51% | -0.52% | -0.06% | -0.69% | |
| CHF | -0.13% | 0.26% | 0.23% | 0.19% | 0.18% | 0.64% | 0.69% |
Percentage movements between major currencies are displayed in the heat map. Select the base currency in the left-hand column and the quote currency in the top row. To read GBP (base)/USD (quote), for instance, find the British Pound on the left and follow that row across to the US Dollar column. The intersecting cell gives the pair's percentage change.
POPULAR ARTICLES
1Banxico rate cut puts Mexican Peso at risk – ING2Risk aversion keeps British Pound under pressure against Japanese Yen3United States U6 Underemployment Rate up to 7.9% in October from previous 7.6%4United States Labor Force Participation Rate up to 61.9% in October from previous 61.8%5United States Average Weekly Hours in line with forecasts (34.4) in October6United States Nonfarm Payrolls above forecasts (65K) in October: Actual (165K)7United States Unemployment Rate below forecasts (4.2%) in October: Actual (4.1%)8United States Average Hourly Earnings (YoY) above forecasts (2.9%) in October: Actual (3.1%)9United States Average Hourly Earnings (MoM) came in at 0.4%, above forecasts (0.3%) in October


Get Started!
Sign up and access the Global Markets in less than 3 minutes

Connect With Us









Contacts
Phone: +61 2 8036 8388
Fax: +61 2 8036 8388
Email: support@tmgm.com



The information provided on this website is of a general nature only and does not constitute personal financial advice. Before acting on any information on this website, you should consider the suitability of the information in relation to your objectives, financial situation and needs. Investing in CFDs and FX Margin Contracts carries significant risks and is not suitable for all investors. You may lose more than your initial deposit. You do not own, or have, any interest in the underlying asset. We recommend that you seek independent advice and ensure you fully understand the risks involved before trading. It is important that you read and consider the disclosure document before you acquire any product listed on the website. The information and advertisements offered on this website are not intended for use by any person in any country or jurisdiction where such use would be contrary to local laws and regulations. The Products and Services offered on this website are not intended for residents of the United States, Malaysia and Thailand.
TMGM is authorized and regulated in various jurisdictions.
Trademax Australia Limited, trading as TMGM, is regulated by the Australian Securities and Investments Commission (ASIC), AFSL no. 436416 and is located at Level 28, One International Tower, 100 Barangaroo Avenue, 2000 Sydney, NSW Australia.
Email: support@tmgm.com.au
Trademax Global Limited, trading as TMGM, is authorized and regulated by the Vanuatu Financial Services Commission (VFSC), registration number 40356 and registered at 1276, Kumul Highway, Port Vila, Vanuatu, Republic of Vanuatu.
Email: support@tmgm.com
Trademax Global Markets (SE) Limited, trading as TMGM, is authorized and regulated by the Financial Services Authority (FSA) of Seychelles, with license number SD224. The company is registered at Office No 13, Providence Estate ABIS Centre, Mahe, Seychelles.
Email: support@tmgm.com
Trademax Global Markets (International) Pty Ltd, trading as TMGM, is authorized and regulated by the Financial Services Commission, Mauritius (FSC) with license no. GB22201012, and registered at 33, Edith Cavell Street C/o IQ EQ Fund Services (Mauritius) Ltd Port Louis, 11324 Mauritius.
Email: support@tmgm.com
Copyright © TMGM. All rights reserved