

Trading
Explore a wide range of markets with competitive pricing, deep liquidity, and advanced trading tools.
Learn More 
Platform
Trade seamlessly with TMGM's powerful platform, built for speed, precision, and a superior trading experience.
Learn More Trading Platform
Academy
Learn the fundamentals of trading with beginner-friendly resources, including guides, webinars, and market insights.
Learn More News & Analysis
Get real-time market updates and expert analysis to stay ahead of trading opportunities
Learn More News & Analysis
About
Learn what sets TMGM apart — our global presence, regulatory strength, and commitment to innovation in trading.
Learn More Why Choose TMGM
Sponsorship
Top 3 Price Forecasts: Bitcoin (BTC) Consolidates While Ethereum (ETH) and Ripple (XRP) Stall
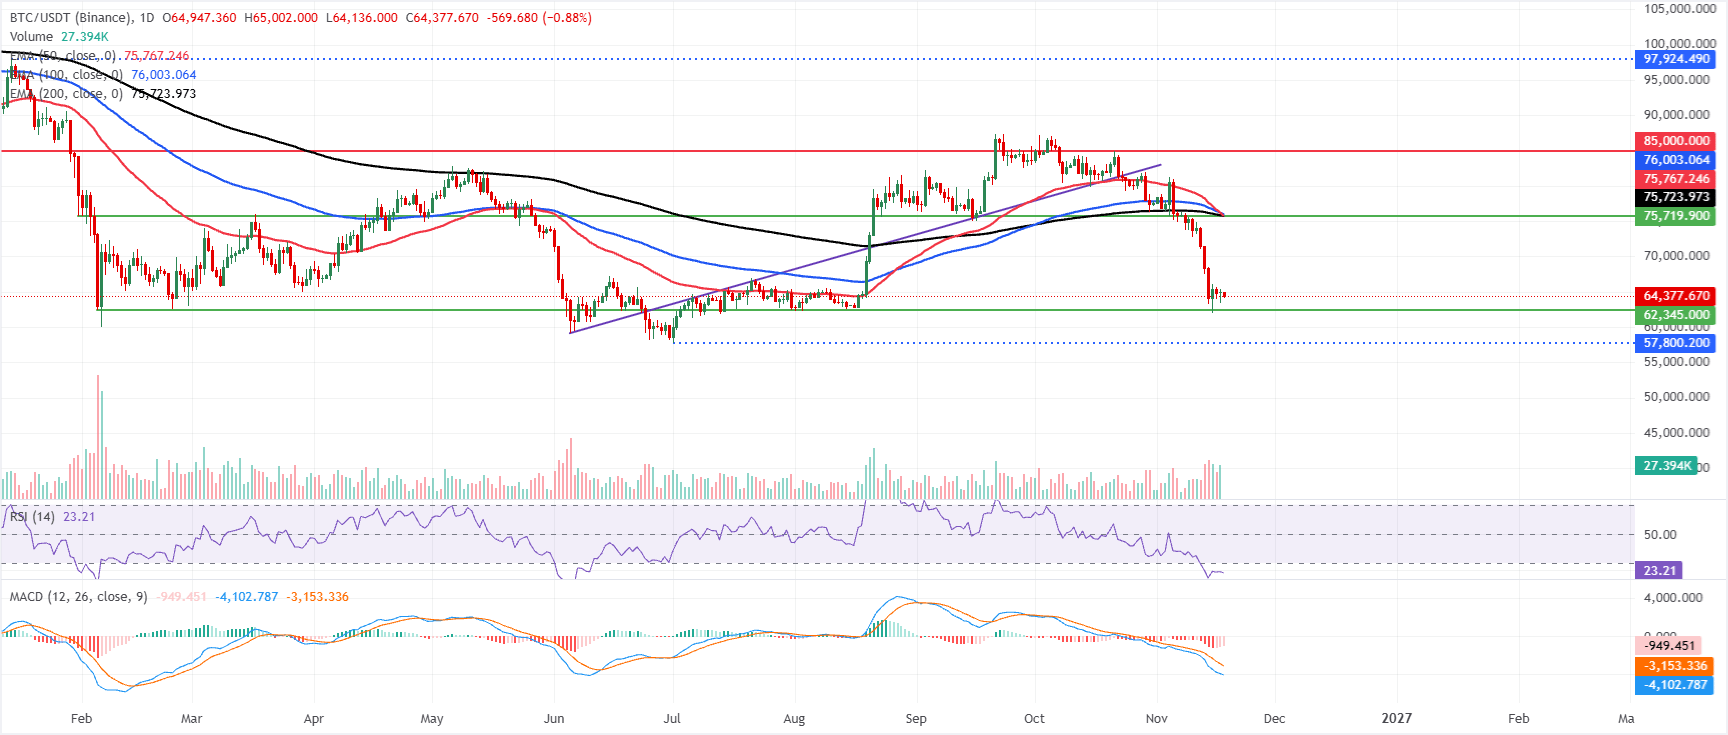
- $65,000 remains above Bitcoin as it consolidates on Wednesday following last week’s steep sell-off.
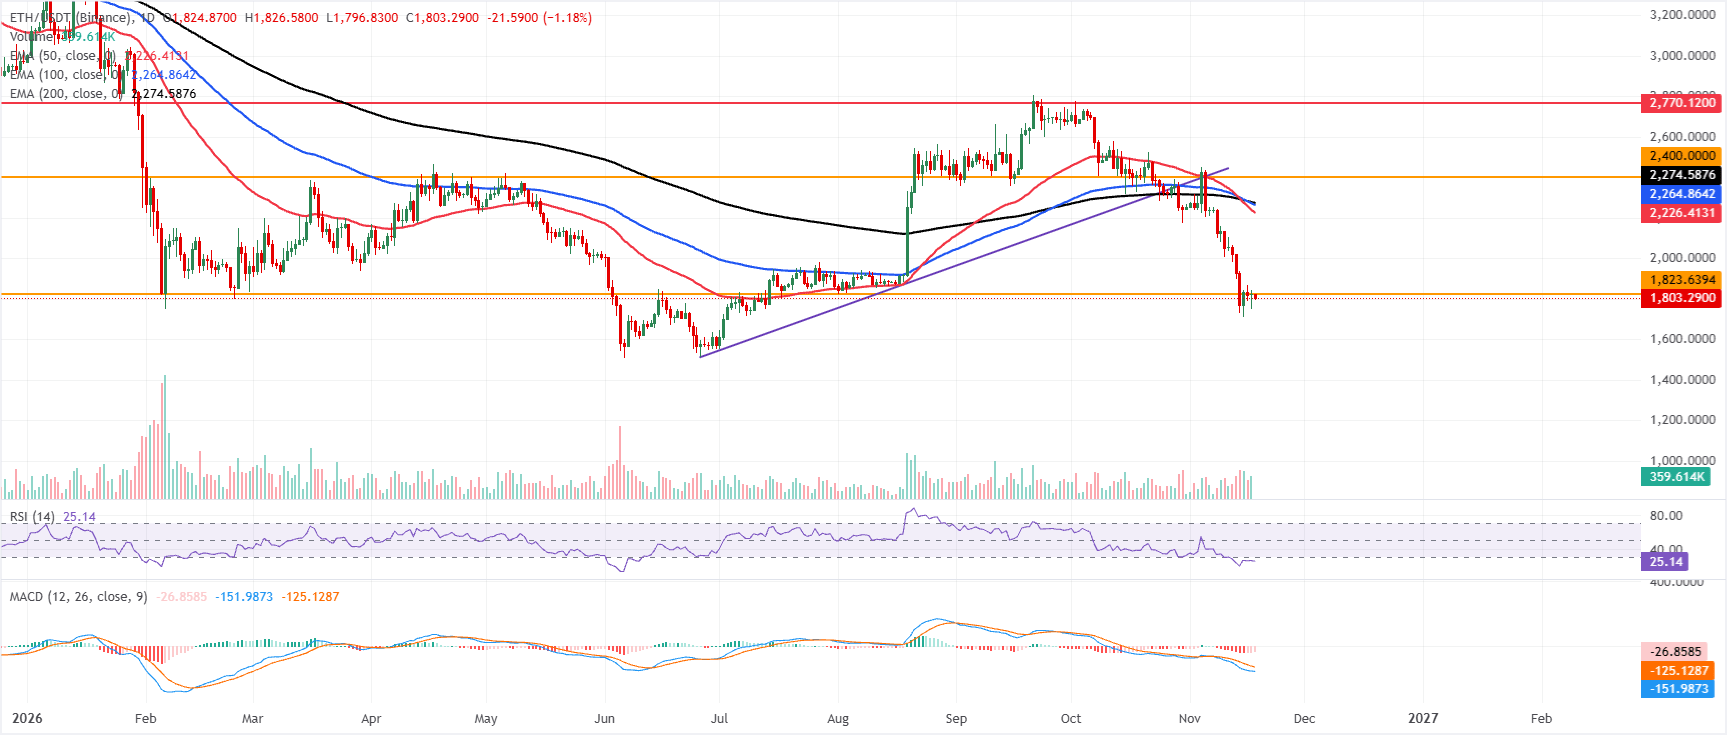
- $1,823 proved a key resistance barrier for Ethereum on the previous day, with the failure to close above it followed by a correction.
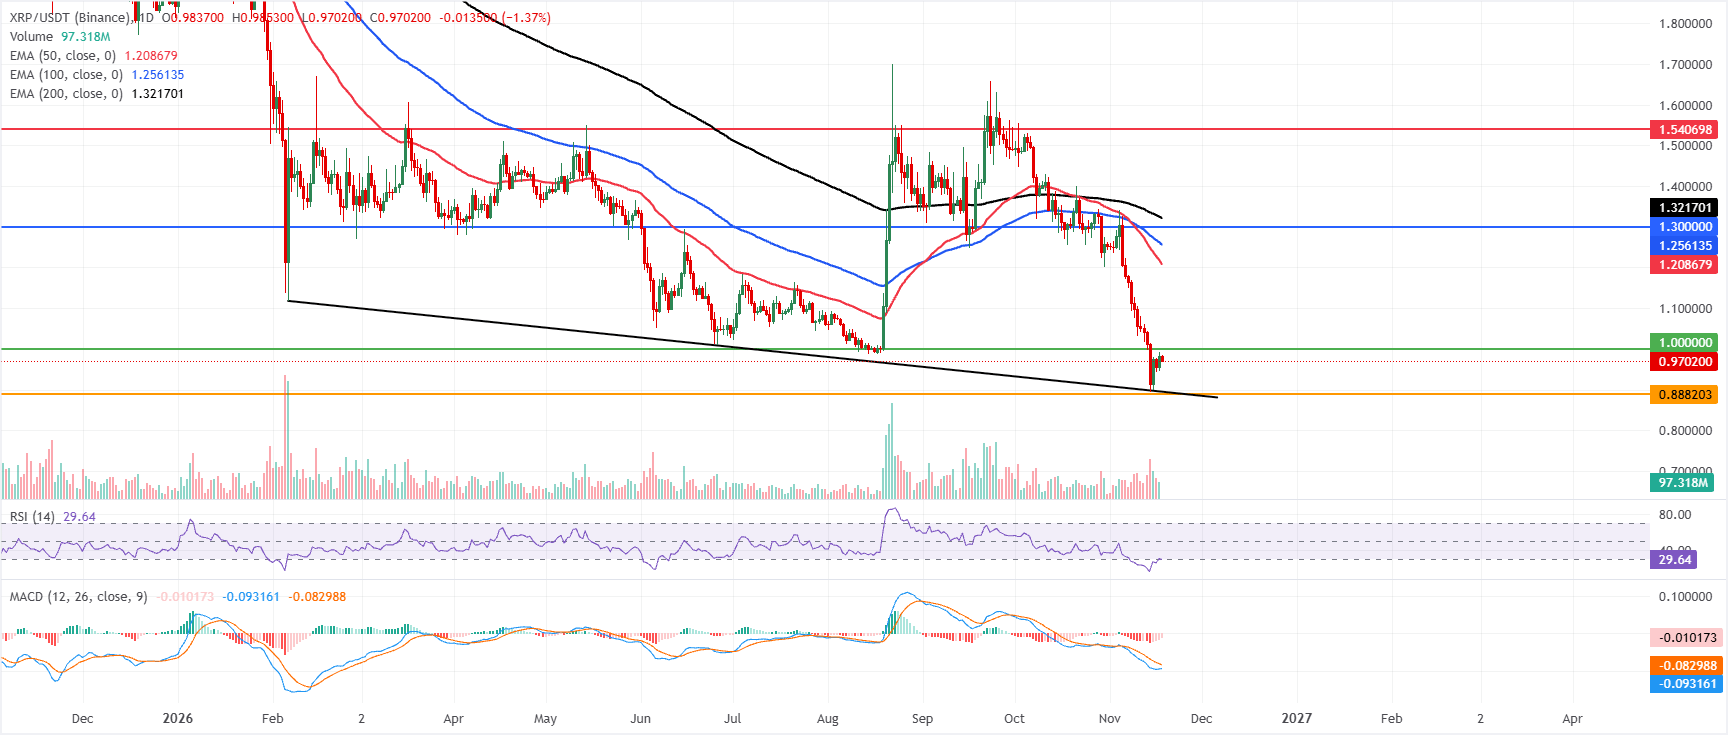
- $0.97 is XRP’s approximate level on Wednesday as it approaches the key psychological threshold near $1.00.
$65,000 remains above Bitcoin (BTC) during Wednesday’s consolidation. Pressure persists after last week’s sharp crash. Ethereum (ETH) and Ripple (XRP) have tracked BTC and remain stuck beneath key resistance levels. Across these top three cryptocurrencies, price action indicates that bears still control the trend. Recovery rallies are therefore likely to be treated as corrections within the prevailing downward phase.

$65,000 Remains Above Bitcoin After Sharp Sell-off
At $64,377 on Wednesday, Bitcoin is consolidating beneath $65,000 following the previous week’s heavy decline. Trading well below its main Exponential Moving Averages (EMAs), BTC retains a bearish short-term bias. The 50-day, 100-day and 200-day EMAs form a cluster roughly between $75,700 and $76,000. Their position far above the spot price points to continued corrective pressure on the market.
A Relative Strength Index (RSI) reading near 23 places the indicator deep in oversold territory, supporting the bearish picture. Meanwhile, the Moving Average Convergence Divergence (MACD) is still depressed and negative. This signals sustained downside pressure even after the sharp retreat.
Any recovery first faces the 200-day EMA at $75,723, then the nearby 50-day EMA at $75,767 and 100-day EMA at $76,003. Together, these averages create a concentrated supply zone likely to constrain short-term rebounds. Should a stronger recovery develop, horizontal resistance at $85,000 presents a more distant obstacle where sellers could regain control.
$1,823 Resistance Holds Against Ethereum’s Closing Attempt
At $1,803 on Wednesday, Ethereum is trading below the key $1,823 resistance level after failing to close above it the day before.
A distinctly bearish bias also persists as ETH trades well beneath its 50-day EMA at $2,226, 100-day EMA at $2,264 and 200-day EMA at $2,274. With this band of averages stacked above the price, the broader trend continues to face downward pressure. Momentum is weak too: the RSI stands in oversold territory at 25, while the MACD remains deeply negative. Short-lived corrective rebounds are still a risk despite these readings.
The horizontal barrier near $1,823 is the first upside hurdle. Further supply is expected around the 50-day EMA at $2,226, before the 100-day EMA at $2,264 and the 200-day EMA at $2,274. Beyond those averages, the $2,400 horizontal level provides a stronger ceiling. Next comes the former uptrend support line, now resistance around $2,493, followed by a higher barrier near $2,770. While ETH remains below this series of resistance levels, rallies are likely to represent corrections within the dominant downward phase.
$1 Psychological Barrier Keeps XRP in Check
At $0.970 on Wednesday, XRP remains in a bearish phase, trading far below the 50-day EMA at $1.208, 100-day EMA at $1.256 and 200-day EMA at $1.321. The averages stacked above spot indicate firm downward pressure. An RSI reading of about 29 points to oversold conditions, which could temper the decline but do not yet signal a reversal. Although the MACD’s bearish slope has moderated somewhat, the indicator remains negative and underlying momentum is still weak.
A recovery would first encounter the psychological $1.000 threshold, followed by the 50-day EMA near $1.208 and the 100-day EMA around $1.256. The horizontal $1.300 level forms a stronger cap. Further up, the 200-day EMA at $1.321 joins earlier chart barriers at $1.540 and $1.900 to establish a broader medium-term supply zone.
The previously plotted horizontal level at $0.888 provides immediate downside support. A decisive break beneath it would leave the pair vulnerable to further technical deterioration. Conversely, remaining above that floor could permit an oversold rebound towards the nearby resistance band.
(The technical analysis of this story was written with the help of an AI tool. Know more.)
FAQs on open interest and funding rates
Rising open interest is linked to greater liquidity and fresh capital entering the market. It is regarded as an improvement in efficiency, with the prevailing trend continuing. By contrast, falling open interest is viewed as evidence of market liquidation: investors are exiting, overall demand for the asset is weakening, and bearish sentiment is building among investors.
By raising the liquidation risks that traders face, funding fees narrow the gap between an asset’s spot price and its futures contract prices. A persistently high, positive funding rate signals bullish sentiment among market participants and expectations of a price increase. Conversely, a consistently negative rate points to bearish sentiment towards the asset. It indicates that traders anticipate a decline in the cryptocurrency’s price and that a bearish trend reversal is likely.
POPULAR ARTICLES
1103.80 remains a hurdle for United States Dollar index rally; FOMC Minutes in focus213-month high expected for UK CPI inflation as fuel costs climb3Top 3 Price Forecasts: Bitcoin (BTC) Consolidates While Ethereum (ETH) and Ripple (XRP) Stall40.6750 gives way as Australian Dollar retreats on hawkish Fed; traders await FOMC Minutes5Breaking: Below $3,800, Gold sinks to lowest since September 2025 as hawkish Fed and strong USD weigh60.5500 area: New Zealand Dollar struggles as dovish RBNZ and firm USD limit gains7Hawkish Fed tone boosts US Dollar as Canadian Dollar weakens81.3200: British Pound slips against bullish USD as traders await UK CPI report92%: BoJ’s Ueda says keeping inflation near this level is crucial


Get Started!
Sign up and access the Global Markets in less than 3 minutes

Connect With Us









Contacts
Phone: +61 2 8036 8388
Fax: +61 2 8036 8388
Email: support@tmgm.com



The information provided on this website is of a general nature only and does not constitute personal financial advice. Before acting on any information on this website, you should consider the suitability of the information in relation to your objectives, financial situation and needs. Investing in CFDs and FX Margin Contracts carries significant risks and is not suitable for all investors. You may lose more than your initial deposit. You do not own, or have, any interest in the underlying asset. We recommend that you seek independent advice and ensure you fully understand the risks involved before trading. It is important that you read and consider the disclosure document before you acquire any product listed on the website. The information and advertisements offered on this website are not intended for use by any person in any country or jurisdiction where such use would be contrary to local laws and regulations. The Products and Services offered on this website are not intended for residents of the United States, Malaysia and Thailand.
TMGM is authorized and regulated in various jurisdictions.
Trademax Australia Limited, trading as TMGM, is regulated by the Australian Securities and Investments Commission (ASIC), AFSL no. 436416 and is located at Level 28, One International Tower, 100 Barangaroo Avenue, 2000 Sydney, NSW Australia.
Email: support@tmgm.com.au
Trademax Global Limited, trading as TMGM, is authorized and regulated by the Vanuatu Financial Services Commission (VFSC), registration number 40356 and registered at 1276, Kumul Highway, Port Vila, Vanuatu, Republic of Vanuatu.
Email: support@tmgm.com
Trademax Global Markets (SE) Limited, trading as TMGM, is authorized and regulated by the Financial Services Authority (FSA) of Seychelles, with license number SD224. The company is registered at Office No 13, Providence Estate ABIS Centre, Mahe, Seychelles.
Email: support@tmgm.com
Trademax Global Markets (International) Pty Ltd, trading as TMGM, is authorized and regulated by the Financial Services Commission, Mauritius (FSC) with license no. GB22201012, and registered at 33, Edith Cavell Street C/o IQ EQ Fund Services (Mauritius) Ltd Port Louis, 11324 Mauritius.
Email: support@tmgm.com
Copyright © TMGM. All rights reserved