
News & AnalysisCareer

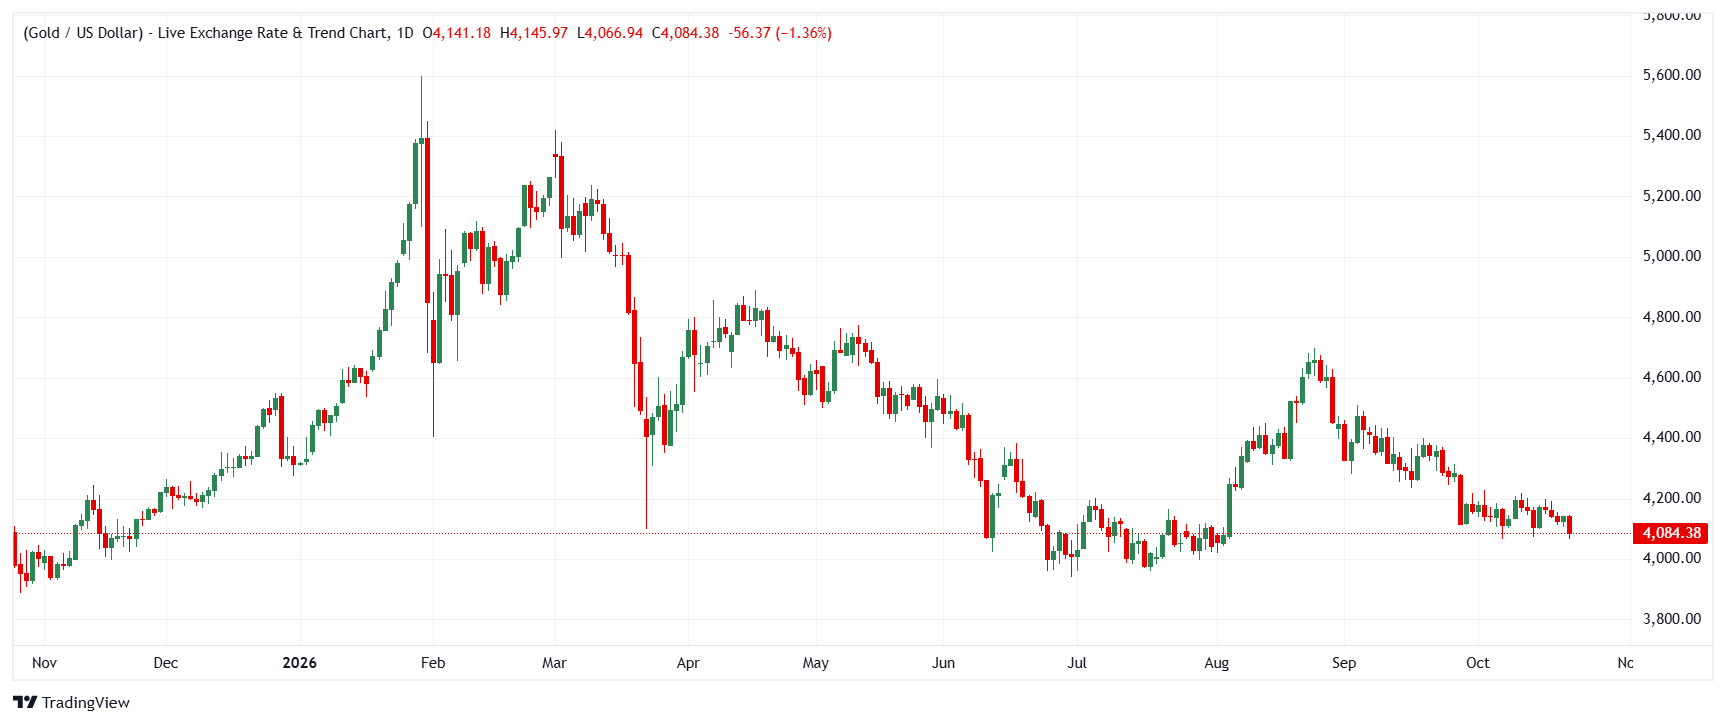
Gold (XAU/USD) at close to $4,100 is dividing the three latest analyses. For one analyst, the rebound from support signals scope for a move towards $4,227; for another, rallies remain exposed as long as prices stay below the 20-day EMA. The third sees India's Diwali buying season as the approaching test of physical demand.
A failed break below the current cycle’s 1 (100%) Support Arc underpins Gharib’s bullish reading of Gold, based on Arc Cycle Analysis of the 4h chart. As he puts it: "The rebound confirms a bullish reaction and opens the potential for continued movement higher, toward 4,227," although he sets a clear condition: "a sustained 4h close below 4,105 would invalidate the bullish scenario and could reopen the path toward the next Support Arc." That threshold is already under scrutiny, with the spot price cited by the other analysts having fallen to $4,095. — Read the complete analysis

Inflation and monetary policy drive the bearish assessment from Dua, who reports: "Gold is down 1% to near $4,095 in the Asian trading session on Thursday on the back of fears that global inflation expectations could accelerate further due to heightened geopolitical tensions in the Middle East." Of the three analysts, his view is the most negative. Greater inflationary pressure, he argues, steers central banks towards tighter monetary policy, which "bodes poorly for non-yielding assets, such as Gold," while the Fed is expected to leave rates within the 3.75%-4.00% range next Wednesday. Its guidance, rather than necessarily the rate decision, is the principal catalyst. The technical picture also favours the downside: XAU/USD remains beneath its 20-day EMA, at approximately $4,172, while the RSI is near 40 in negative territory. Easing that downward bias would require a daily close above the EMA. — Read the complete analysis
Physical demand takes centre stage in Bina’s analysis. According to the WGC, India represented 27% of worldwide jewellery demand and 16% of global bar and coin demand in the second quarter. With Dhanteras falling on 6 November and Diwali on 8 November, he notes that "festival buying is a visible input to the physical market behind XAU/USD". Several obstacles mark the start of the 2026 season: a 15% import duty introduced in mid-May, the largest increase on record; a softer rupee; and a shift in demand away from jewellery towards bullion. First-half purchases of bars and coins totalled about 113 tonnes, a 13-year high. There is already an encouraging indication of buying in response to lower prices. As Reuters reported in the piece, dealers shifted from discounts of up to $6 an ounce to premiums of up to $7 in mid-October as the price retreat encouraged purchases. This was the first premium in more than three months. Through the festival period, Bina is monitoring whether that premium persists after Diwali, alongside October’s import figures and the rupee’s influence. — Read the complete analysis
With prices now beneath both reference points, the market is one level away from a verdict. Gharib’s bullish Arc outlook requires a sustained 4h close back above $4,105 to remain viable; Dua’s bearish argument depends on rallies continuing to meet resistance at the $4,172 EMA. Beyond those chart signals, Bina highlights Indian festival demand, a variable technical analysis cannot price, with the physical premium having turned positive for the first time in more than three months. The sequence to monitor starts with the 4h close at $4,105, followed by the Fed’s guidance on Wednesday and then the premium after Diwali. Physical strength coinciding with the festival season could provide the deciding factor that technical indicators seldom anticipate.
(This article was created with the help of an Artificial Intelligence tool and reviewed by an editor. Know more.)







Phone: +61 2 8036 8388
Fax: +61 2 8036 8388
Email: support@tmgm.com



The information provided on this website is of a general nature only and does not constitute personal financial advice. Before acting on any information on this website, you should consider the suitability of the information in relation to your objectives, financial situation and needs. Investing in CFDs and FX Margin Contracts carries significant risks and is not suitable for all investors. You may lose more than your initial deposit. You do not own, or have, any interest in the underlying asset. We recommend that you seek independent advice and ensure you fully understand the risks involved before trading. It is important that you read and consider the disclosure document before you acquire any product listed on the website. The information and advertisements offered on this website are not intended for use by any person in any country or jurisdiction where such use would be contrary to local laws and regulations. The Products and Services offered on this website are not intended for residents of the United States, Malaysia and Thailand.
TMGM is authorized and regulated in various jurisdictions.
Trademax Australia Limited, trading as TMGM, is regulated by the Australian Securities and Investments Commission (ASIC), AFSL no. 436416 and is located at Level 28, One International Tower, 100 Barangaroo Avenue, 2000 Sydney, NSW Australia.
Email: support@tmgm.com.au
Trademax Global Limited, trading as TMGM, is authorized and regulated by the Vanuatu Financial Services Commission (VFSC), registration number 40356 and registered at 1276, Kumul Highway, Port Vila, Vanuatu, Republic of Vanuatu.
Email: support@tmgm.com
Trademax Global Markets (SE) Limited, trading as TMGM, is authorized and regulated by the Financial Services Authority (FSA) of Seychelles, with license number SD224. The company is registered at Office No 13, Providence Estate ABIS Centre, Mahe, Seychelles.
Email: support@tmgm.com
Trademax Global Markets (International) Pty Ltd, trading as TMGM, is authorized and regulated by the Financial Services Commission, Mauritius (FSC) with license no. GB22201012, and registered at 33, Edith Cavell Street C/o IQ EQ Fund Services (Mauritius) Ltd Port Louis, 11324 Mauritius.
Email: support@tmgm.com
Copyright © TMGM. All rights reserved


