
News & AnalysisCareer

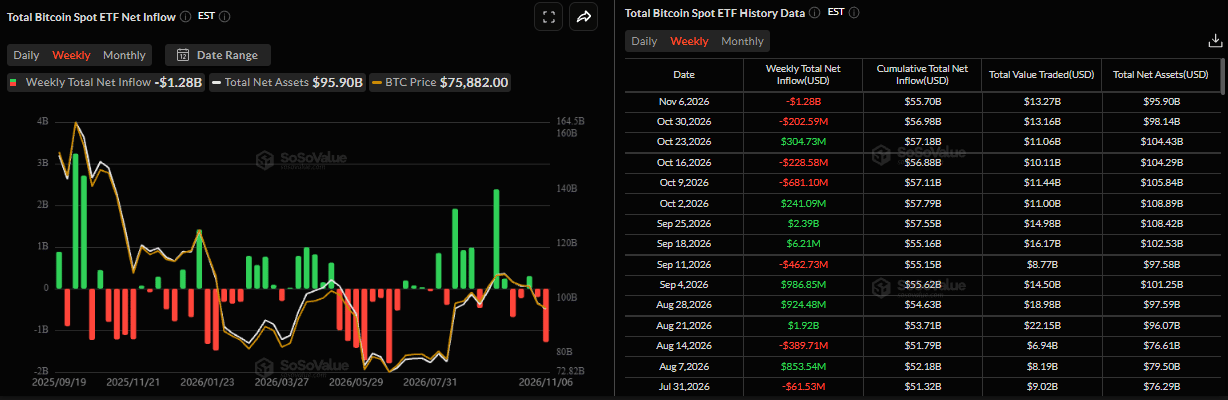
Stronger-than-expected jobs figures have reinforced expectations that the Federal Reserve (Fed) could leave interest rates higher for longer, adding to pressure on Bitcoin (BTC). On Monday, the cryptocurrency trades beneath its 50-week Simple Moving Average (SMA) at $75,222, having registered five consecutive weekly declines. Last week’s $1.28 billion in net withdrawals from spot BTC Exchange-Traded Funds (ETFs), the largest weekly outflow since late June, also deepened bearish sentiment towards the leading cryptocurrency.

Net withdrawals from BTC spot ETFs reached $1.28 billion last week, according to SoSoValue, signalling softer institutional demand for Bitcoin. It was the largest weekly outflow since the end of June and the second consecutive week of withdrawals, pointing to waning investor demand. Should withdrawals persist and gather pace throughout this week, BTC could face further pressure and a deeper price correction.
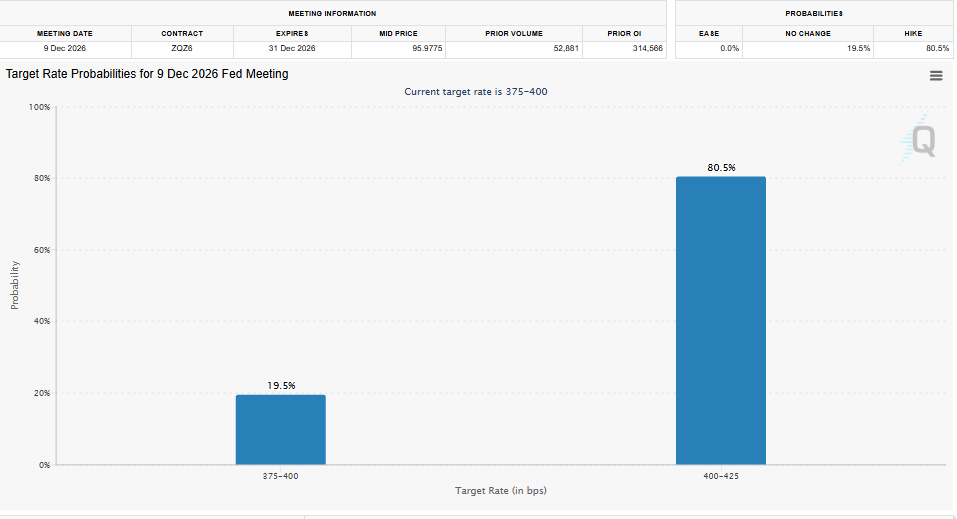
US Nonfarm Payrolls (NFP) figures exceeded expectations, bolstering the view that the Fed could maintain higher interest rates for longer and putting risk assets under pressure. For holders of non-yielding assets such as Bitcoin, higher rates raise the opportunity cost. They may also tighten financial conditions and curb investors’ willingness to take on riskier investments.
The CME FedWatch tool chart puts the market-implied probability of a Fed rate increase in December at about 80.5%, compared with 72.8% before the US jobs report. Against this macroeconomic backdrop, BTC’s prospects for a recovery could remain under pressure.
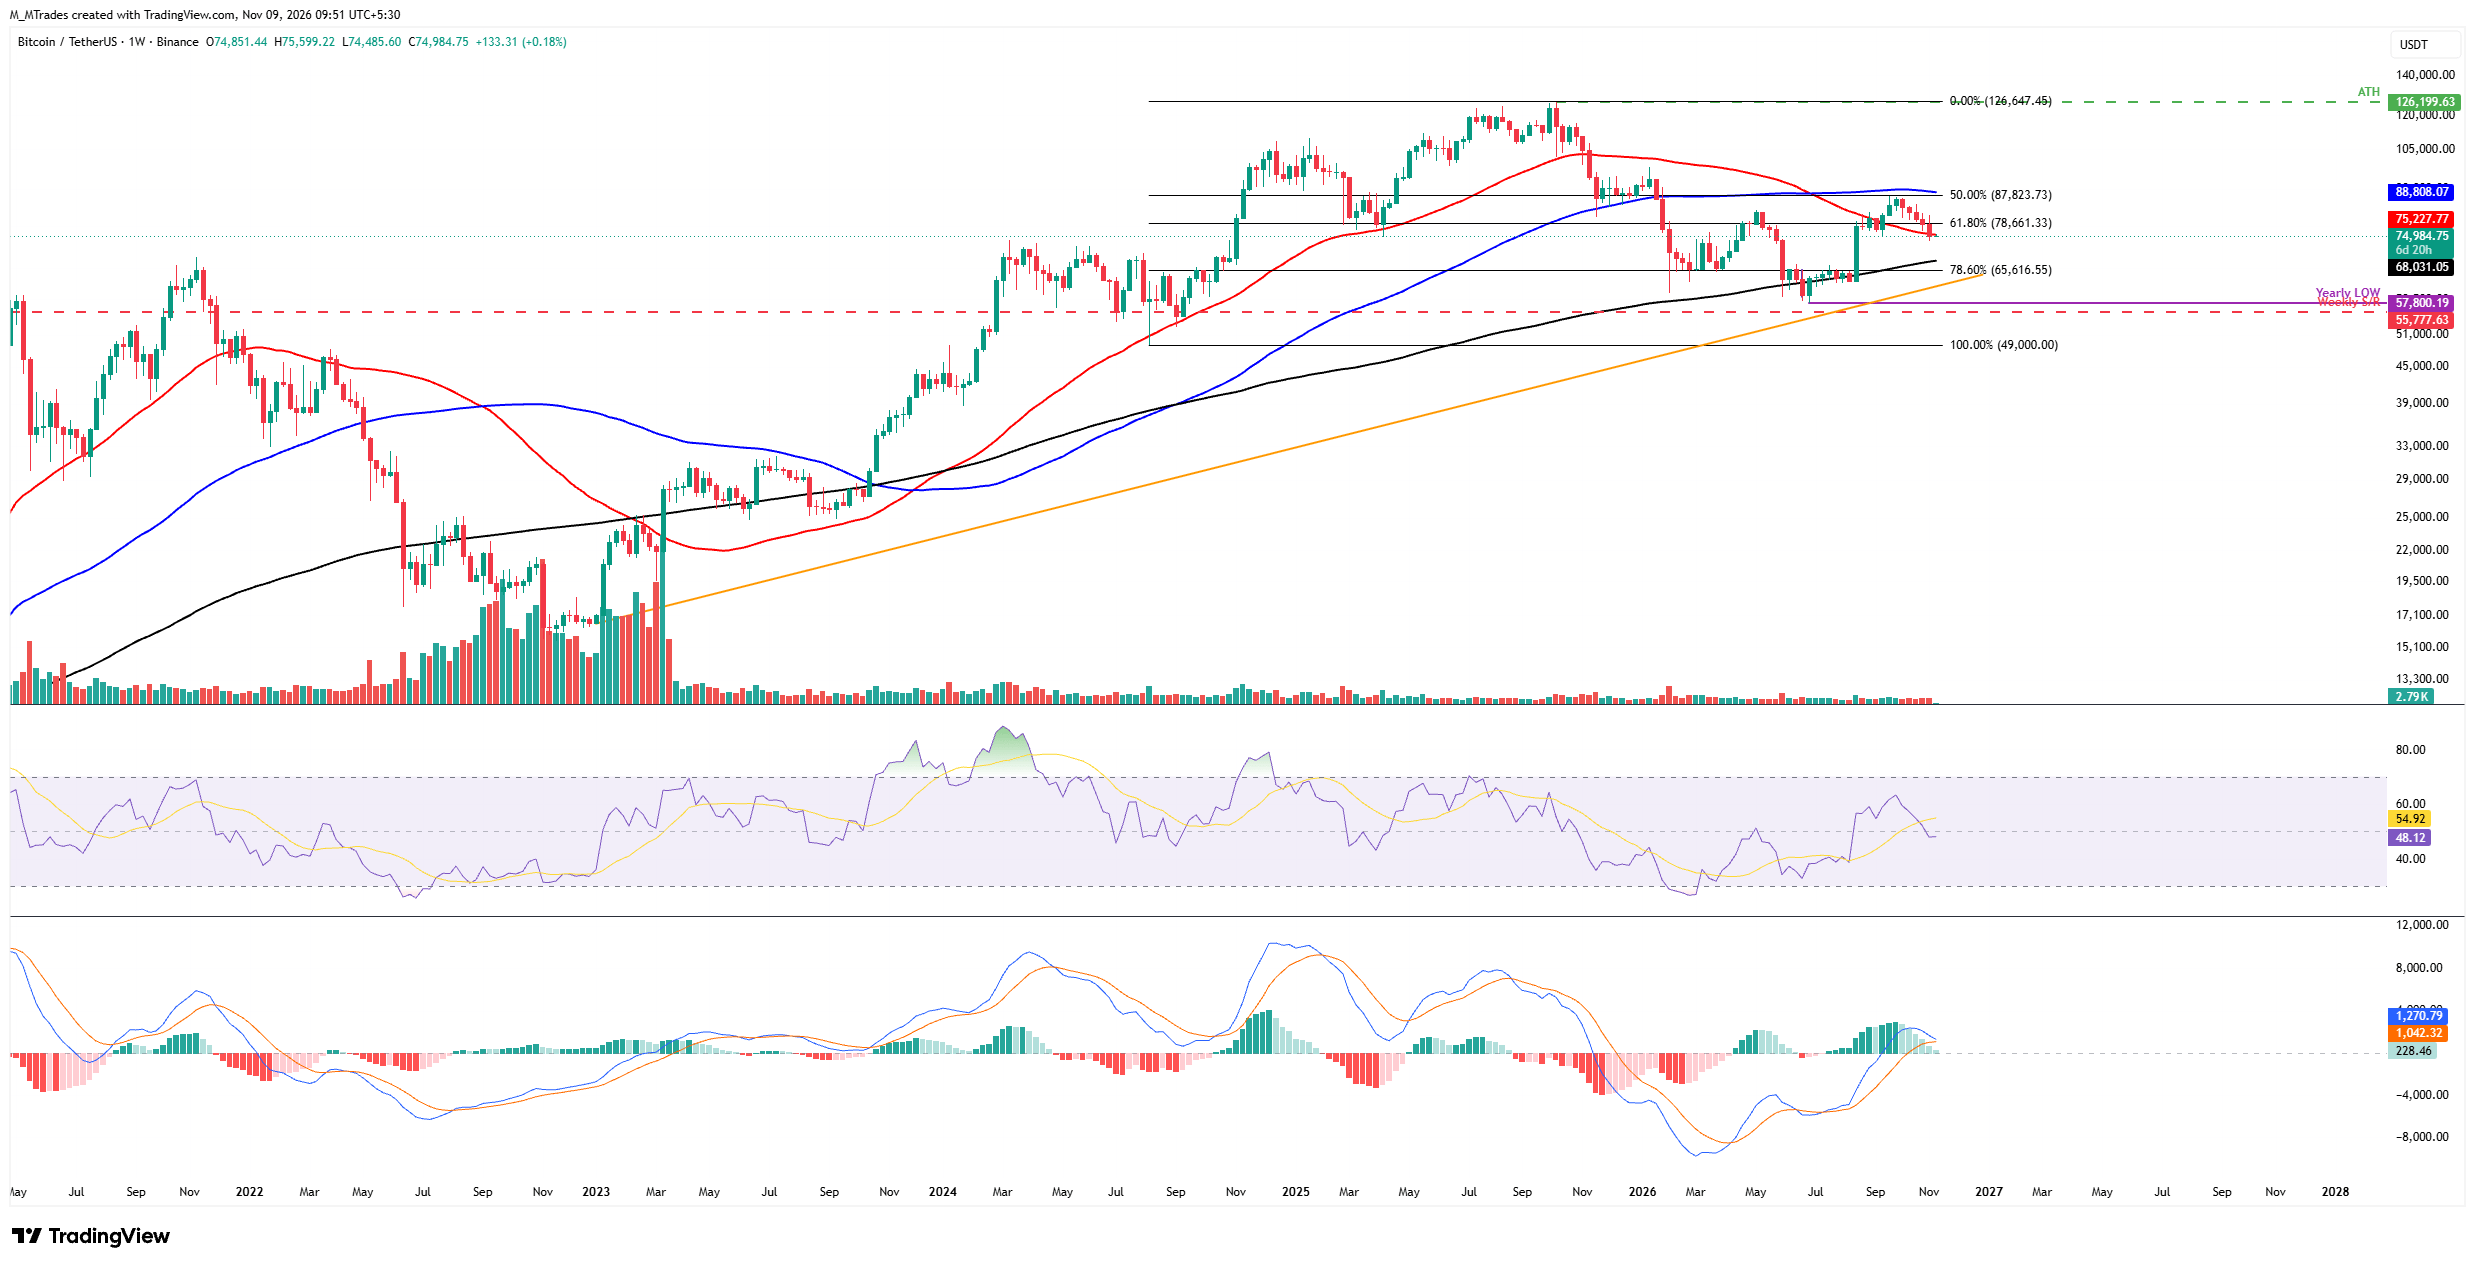
A 4.47% decline last week left the leading cryptocurrency below the 50-week Simple Moving Average (SMA) at $75,222 at the close, completing a fifth consecutive week of losses. BTC remains beneath that average as the new week begins on Monday, trading around $74,984.
A continuation of BTC’s correction could take the price towards the 200-week SMA at $68,031.
At 48, the weekly Relative Strength Index (RSI) sits beneath the neutral 50 threshold, pointing to waning bullish momentum. The Moving Average Convergence Divergence (MACD) histogram, by contrast, is still positive, though its bars are shrinking. Taken together, these signals suggest that the broader upward momentum has not reversed but is weakening as nearby resistance and the continuing correction weigh.
A rebound in BTC could instead bring the 50-week SMA at $75,222 into view. Closing above that level and holding it could open the way for a recovery towards the 61.8% Fibonacci retracement at $78,661, measured from the August 2024 low of $49,000 to the October 2025 record high of $126,199.
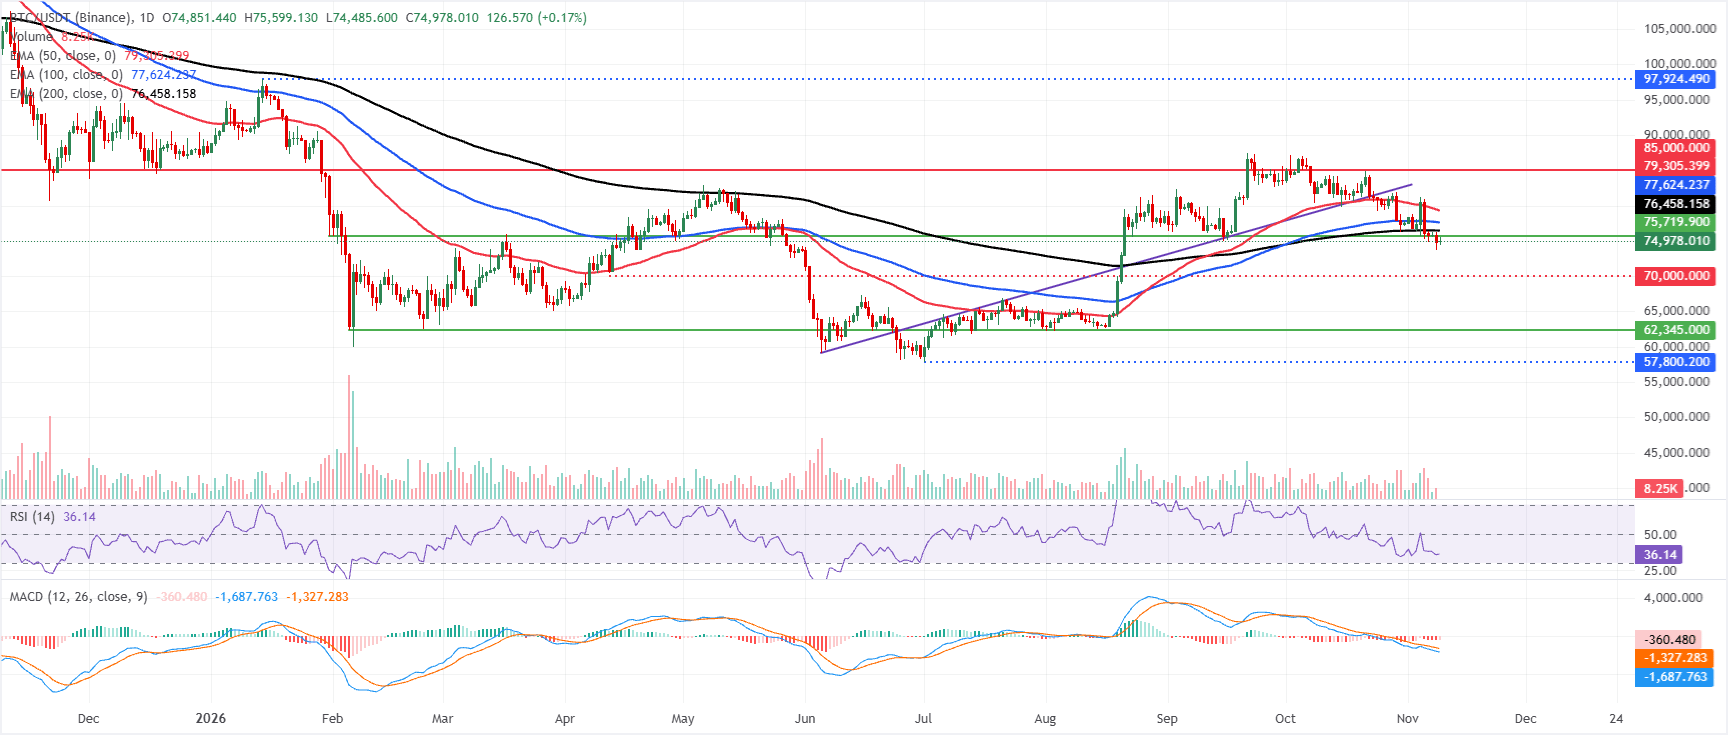
Trading below the major Exponential Moving Averages (EMAs) leaves BTC’s short-term outlook bearish on the daily chart. The closest obstacle is the 200-day EMA at $76,458. Above it, the 100-day EMA at $77,624 and the 50-day EMA at $79,305 add to the substantial overhead resistance.
An RSI reading near 36 also points to weaker daily momentum. With the MACD still negative and below zero, any rallies towards these overhead levels are likely to encounter selling pressure.
The first upside hurdle is the 200-day EMA around $76,458, with the 100-day EMA at $77,624 next in line. If the recovery strengthens, attention would turn to the 50-day EMA at $79,307, followed by horizontal resistance near $85,000.
With no nearby support identified on the chart, a break below current levels would suggest a move towards the psychological support area around $70,000 before BTC stabilises.
(The technical analysis of this story was written with the help of an AI tool. Know more.)
By market capitalisation, Bitcoin ranks as the largest cryptocurrency. It is a virtual currency intended to function as money. No single person, group or entity can control this means of payment, removing the need for a third party to participate in financial transactions.
The term altcoin covers cryptocurrencies other than Bitcoin. Some, however, also exclude Ethereum, on the grounds that forks originate from these two cryptocurrencies. Under that interpretation, Litecoin is the first altcoin: it was forked from the Bitcoin protocol and is therefore an “improved” version of it.
Designed to maintain a stable price, stablecoins are cryptocurrencies backed by reserves of the asset they represent. Their value is pegged to a commodity or financial instrument, such as the US Dollar (USD), while an algorithm or demand regulates their supply. Their principal purpose is to give investors a route into and out of cryptocurrency trading and investment. They can also serve as a store of value for investors, as cryptocurrencies are generally subject to price volatility.
Expressed as a ratio, Bitcoin dominance compares Bitcoin’s market capitalisation with the combined market capitalisation of all cryptocurrencies, offering a clear indication of investor interest in Bitcoin. BTC dominance is typically high ahead of and during a bull run, when investors favour relatively stable cryptocurrencies with large market capitalisations, such as Bitcoin. Falling BTC dominance usually signals that investors are shifting capital and/or profits into altcoins in pursuit of higher returns, a move that commonly triggers sharp rallies across altcoins.







Phone: +61 2 8036 8388
Fax: +61 2 8036 8388
Email: support@tmgm.com



The information provided on this website is of a general nature only and does not constitute personal financial advice. Before acting on any information on this website, you should consider the suitability of the information in relation to your objectives, financial situation and needs. Investing in CFDs and FX Margin Contracts carries significant risks and is not suitable for all investors. You may lose more than your initial deposit. You do not own, or have, any interest in the underlying asset. We recommend that you seek independent advice and ensure you fully understand the risks involved before trading. It is important that you read and consider the disclosure document before you acquire any product listed on the website. The information and advertisements offered on this website are not intended for use by any person in any country or jurisdiction where such use would be contrary to local laws and regulations. The Products and Services offered on this website are not intended for residents of the United States, Malaysia and Thailand.
TMGM is authorized and regulated in various jurisdictions.
Trademax Australia Limited, trading as TMGM, is regulated by the Australian Securities and Investments Commission (ASIC), AFSL no. 436416 and is located at Level 28, One International Tower, 100 Barangaroo Avenue, 2000 Sydney, NSW Australia.
Email: support@tmgm.com.au
Trademax Global Limited, trading as TMGM, is authorized and regulated by the Vanuatu Financial Services Commission (VFSC), registration number 40356 and registered at 1276, Kumul Highway, Port Vila, Vanuatu, Republic of Vanuatu.
Email: support@tmgm.com
Trademax Global Markets (SE) Limited, trading as TMGM, is authorized and regulated by the Financial Services Authority (FSA) of Seychelles, with license number SD224. The company is registered at Office No 13, Providence Estate ABIS Centre, Mahe, Seychelles.
Email: support@tmgm.com
Trademax Global Markets (International) Pty Ltd, trading as TMGM, is authorized and regulated by the Financial Services Commission, Mauritius (FSC) with license no. GB22201012, and registered at 33, Edith Cavell Street C/o IQ EQ Fund Services (Mauritius) Ltd Port Louis, 11324 Mauritius.
Email: support@tmgm.com
Copyright © TMGM. All rights reserved


