
News & AnalysisCareer

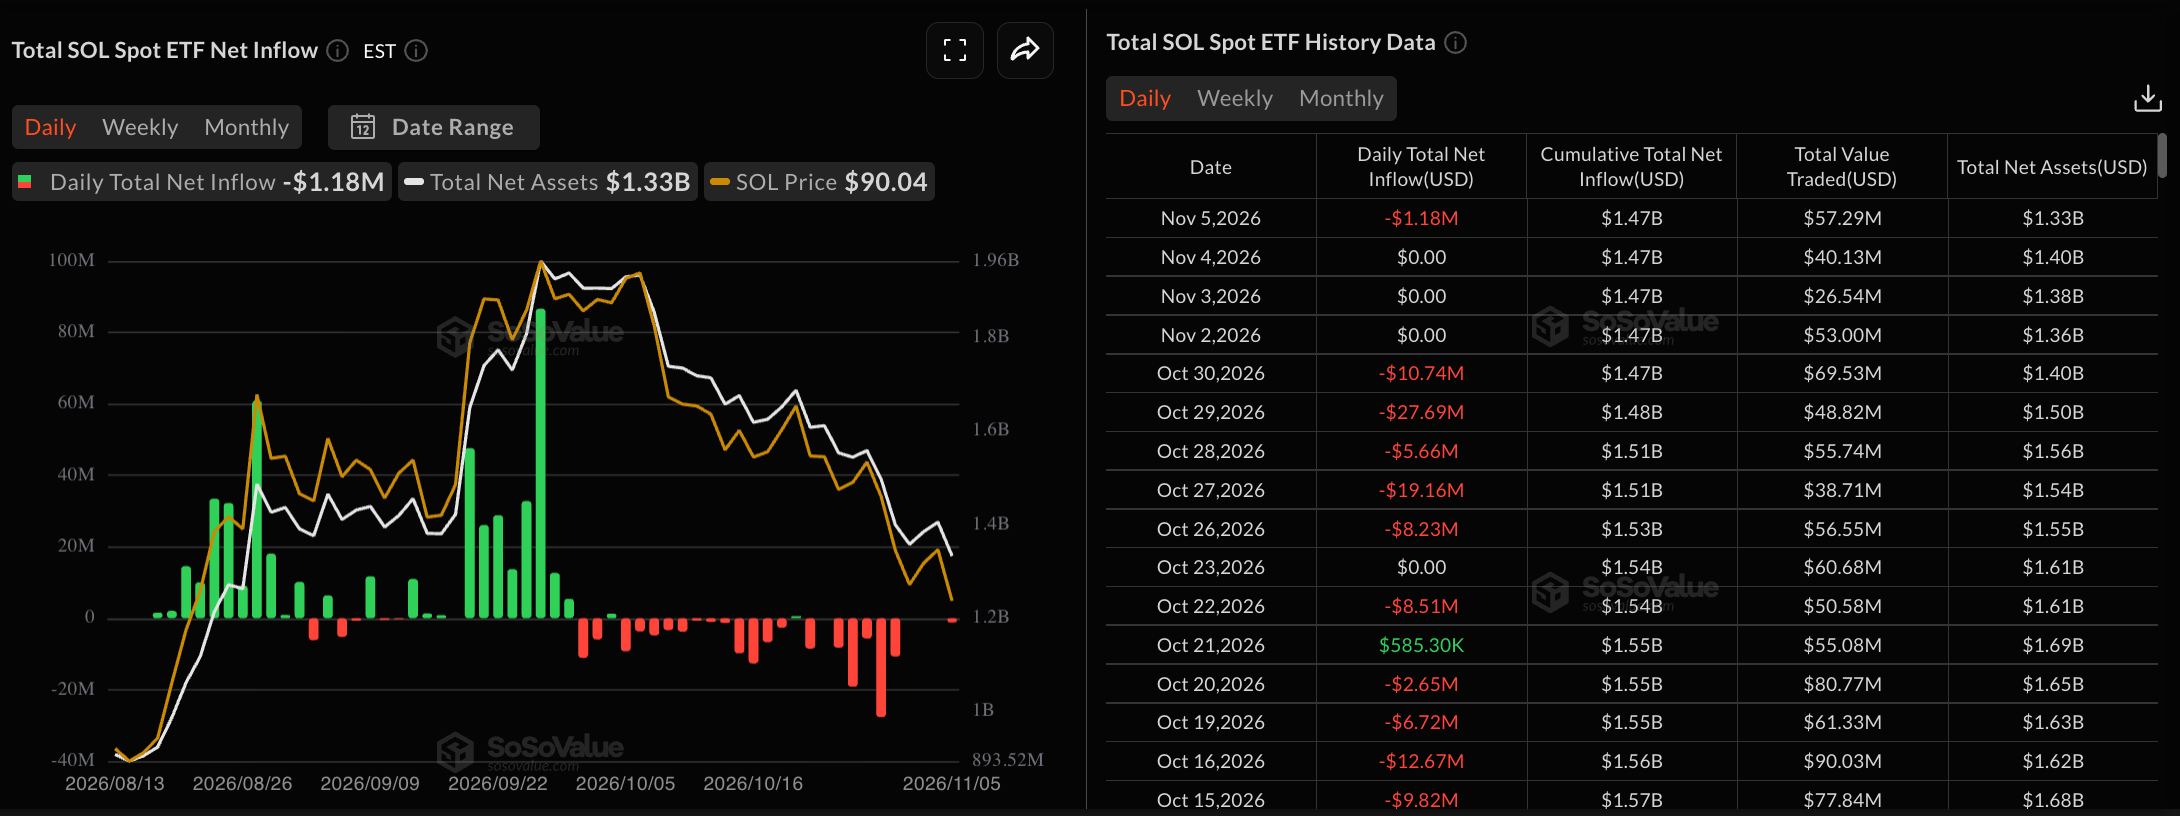
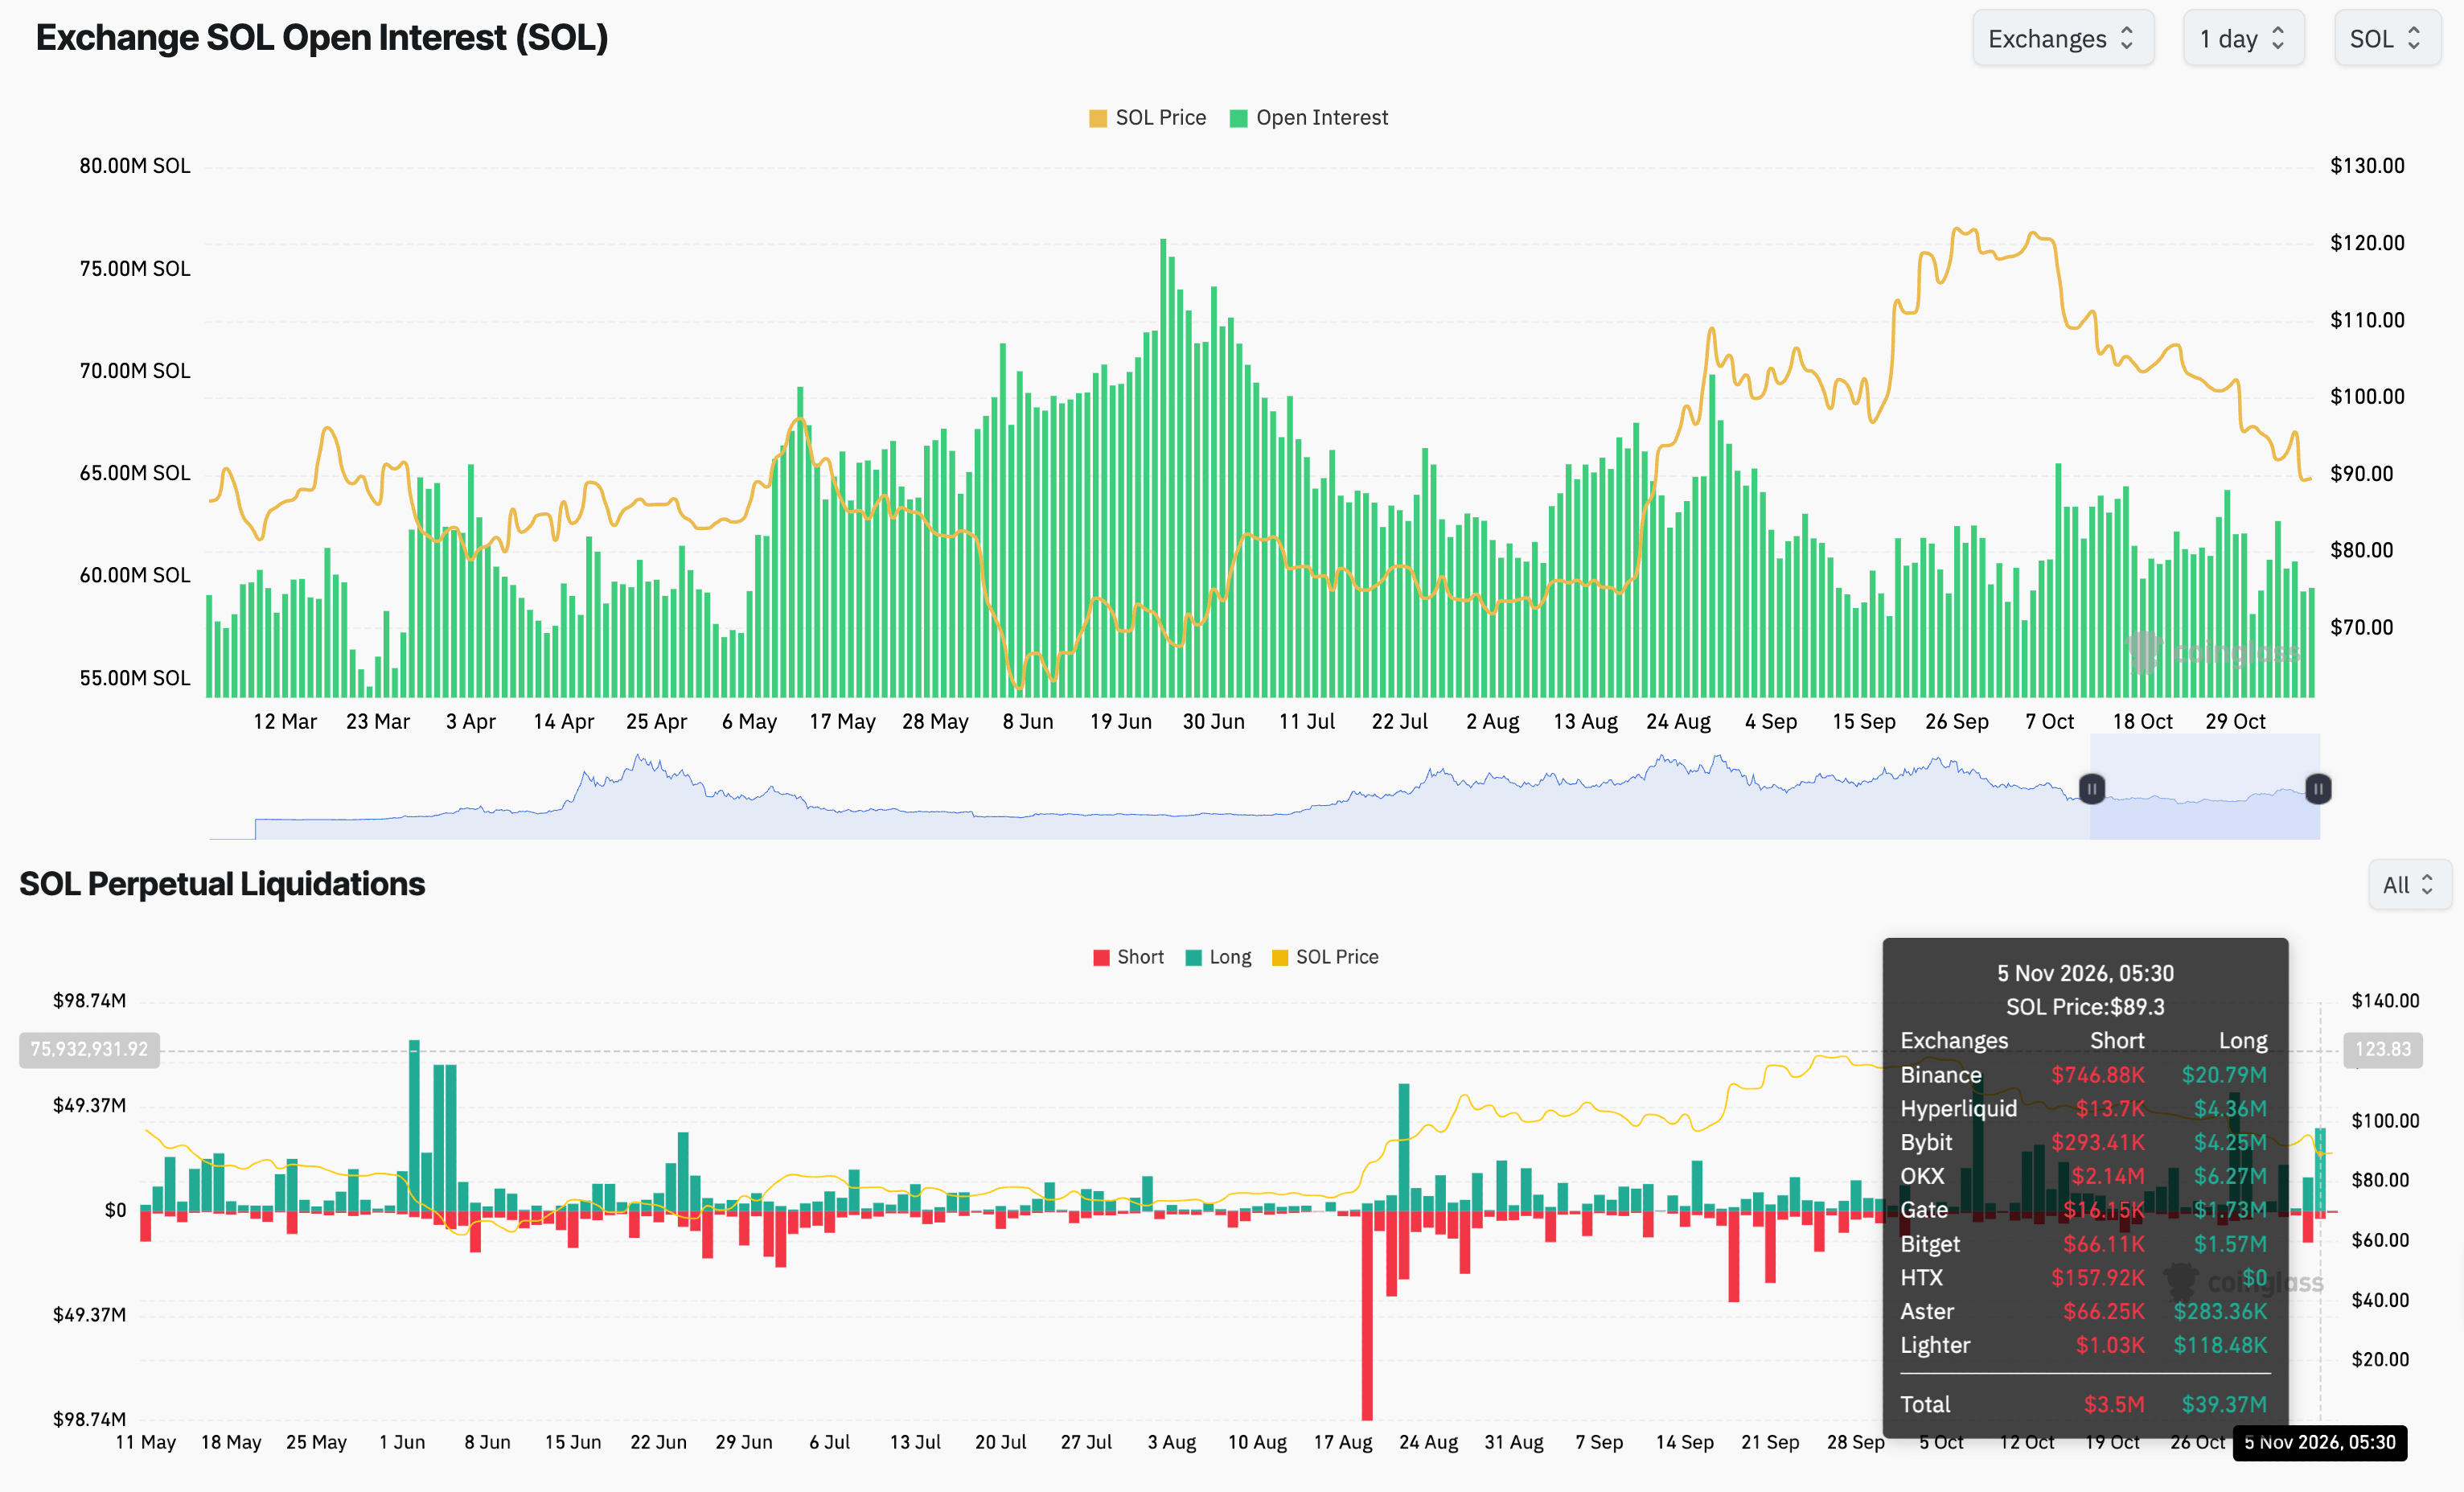
Liquidations across the broader cryptocurrency market exceeded $1 billion as Solana (SOL) lost over 6% the previous day, leaving it trading below $90.00 at a two-month low on Friday. Falling open interest in derivatives markets indicates waning trader interest in Solana. Meanwhile, institutional investors pulled $1.18 million from SOL-focused exchange-traded funds (ETFs), adding to last week’s record outflow of $71.47 million.

A break below horizontal support at $87.21 could, from a technical standpoint, leave Solana vulnerable to further losses towards the $70.00 round-number level.
Macroeconomic uncertainty is weighing on sentiment across the cryptocurrency market, reducing both institutional and retail investors’ appetite for Solana. A Democratic sweep of the US midterms, alongside the ongoing AI debt crises, is fuelling risk aversion.
After three consecutive days without flows, SOL-focused ETFs registered withdrawals of $1.18 million on Thursday. The pause suggests institutional investors had taken a breather following last week’s $71.47 million in withdrawals, the largest weekly outflow and the fourth consecutive week of net withdrawals.
Among retail traders, positions have been unwound so far this week: CoinGlass puts SOL futures open interest (OI) at 59.45 million SOL, compared with 62.71 million on Monday. Of Thursday’s $42.87 million in total liquidations, long positions accounted for $39.37 million, showing that buy-side positions made up the bulk of liquidations as sellers reasserted control.
With ETF withdrawals and lower OI signalling weaker interest in Solana, downside risks could intensify further.
At the time of writing on Friday, Solana stands at $89.65 and remains on course for its sixth consecutive weekly decline. Trading below the 200-day exponential moving average (EMA) at $99.62 keeps SOL’s near-term outlook bearish. Meanwhile, the falling 50-day EMA at $101.92 risks slipping beneath the 200-day EMA, potentially producing a Death Cross signal.
Around $89.83, SOL is testing a long-term ascending support trendline linking the lows of June 6 and 25. Should a break below that line be confirmed, horizontal support at $87.21 could come under pressure, opening the way for a sharper correction towards the $70.58 floor last tested on August 1.
Daily momentum indicators also favour the downside. The Relative Strength Index (RSI) stands at 29, close to oversold territory, while the falling Moving Average Convergence Divergence (MACD) remains in negative territory beneath its signal line.
If the support trendline prompts a rebound, the first upside test could be the 200-day EMA at $99.62, with the 50-day EMA at $101.92 next in view.
(The technical analysis of this story was written with the help of an AI tool. Know more.)







Phone: +61 2 8036 8388
Fax: +61 2 8036 8388
Email: support@tmgm.com



The information provided on this website is of a general nature only and does not constitute personal financial advice. Before acting on any information on this website, you should consider the suitability of the information in relation to your objectives, financial situation and needs. Investing in CFDs and FX Margin Contracts carries significant risks and is not suitable for all investors. You may lose more than your initial deposit. You do not own, or have, any interest in the underlying asset. We recommend that you seek independent advice and ensure you fully understand the risks involved before trading. It is important that you read and consider the disclosure document before you acquire any product listed on the website. The information and advertisements offered on this website are not intended for use by any person in any country or jurisdiction where such use would be contrary to local laws and regulations. The Products and Services offered on this website are not intended for residents of the United States, Malaysia and Thailand.
TMGM is authorized and regulated in various jurisdictions.
Trademax Australia Limited, trading as TMGM, is regulated by the Australian Securities and Investments Commission (ASIC), AFSL no. 436416 and is located at Level 28, One International Tower, 100 Barangaroo Avenue, 2000 Sydney, NSW Australia.
Email: support@tmgm.com.au
Trademax Global Limited, trading as TMGM, is authorized and regulated by the Vanuatu Financial Services Commission (VFSC), registration number 40356 and registered at 1276, Kumul Highway, Port Vila, Vanuatu, Republic of Vanuatu.
Email: support@tmgm.com
Trademax Global Markets (SE) Limited, trading as TMGM, is authorized and regulated by the Financial Services Authority (FSA) of Seychelles, with license number SD224. The company is registered at Office No 13, Providence Estate ABIS Centre, Mahe, Seychelles.
Email: support@tmgm.com
Trademax Global Markets (International) Pty Ltd, trading as TMGM, is authorized and regulated by the Financial Services Commission, Mauritius (FSC) with license no. GB22201012, and registered at 33, Edith Cavell Street C/o IQ EQ Fund Services (Mauritius) Ltd Port Louis, 11324 Mauritius.
Email: support@tmgm.com
Copyright © TMGM. All rights reserved


