

Hyperliquid Price Forecast: HYPE pares recent gains as momentum, retail hype fade
- Hyperliquid hovers around $80 on Monday, sustaining over 50% monthly gains so far.
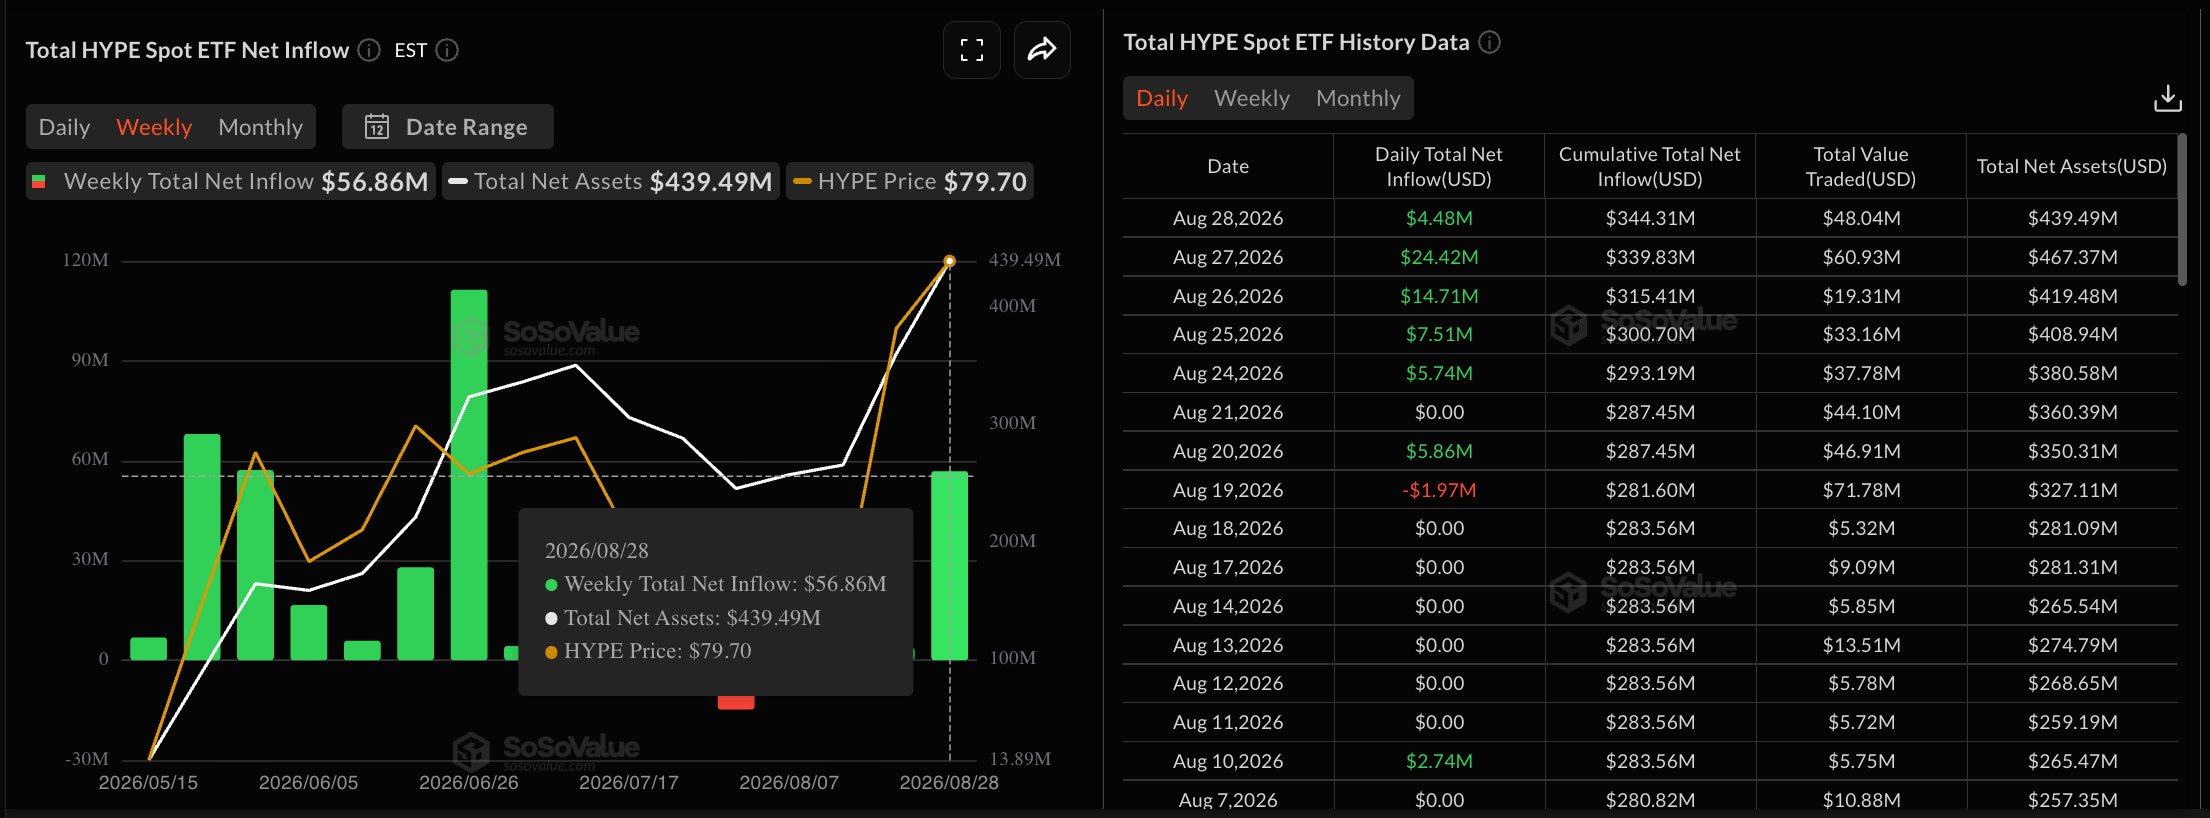
- HYPE ETFs recorded $56.86 million in inflows last week, the largest over the last two months, pointing to renewed institutional demand.
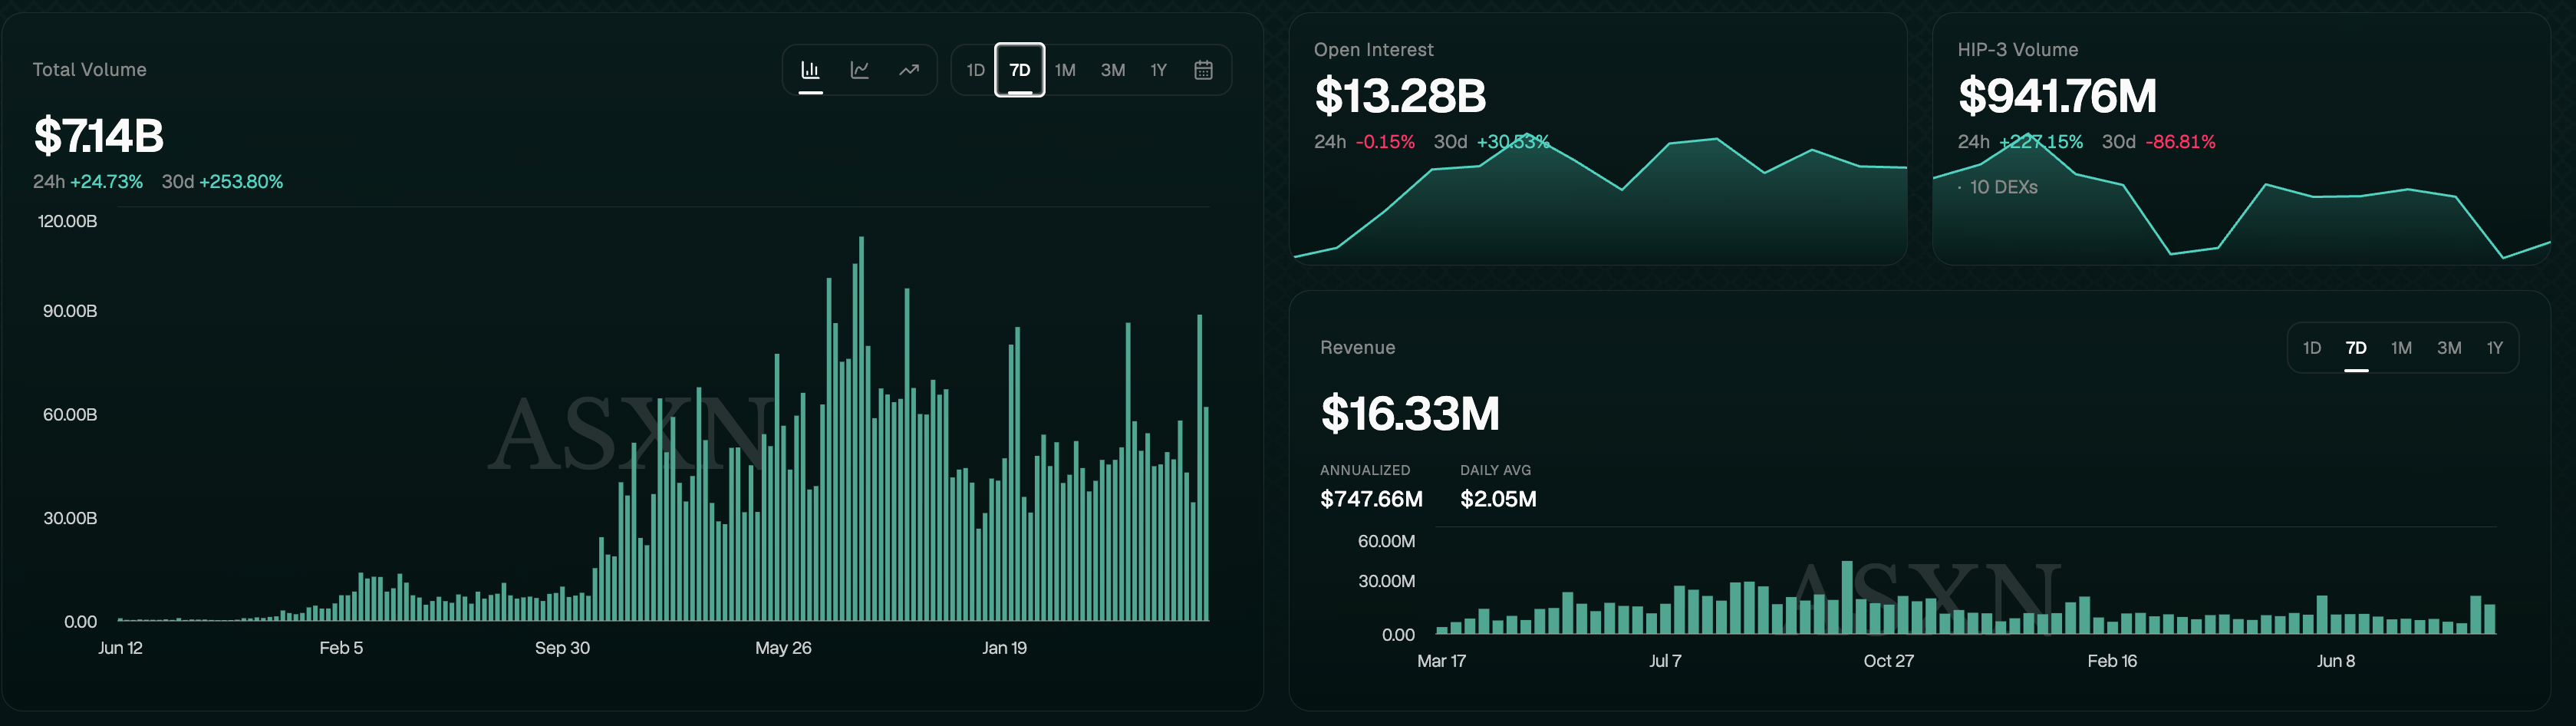
- On-chain data shows elevated trading volume and revenue last week, suggesting firm network activity.
Hyperliquid (HYPE) price is trading around $80.00 on Monday, maintaining a constructive bias with steady institutional inflows of over $50 million last week. On-chain data show elevated trading volume and revenue over the last two weeks, while retail speculation eases as HYPE futures Open Interest declines. The technical outlook is mixed as bullish momentum wanes.

Retail sentiment shifts as institutional, network demand holds steady
Hyperliquid is gaining institutional interest amid elevated network demand. SoSoValue data shows that the HYPE Exchange Traded Funds (ETFs) recorded five consecutive days of inflows, totaling $56.86 million last week and $66.33 million so far this month.
On the platform side, Hyperliquid Analytics recorded $61.93 billion in total volume last week, with $16.45 million in revenue, down from the previous week’s $88.68 billion in volume and $21.27 million in revenue. Though the data shows an easing in Hyperliquid metrics, the long-term trend reflects elevated network activity.
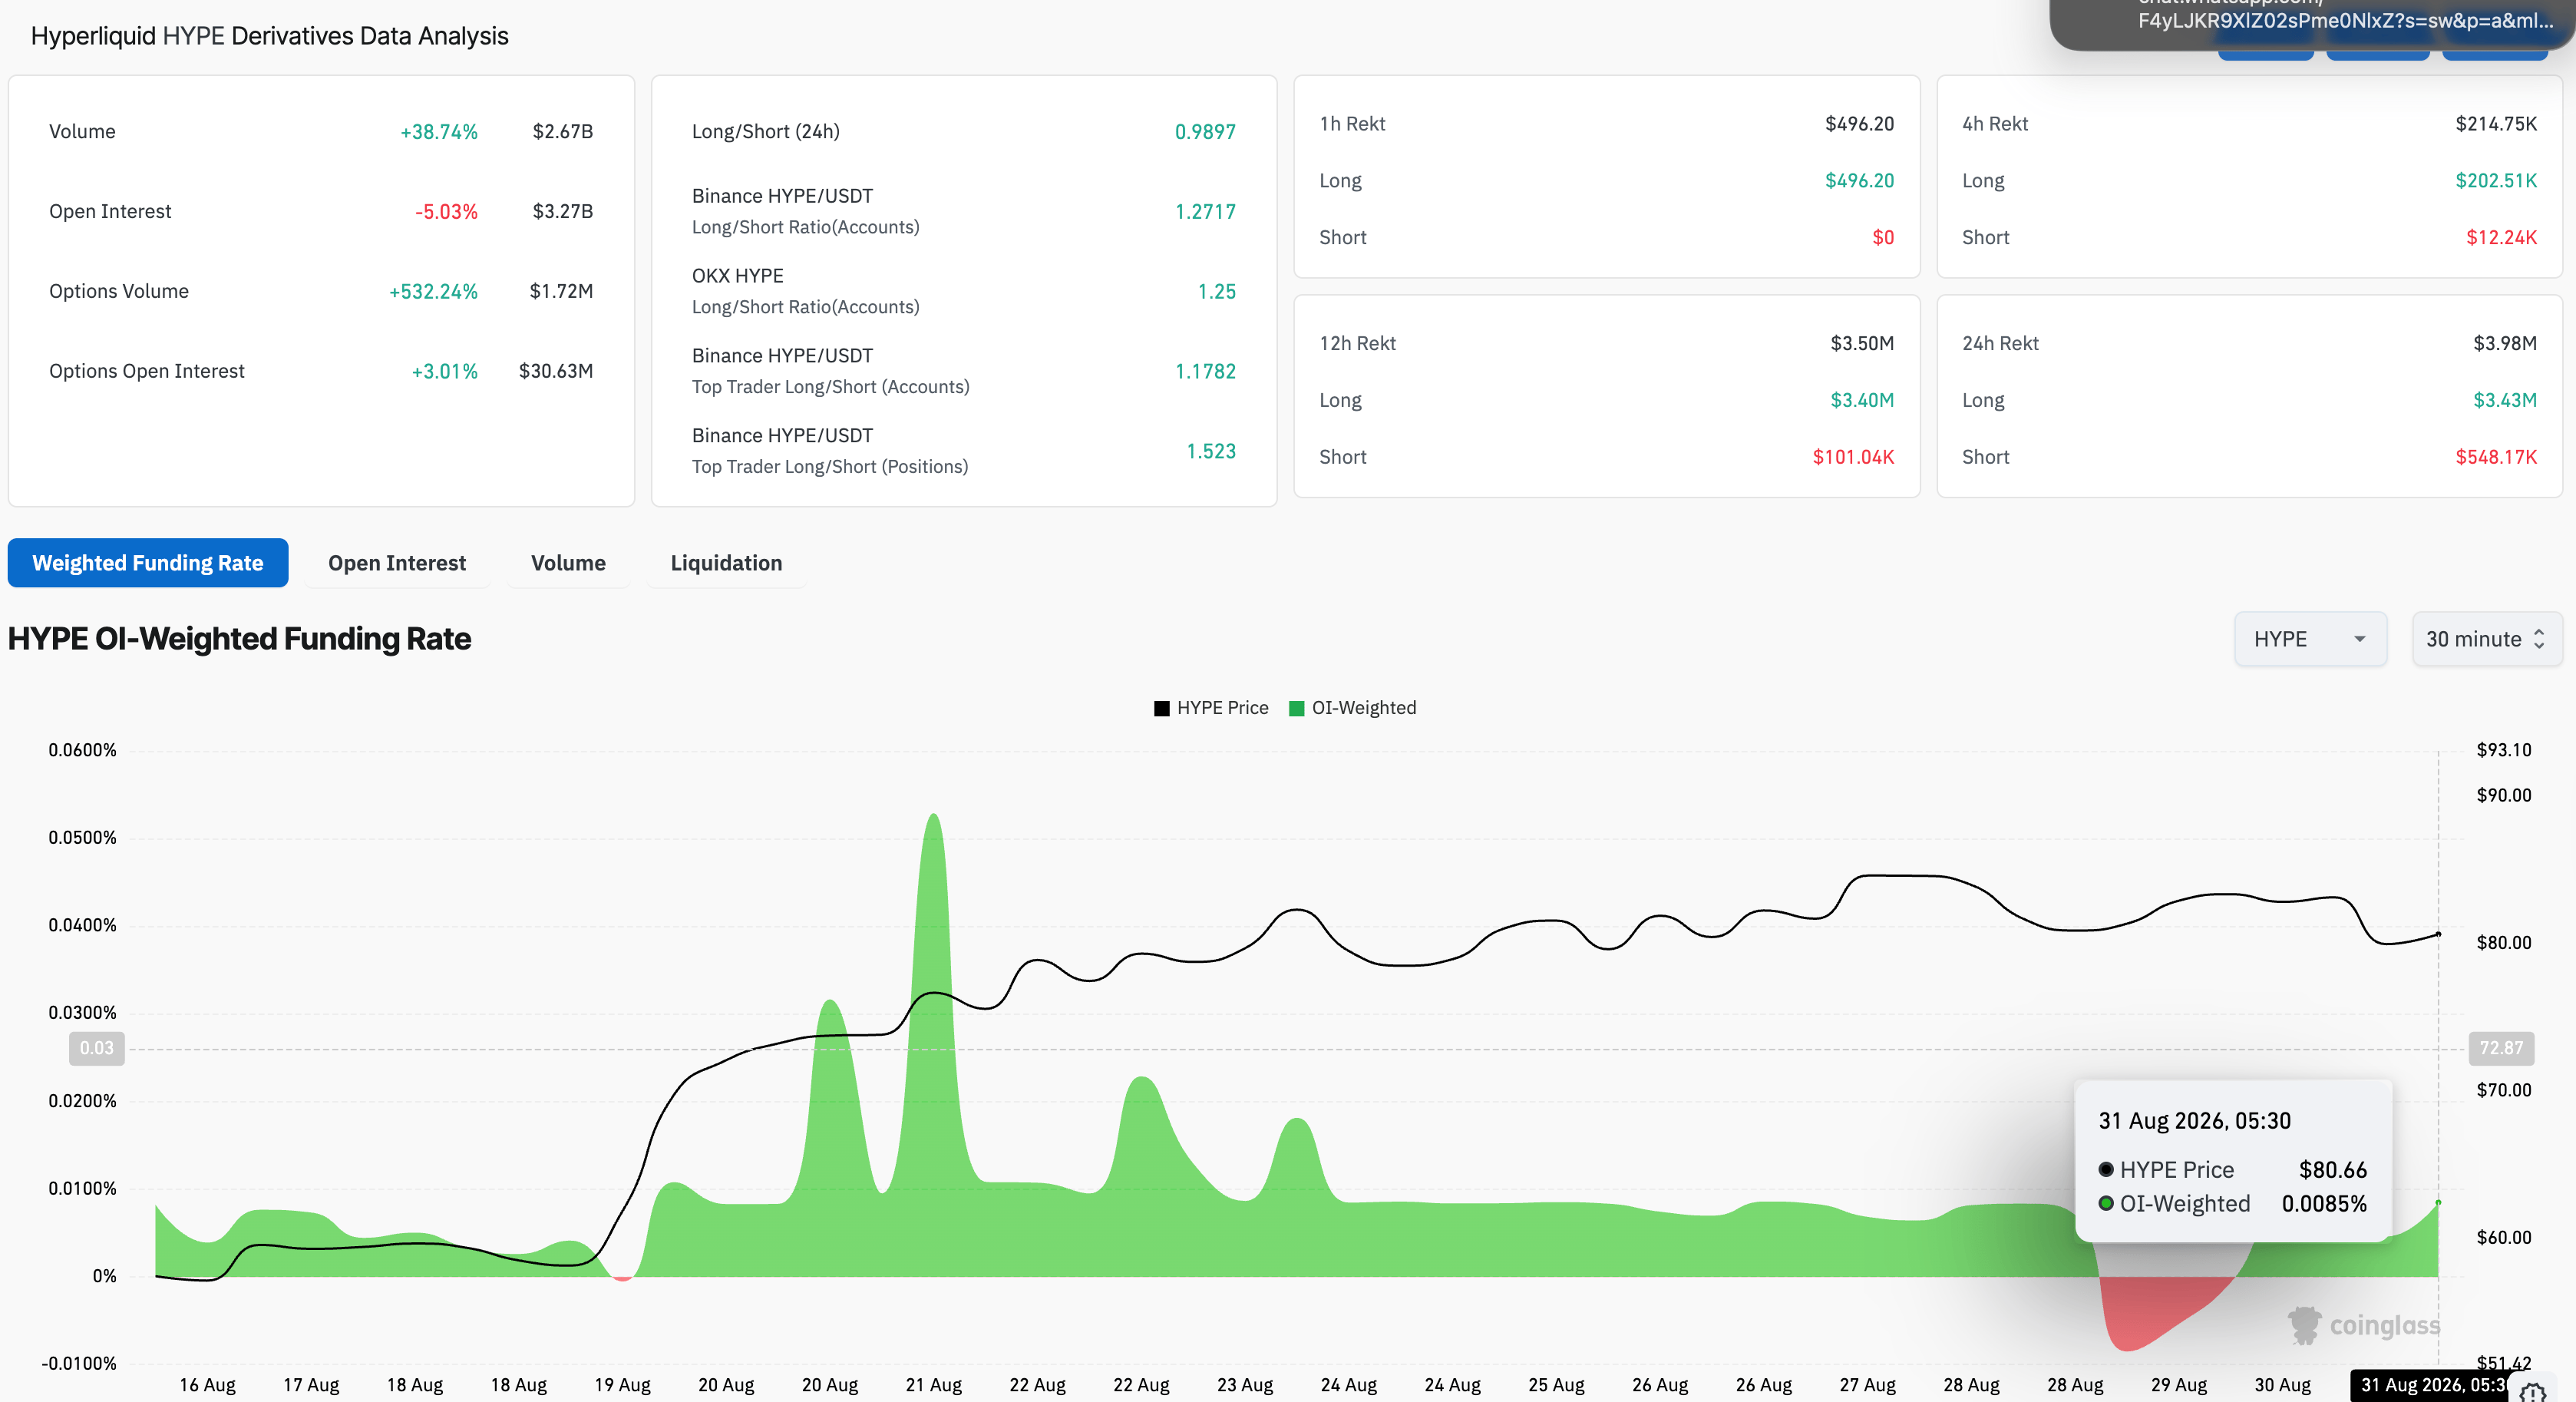
On the retail side, HYPE futures Open Interest (OI) is down 5% over the last 24 hours to $3.27 billion, indicating reduced notional value of active contracts or positional wipeout. Total liquidation of $3.98 million in the same period, led by long liquidation of $3.43 million, reaffirms the contraction in active long positions. The OI-weighted funding rate of 0.0085% indicates a persistent bullish bias among traders, willing to buy high-risk long positions at a premium.
Technical outlook: Will HYPE price extend gains above $80?
Hyperliquid trades at $80.14 at press time on Monday, holding steady after a 4% drop the previous day. HYPE sustains a bullish near-term bias as price holds well above the major Exponential Moving Averages (EMAs). The 50-day EMA at $66.94, the 100-day EMA at $61.93, and the 200-day EMA at $54.61 all trail the advance, hinting at a firmly supported uptrend.
From a technical perspective, HYPE remains capped below the 127.2% Fibonacci extension level of the downswing from $76.93 to $51.20 at $83.93. A confirmed breakout above this level could extend the rally toward the 161.8% Fibonacci extension at $92.83.
Momentum eases but remains constructive on the daily chart, with the Relative Strength Index (RSI) easing from the overbought zone to 64, while the Moving Average Convergence Divergence (MACD) is sloping toward the signal line as the bullish histogram profile wanes, suggesting reduced upside pressure.
On the downside, initial support emerges around the prior Fibonacci cycle high at $76.93, ahead of a dense retracement cluster between the 78.60% level at $71.42 and the 50-day EMA at $66.94.
(The technical analysis of this story was written with the help of an AI tool. Know more.)













