

Giao dịch
Khám phá đa dạng thị trường với mức giá cạnh tranh, thanh khoản sâu và các công cụ giao dịch tiên tiến.
Tìm hiểu thêm 
Nền tảng
Giao dịch mượt mà với nền tảng mạnh mẽ của TMGM, được xây dựng để đảm bảo tốc độ, độ chính xác và trải nghiệm giao dịch vượt trội.
Tìm hiểu thêm Nền tảng Giao dịch
Công cụ Giao dịch
Học viện
Học các kiến thức cơ bản về giao dịch với các tài nguyên thân thiện cho người mới bắt đầu, bao gồm hướng dẫn, hội thảo trực tuyến và nhận định thị trường.
Tìm hiểu thêm Học viện TMGM
Tin tức & Phân tích
Nhận cập nhật thị trường theo thời gian thực và phân tích chuyên gia để luôn dẫn đầu các cơ hội giao dịch
Tìm hiểu thêm Tin tức & Phân tích
Giới thiệu
Tìm hiểu điều gì làm nên sự khác biệt của TMGM — sự hiện diện toàn cầu, sức mạnh quy định và cam kết đổi mới trong giao dịch.
Tìm hiểu thêm Tại sao chọn TMGM
USD/INR rises at open on bleeding Indian IT stocks refresh fears of foreign outflows
- The Indian Rupee weakens against the US Dollar due to significant FIIs' outflow from the Indian stock market.
- US-Iran tensions have also dampened the appeal of risk-sensitive currencies.
- The US Dollar remains steady even as US inflation cools down.
The Indian Rupee (INR) opens lower against the US Dollar (USD) at the start of the week. The USD/INR pair rises to near 90.70 as the Indian Rupee has come under pressure following a sharp sell-off by overseas investors in the Indian stock market on Friday, resulting in a significant outflow of foreign funds.

On Friday, Foreign Institutional Investors (FIIs) sold shares worth Rs. 7,395.41 crore in the Indian equity market, according to data from the National Stock Exchange (NSE), as fears of Artificial Intelligence (AI) disruption led to a bloodbath in the Information Technology (IT) stocks.
Bleeding Indian IT stocks have dampened the interest of foreign investors once again, who were returning to domestic markets after the confirmation of a trade deal between the United States (US) and India.
In addition to a significant outflow of foreign funds, expectations of higher oil prices due to tensions between the US and Iran are also weighing on the Indian Rupee. The appeal of currencies that rely heavily on imports of oil to meet their energy needs diminished in a high oil-price environment.
Meanwhile, India's Wholesale Price Index (WPI) Inflation data for January has come in higher at 1.81% Year-on-Year (YoY) against estimates of 1.25% and 0.83% in December.
The table below shows the percentage change of Indian Rupee (INR) against listed major currencies today. Indian Rupee was the weakest against the Australian Dollar.
| USD | EUR | GBP | JPY | CAD | AUD | INR | CHF | |
|---|---|---|---|---|---|---|---|---|
| USD | 0.09% | 0.11% | 0.29% | -0.03% | -0.17% | 0.15% | 0.11% | |
| EUR | -0.09% | 0.02% | 0.22% | -0.12% | -0.26% | 0.03% | 0.02% | |
| GBP | -0.11% | -0.02% | 0.17% | -0.15% | -0.28% | 0.04% | -0.01% | |
| JPY | -0.29% | -0.22% | -0.17% | -0.33% | -0.47% | -0.18% | -0.19% | |
| CAD | 0.03% | 0.12% | 0.15% | 0.33% | -0.13% | 0.16% | 0.14% | |
| AUD | 0.17% | 0.26% | 0.28% | 0.47% | 0.13% | 0.30% | 0.27% | |
| INR | -0.15% | -0.03% | -0.04% | 0.18% | -0.16% | -0.30% | -0.01% | |
| CHF | -0.11% | -0.02% | 0.00% | 0.19% | -0.14% | -0.27% | 0.01% |
The heat map shows percentage changes of major currencies against each other. The base currency is picked from the left column, while the quote currency is picked from the top row. For example, if you pick the Indian Rupee from the left column and move along the horizontal line to the US Dollar, the percentage change displayed in the box will represent INR (base)/USD (quote).
Fed's Goolsbee supports further progress in US inflation to advocate more rate cuts
- The upside move in the Indian Rupee is also driven by the US Dollar’s steady performance. As of writing, the US Dollar Index (DXY), which tracks the Greenback’s value against six major currencies, trades marginally higher near 96.95.
- The US Dollar remains broadly stable at the start of the week as near-term dovish Federal Reserve (Fed) expectations have remained capped despite US inflation cooling at a faster-than-expected pace in January.
- According to the CME FedWatch tool, the possibility of the Fed leaving interest rates steady in the current range of 3.50%-3.75% remains almost unchanged after the US inflation data release.
- The data showed on Friday that the US headline inflation dropped to 2.4% YoY from 2.7% in December. Month-on-month (MoM) US headline CPI grew at a slower pace of 0.2% against estimates and the prior reading of 0.3%.
- Chicago Fed President Austan Goolsbee said to Yahoo News after the CPI data release on Friday that CPI readings are encouraging, while the service inflation remains elevated. Goolsbee argued that he wants to see further progress in inflation before supporting the restart of the monetary easing cycle.
- For more cues on the US interest rate outlook, investors will focus on the speech from Fed Governor Michelle Bowman scheduled later in the day. Fed’s Bowman has been one of the dovish policymakers in the past months.
Technical Analysis: 20-day EMA remains key barrier for US Dollar bulls
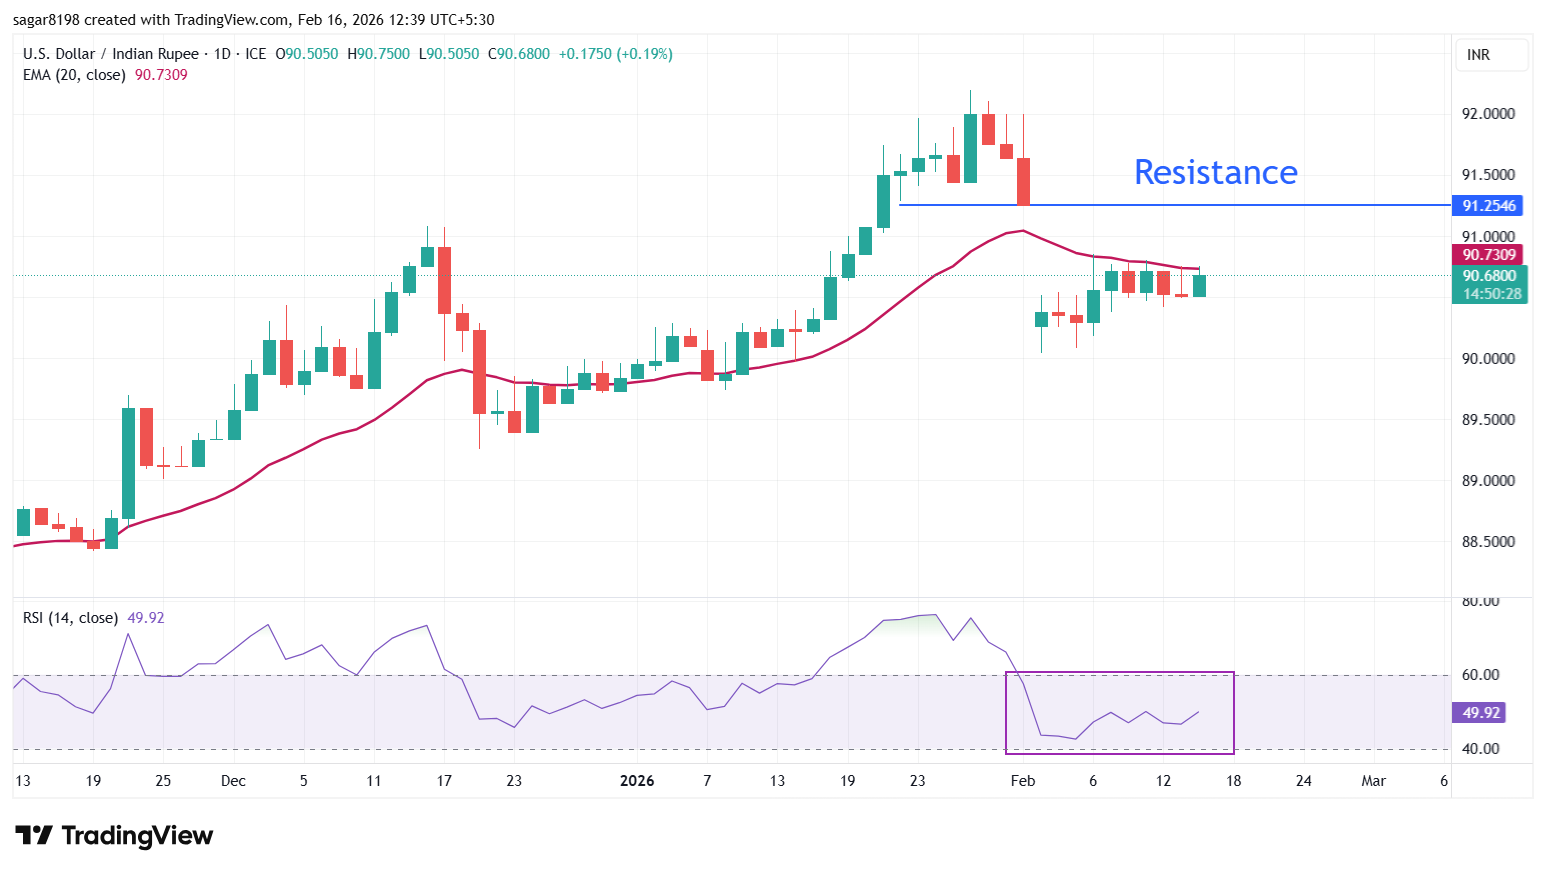
USD/INR trades higher to near 90.70 during afternoon trading hours in India on Monday. The price struggles to return above the 20-day Exponential Moving Average (EMA), which trades around 90.73.
The 14-day Relative Strength Index (RSI) wobbles inside the 40.00-60.00 range, indicating a sharp volatility contraction.
As long as the price stays below the 20-day EMA, the door for further downside towards the psychological level of 90.00 remains open. On the upside, the price could rise to the February 2 low of 91.25 once it breaks decisively above the average.
BÀI VIẾT PHỔ BIẾN
1Lãnh đạo các công ty tiền mã hóa có thể đối mặt với sự giám sát lập pháp khi Đảng Dân chủ nắm quyền kiểm soát Quốc hội27 đồng tiền mã hóa giảm mạnh nhất tuần: RAIN, ZEC, BTW dẫn đầu đà giảm khi làn sóng bán tháo trên thị trường gia tăng3Dự báo giá Ethereum: ETH vẫn dưới 2.000 USD, chịu áp lực từ lạm phát và đà suy giảm của lĩnh vực AI4Giá vàng đối mặt tuần lao dốc khi lợi suất trái phiếu Mỹ ở mức cao thúc đẩy kỳ vọng Fed tăng lãi suất5Dự báo giá bạc: XAG/USD vẫn mắc kẹt trong kênh giảm giá6Đồng franc Thụy Sĩ suy yếu trên diện rộng do sức ép từ lãi suất thấp7Quan chức Fed Daly nhận định lãi suất sẽ tiếp tục tăng khi doanh nghiệp tìm cách chuyển chi phí sang người tiêu dùng8Ông Nagel của ECB dự báo sẽ có thêm một đợt tăng lãi suất khi rủi ro lạm phát vòng hai gia tăng9Đô la Úc suy yếu do lợi suất trái phiếu Mỹ tăng và triển vọng Fed thắt chặt chính sách gây áp lực


Bắt đầu ngay!
Đăng ký và truy cập Thị trường Toàn cầu trong vòng chưa đầy 3 phút

Kết nối với chúng tôi









Liên hệ
Điện thoại: +61 2 8036 8388
Fax: +61 2 8036 8388
Email: support@tmgm.com
Website: https://www.tmgmasia.com



Thông tin được cung cấp trên trang web này chỉ mang tính chất chung và không cấu thành lời khuyên tài chính cá nhân. Trước khi hành động dựa trên bất kỳ thông tin nào trên trang web này, bạn nên cân nhắc mức độ phù hợp của thông tin đó với mục tiêu, tình hình tài chính và nhu cầu của mình. Đầu tư vào CFD và Hợp đồng Ký quỹ FX tiềm ẩn rủi ro đáng kể và không phù hợp với tất cả nhà đầu tư. Bạn có thể mất nhiều hơn khoản tiền nạp ban đầu của mình. Bạn không sở hữu hoặc có bất kỳ quyền lợi nào đối với tài sản cơ sở. Chúng tôi khuyến nghị bạn tìm kiếm tư vấn độc lập và đảm bảo rằng bạn hiểu đầy đủ các rủi ro liên quan trước khi giao dịch. Điều quan trọng là bạn phải đọc và cân nhắc tài liệu công bố thông tin trước khi mua bất kỳ sản phẩm nào được liệt kê trên trang web. Thông tin và quảng cáo được cung cấp trên trang web này không nhằm mục đích sử dụng bởi bất kỳ cá nhân nào tại bất kỳ quốc gia hoặc khu vực pháp lý nào mà việc sử dụng đó sẽ trái với luật pháp và quy định địa phương. Các Sản phẩm và Dịch vụ được cung cấp trên trang web này không dành cho cư dân Hoa Kỳ, Malaysia và Thái Lan.
TMGM được ủy quyền và quản lý tại nhiều khu vực pháp lý khác nhau.
Trademax Australia Limited, giao dịch dưới tên TMGM, được quản lý bởi Ủy ban Chứng khoán và Đầu tư Úc (ASIC), AFSL số 436416 và có trụ sở tại Tầng 28, One International Tower, 100 Barangaroo Avenue, 2000 Sydney, NSW Australia.
Email: support@tmgm.com.au
Trademax Global Limited, giao dịch dưới tên TMGM, được ủy quyền và quản lý bởi Ủy ban Dịch vụ Tài chính Vanuatu (VFSC), số đăng ký 40356 và được đăng ký tại 1276, Kumul Highway, Port Vila, Vanuatu, Cộng hòa Vanuatu.
Email: support@tmgm.com
Trademax Global Markets (SE) Limited, hoạt động dưới tên TMGM, được ủy quyền và điều chỉnh bởi Cơ quan Dịch vụ Tài chính (FSA) của Seychelles, với số giấy phép SD224. Công ty đăng ký tại Văn phòng số 13, Providence Estate ABIS Centre, Mahe, Seychelles.
Email: support@tmgm.com
Trademax Global Markets (International) Pty Ltd, giao dịch dưới tên TMGM, được ủy quyền và quản lý bởi Ủy ban Dịch vụ Tài chính, Mauritius (FSC) với giấy phép số GB22201012, và được đăng ký tại 33, Edith Cavell Street C/o IQ EQ Fund Services (Mauritius) Ltd Port Louis, 11324 Mauritius.
Email: support@tmgm.com
Bản quyền © TMGM. Tất cả quyền được bảo lưu