

Trading
Erkunden Sie eine breite Palette von Märkten mit wettbewerbsfähigen Preisen, tiefer Liquidität und fortschrittlichen Trading-Tools.
Mehr erfahren 
Plattform
Handeln Sie nahtlos mit TMGMs leistungsstarker Plattform, die für Geschwindigkeit, Präzision und ein überlegenes Trading-Erlebnis entwickelt wurde.
Mehr erfahren Trading-Plattform
Akademie
Lernen Sie die Grundlagen des Tradings mit anfängerfreundlichen Ressourcen, einschließlich Leitfäden, Webinaren und Markteinblicken.
Mehr erfahren Nachrichten & Analyse
Erhalten Sie Echtzeit-Markt-Updates und Expertenanalysen, um Trading-Gelegenheiten voraus zu sein
Mehr erfahren Nachrichten & Analyse
Über uns
Erfahren Sie, was TMGM auszeichnet — unsere globale Präsenz, regulatorische Stärke und unser Engagement für Innovation im Trading.
Mehr erfahren Warum TMGM wählen
Top Altcoins Price Forecast: Ripple, Cardano, Solana – Mild recovery signals further upside potential
- Ripple edges above $1.50 on Tuesday, ticking higher after three consecutive days of losses.
- Cardano is up nearly 3%, holding above its 200-day EMA at $0.2420 as bulls test the overhead line breakout.
- Solana hovers around $120, recovering after a 2% decline the previous day as momentum seems stretched.
Ripple (XRP), Cardano (ADA), and Solana (SOL) are trading in the green on Tuesday, recovering after a bearish start to the week. The mild recovery in Ripple and Solana aligns with steady institutional demand, while Cardano prepares for a potential bullish breakout of an overhead trendline. The technical outlook for XRP, ADA, and SOL is bullish, as the altcoins continue to sustain an upward trend for nearly two months.

Ripple and Solana ETFs record steady inflows
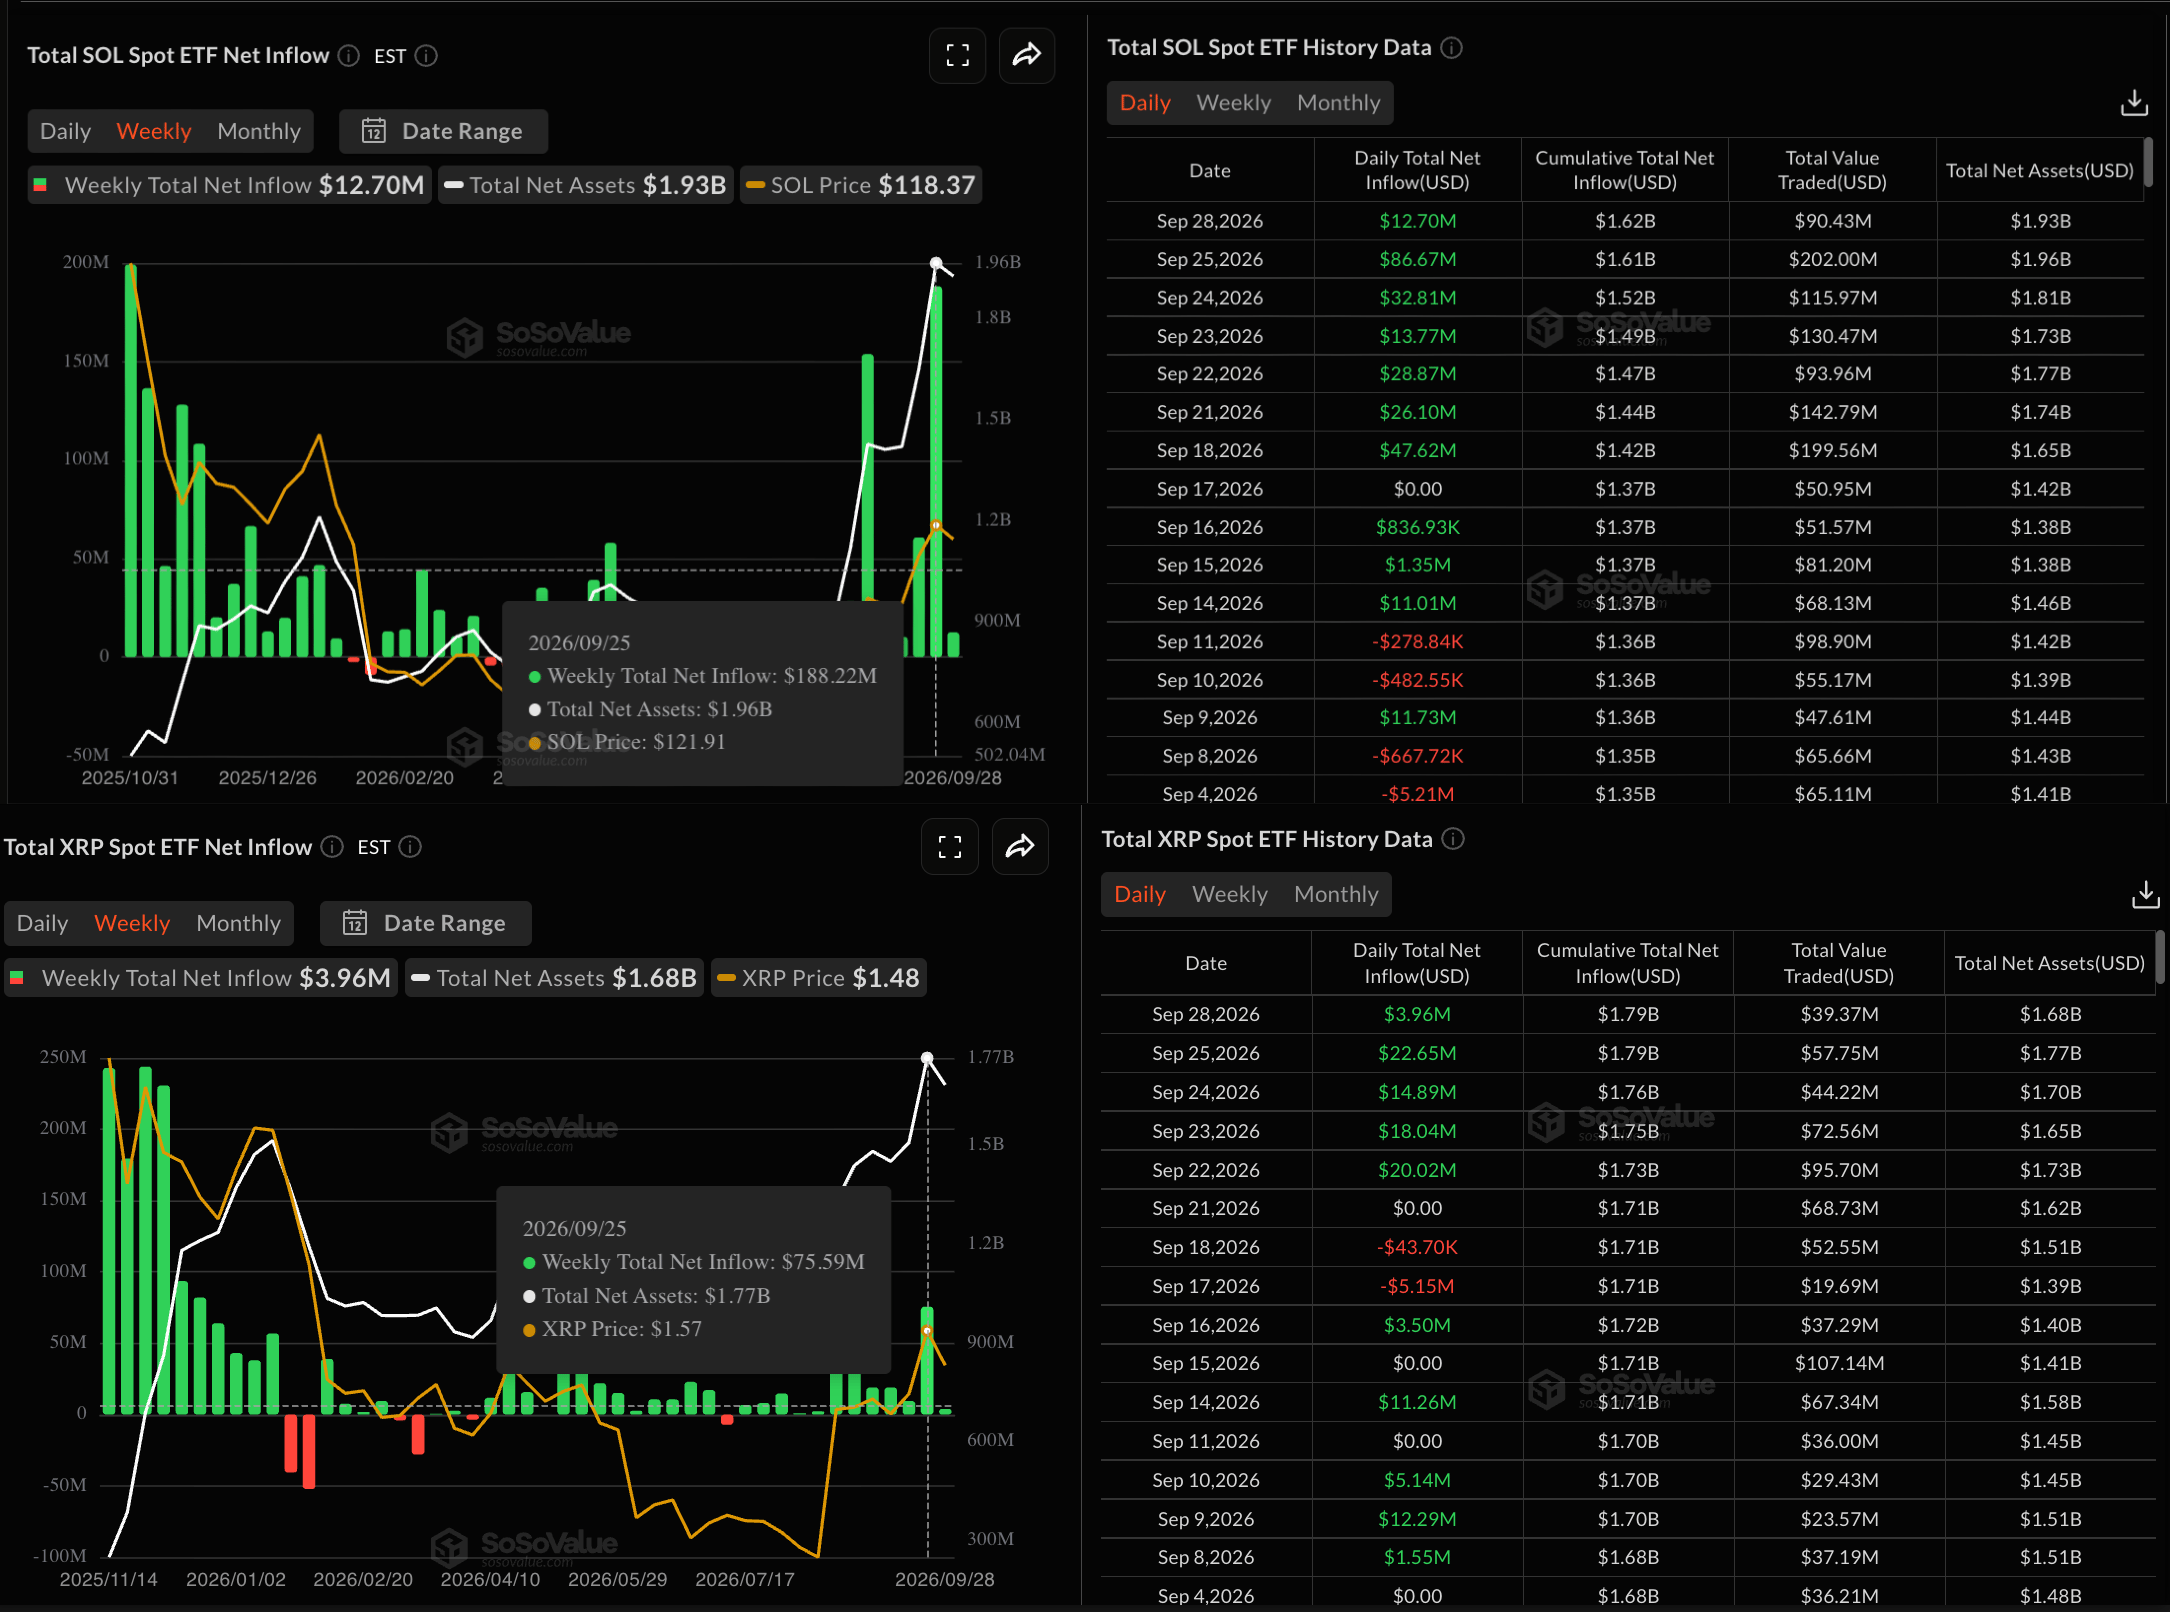
Ripple-focused ETFs recorded $3.96 million in inflows on Monday, marking their fifth consecutive day of positive inflows. The institutional demand for Ripple remains firm, following the $75.59 million influx last week. Similarly, Solana-focused ETFs recorded $12.70 million in inflows on Monday, marking their seventh consecutive day of inflows. It builds upon the $188.22 million of weekly inflow last week. Taken together, the ETF data suggests strong institutional focus, indicating that Solana and Ripple remain among the key areas of interest for institutional investors.
Ripple plans a rebound from the key support cluster
Ripple trades above at $1.5000 at press time on Tuesday, holding a constructive bullish bias as price remains above the 50-, 100-, and 200-period Exponential Moving Averages (EMAs) at $1.5016, $1.4673, and $1.4097, respectively.
From a technical perspective, the 50% retracement level, based on the downswing from $1.6999 to $1.2468, at $1.4558, reinforces the support cluster formed by rising EMAs.
The upside momentum appears moderate on the daily chart, with the Relative Strength Index (RSI) hovering near the neutral 50 level and the Moving Average Convergence Divergence (MACD) crossing just below zero.
The immediate resistance for XRP aligns with the 78.6% Fibonacci retracement level at $1.5907, which twice capped gains last week. A confirmed breakout above this level could target the $1.6999 swing high.
Cardano poised for a breakout rally
Cardano extends over 2% gains on Tuesday, above its 200-day EMA at $0.2418. The altcoin price also sits well above 50- and 100-day EMAs at $0.2172 and $0.2103, suggesting a supportive trend backdrop.
The immediate resistance cluster for Cardano aligns with the 78.6% Fibonacci retracement level, measured from $0.3136 to $0.1385, at $0.2632, and is reinforced by an overhead resistance line connecting the June 15 and July 4 highs near $0.2600. A confirmed breakout above this resistance cluster could extend its rally toward the $0.3136 swing high.
Momentum remains positive, with the RSI holding around 63, well above the midline, while the MACD holds above the signal line in the positive territory, suggesting that bullish pressure is still in play, even if the pair has started to look somewhat stretched.
On the downside, immediate support is at the 200-day EMA at $0.2481, followed by the 50-day EMA at $0.2172. Any deeper pullback could test the 50% retracement level at $0.2084, which is reinforced by the 100-day EMA at $0.2103, where buyers could potentially buy the dip.
Solana extends a solid rally, with bulls looking at $148
Solana is trading around $120 at press time on Tuesday, holding well above its 50-day, 100-day, and 200-day exponential moving averages at $102.55, $94.57, and $94.47, respectively. The long-term 100- and 200-day EMAs are on the verge of a bullish crossover, which could back the upside potential.
Momentum aligns with the upside bias, as the RSI is around 64 on the daily chart, just below the overbought threshold, while the MACD and its signal line are on the verge of a bearish crossover, suggesting moderating upside momentum.
The next notable hurdle for Solana aligns with $148.74, set by the January 13, 2026 high, projecting over 20% upside potential.
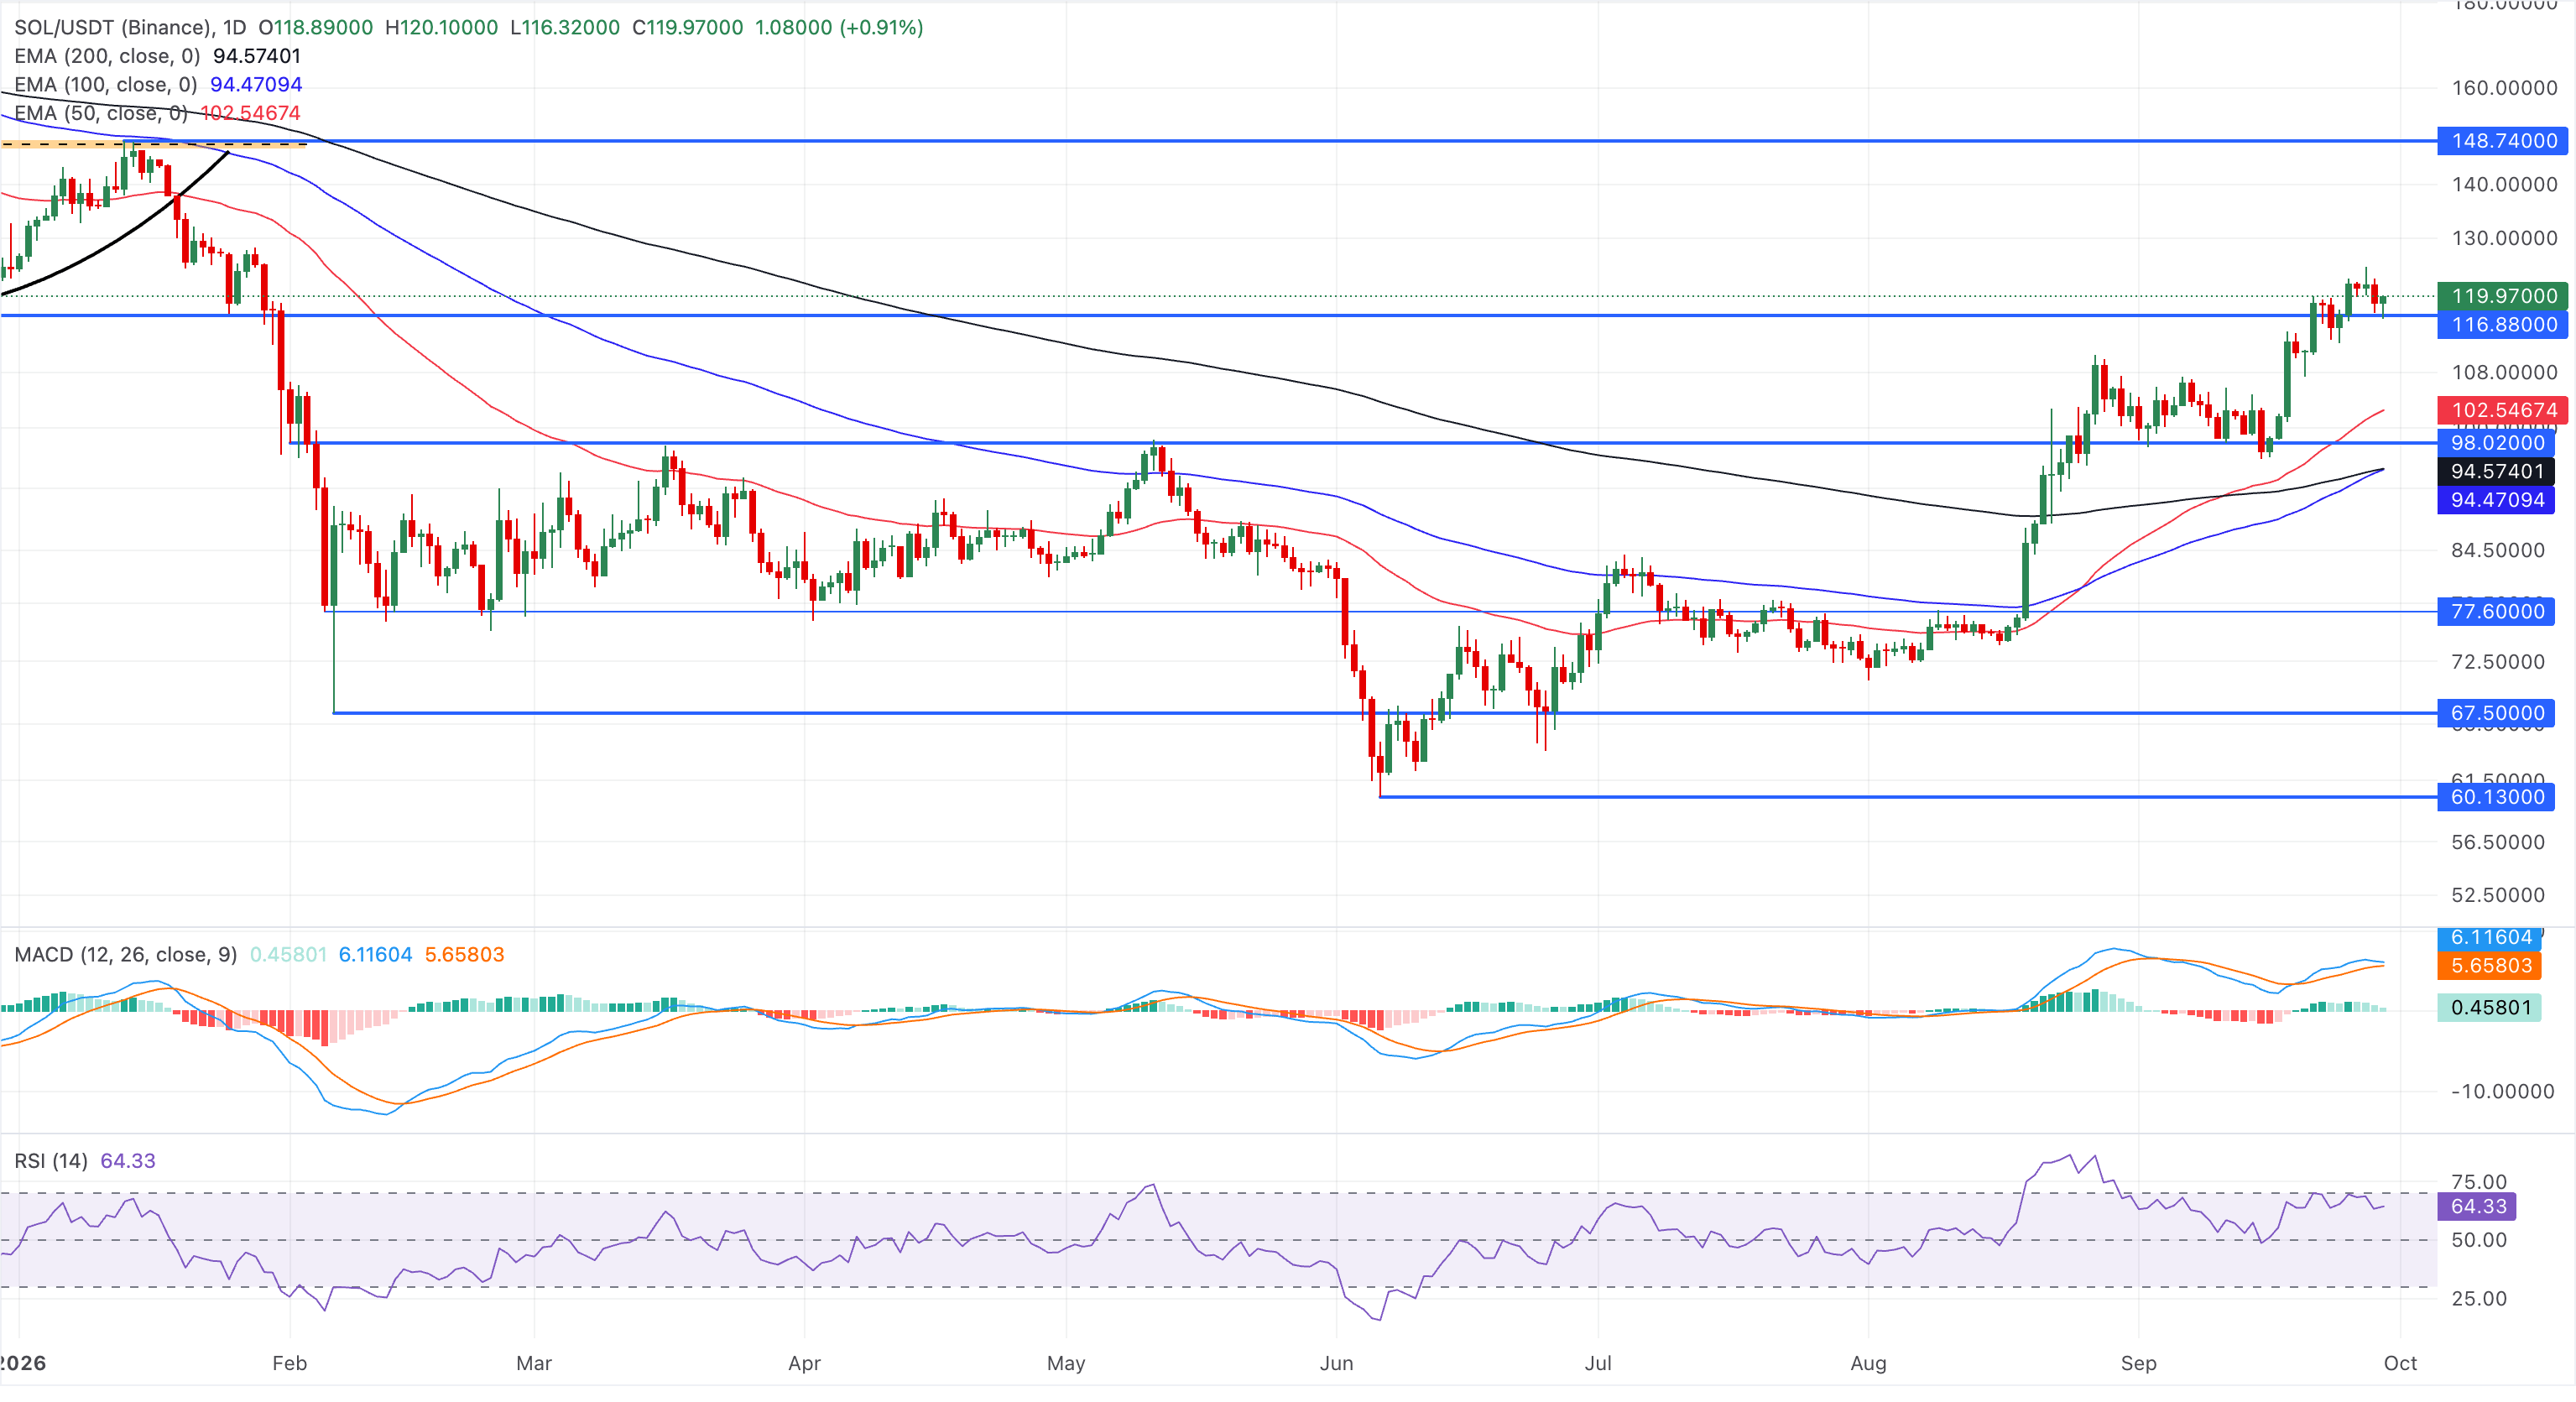
Looking down, a decisive breakdown below the $116.80 level, marked by the December 18 low, could extend the decline toward the 50-day EMA at $102.52.
(The technical analysis of this story was written with the help of an AI tool. Know more.)
BELIEBTE ARTIKEL
1ECB's Escrivá: We are still not in a restrictive territory2Silver Price Forecasts: XAG/USD holds below $ 61.00 amid US Dollar strength3GBP/JPY Price Forecast: Sellers retain control near September low4Singapore Dollar: MAS tightening expectations support resilience – OCBC5Australian Dollar: RBA hike to support AUD/USD – BBH6Euro: EUR/USD bearish bias converging on support – Societe Generale7Top Altcoins Price Forecast: Ripple, Cardano, Solana – Mild recovery signals further upside potential8US yields: Real rates climb on Fed credibility – BNY Markets9Crypto Today: Bitcoin, Ethereum, XRP correct upward amid declining ETF inflows
LIVE-KURSE

ALLES ÜBER TECHNICAL
Was ist Liquidität? Bedeutung im Trading und an den Finanzmärkten
Liquiditäts-Sweep: Bedeutung, Beispiele & Handelsstrategie
Marktstruktur im Trading: Der vollständige Leitfaden (bullisch, bärisch, seitwärts)
Charakterwechsel (CHoCH): Definition, Beispiele & Strategie
Was ist das Dark-Cloud-Cover-Muster und wie handelt man es?
Was ist das Candlestick-Muster „Piercing Line“ und wie handelt man es?
Was sind Tweezer-Top- und Tweezer-Bottom-Candlestick-Muster?
Inside-Bar-Candlestick-Muster: Was es ist, wie man es identifiziert und wie man es handelt
Candlestick-Muster „Hanging Man“: So erkennen und handeln Sie es
Jetzt loslegen!
Registrieren Sie sich und erhalten Sie in weniger als 3 Minuten Zugang zu den globalen Märkten

Verbinden Sie sich mit uns









Kontakte
Telefon: +61 2 8036 8388
Fax: +61 2 8036 8388
E-Mail: support@tmgm.com



Die auf dieser Website bereitgestellten Informationen sind ausschließlich allgemeiner Natur und stellen keine persönliche Finanzberatung dar. Bevor Sie auf Grundlage von Informationen auf dieser Website handeln, sollten Sie die Eignung dieser Informationen im Hinblick auf Ihre Ziele, Ihre finanzielle Situation und Ihre Bedürfnisse prüfen. Investitionen in CFDs und FX-Margin-Kontrakte sind mit erheblichen Risiken verbunden und nicht für alle Anleger geeignet. Sie können mehr als Ihre ursprüngliche Einzahlung verlieren. Sie besitzen weder das zugrunde liegende Vermögenswert noch haben Sie ein Interesse daran. Wir empfehlen Ihnen, unabhängigen Rat einzuholen und sicherzustellen, dass Sie die damit verbundenen Risiken vor dem Handel vollständig verstehen. Es ist wichtig, dass Sie das Offenlegungsdokument lesen und berücksichtigen, bevor Sie ein auf der Website aufgeführtes Produkt erwerben. Die auf dieser Website angebotenen Informationen und Werbeanzeigen sind nicht für die Nutzung durch Personen in Ländern oder Rechtsordnungen bestimmt, in denen eine solche Nutzung gegen lokale Gesetze und Vorschriften verstoßen würde. Die auf dieser Website angebotenen Produkte und Dienstleistungen sind nicht für Einwohner der Vereinigten Staaten, Malaysias und Thailands bestimmt.
TMGM ist in verschiedenen Gerichtsbarkeiten autorisiert und reguliert.
Trademax Australia Limited, handelnd als TMGM, wird von der Australian Securities and Investments Commission (ASIC) reguliert, AFSL Nr. 436416 und befindet sich in Level 28, One International Tower, 100 Barangaroo Avenue, 2000 Sydney, NSW Australien.
E-Mail: support@tmgm.com.au
Trademax Global Limited, handelnd als TMGM, ist von der Vanuatu Financial Services Commission (VFSC) autorisiert und reguliert, Registrierungsnummer 40356 und registriert unter 1276, Kumul Highway, Port Vila, Vanuatu, Republik Vanuatu.
E-Mail: support@tmgm.com
Die Trademax Global Markets (SE) Limited, tätig unter dem Namen TMGM, ist durch die Financial Services Authority (FSA) der Seychellen autorisiert und reguliert, Lizenznummer SD224. Das Unternehmen ist registriert im Büro Nr. 13, Providence Estate ABIS Centre, Mahé, Seychellen.
E-Mail: support@tmgm.com
Trademax Global Markets (International) Pty Ltd, handelnd als TMGM, ist von der Financial Services Commission, Mauritius (FSC) autorisiert und reguliert mit der Lizenznummer GB22201012 und registriert unter 33, Edith Cavell Street C/o IQ EQ Fund Services (Mauritius) Ltd Port Louis, 11324 Mauritius.
E-Mail: support@tmgm.com
Copyright © TMGM. Alle Rechte vorbehalten