


Key Takeaways
Bearish Reversal: The classic head and shoulders setup is a bearish reversal most reliable after a clear uptrend, while the inverted variant is typically bullish after a downtrend.
How to trade Head and Shoulders: Clean structure like symmetry of formation helps, but the real edge comes from neckline behavior, breakout confirmation rules, and understanding where liquidity sits via volume price analysis.
Targets are usually derived from the head to neckline distance, but professionals rely on filters like solid support zones, volatility behaviour, liquidity and event risk.
The inverse head and shoulders pattern and inverted head and shoulders pattern are not “different patterns” mechanically, just the mirrored psychology.
Confluence tools (neckline breaking, candlestick close beyond support, multi timeframe levels, momentum, volume profile) increase signal quality, but they do not replace strict risk control.
What is the Head and Shoulder Pattern in Chart Pattern Trading?
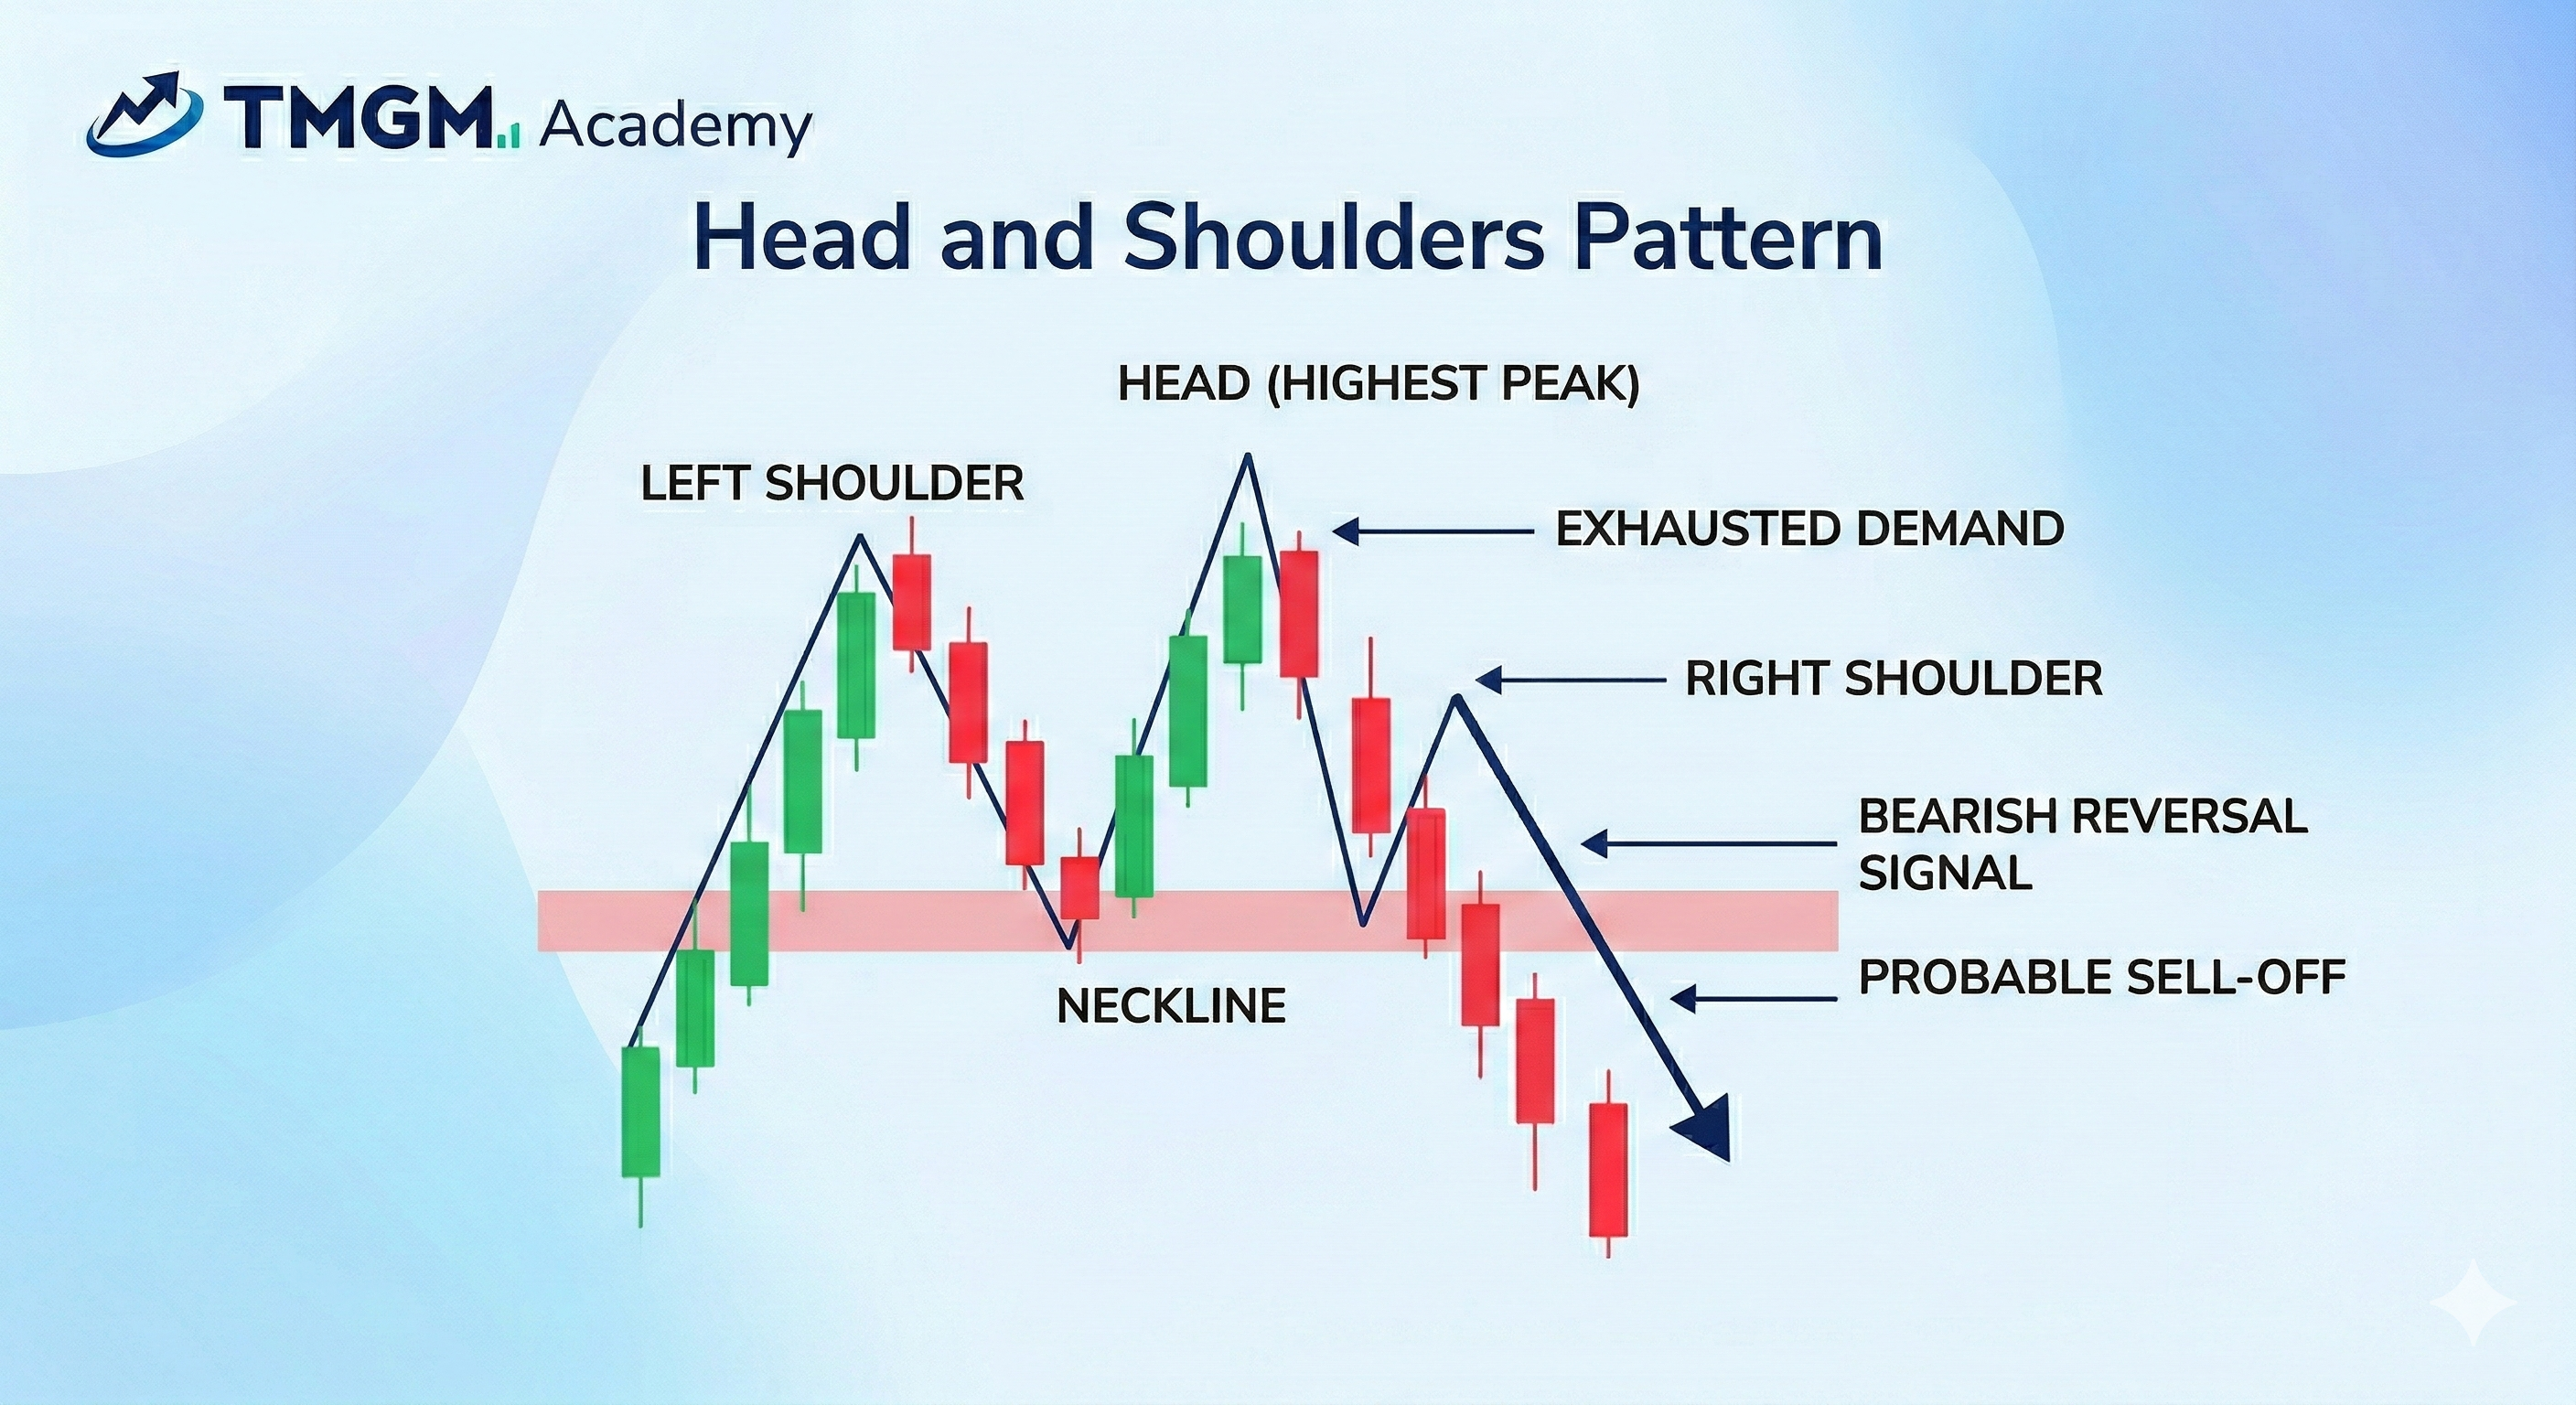
The head and shoulders pattern forms when an uptrend loses strength, fails to make a new high, and breaks support. The pattern forms when price makes a peak (left shoulder), pushes to a higher peak (head), then fails to exceed that high (right shoulder), and finally breaks the neckline. Traders treat the neckline break as the “decision point” where control shifts from buyers to sellers.
Important: A head and shoulders is not confirmed until there is a break and close beyond the neckline, otherwise it is just a visual guess.
Head and Shoulders Pattern Components and Pattern Anatomy
Pre-Requisite: Prior Trend
The pattern is more reliable when it appears after a well established uptrend with extended positioning (multiple impulsive legs up, rising moving averages, strong prior momentum). In choppy ranges, head and shoulders shapes appear frequently, behaving like noise and is less reliable.
Component: Pattern Structure
A clean structure is three peaks with the head clearly higher than the shoulders and a neckline that is identifiable across multiple touches. Symmetry is helpful, but the true reliable tell is that the right shoulder fails to attract fresh buyers at the same intensity as the left side.
Peaks:
The anatomy requires three distinct peaks: a Left Shoulder (an initial high), a Head (a higher high showing a final thrust of buying pressure), and a Right Shoulder (a lower high). This sequence demonstrates a critical failure to maintain the bullish market structure.
Neckline:
The neckline acts as the structural foundation, drawn by connecting the swing lows between the three peaks. A definitive close below this dynamic support line is the ultimate trigger that confirms the pattern's completion.
Volume:
Volume analysis is non-negotiable for professional traders validating this setup. You should observe peak volume on the left shoulder, slightly lower volume on the head, and a significant drop in buying volume on the right shoulder, or even significant sell volume as bullish participation evaporates.
Pro Tip: True pattern validation requires a noticeable volume contraction during the right shoulder's formation, indicating that aggressive buyers are entirely exhausted.
Double-Checking Pattern Structure
Useful Checks includes:
Neckline aligning with a key horizontal level,
Momentum divergence at the head
Rejection wicks at the right shoulder
A break that aligns with higher timeframe structure.
Standard vs. Inverted Head and Shoulders Pattern
While the standard pattern is a topping signal, the inverted head and shoulders pattern forms at the bottom of a downtrend, hence signaling a trend reversal turning bullish.
Also commonly referred to as the inverse head and shoulders pattern, this bullish structure represents Investors accumulation. The psychology mirrors the standard pattern but in reverse: sellers fail to push prices into a lower low on the right shoulder, signaling that the supply overhang has been absorbed by enough buyers.
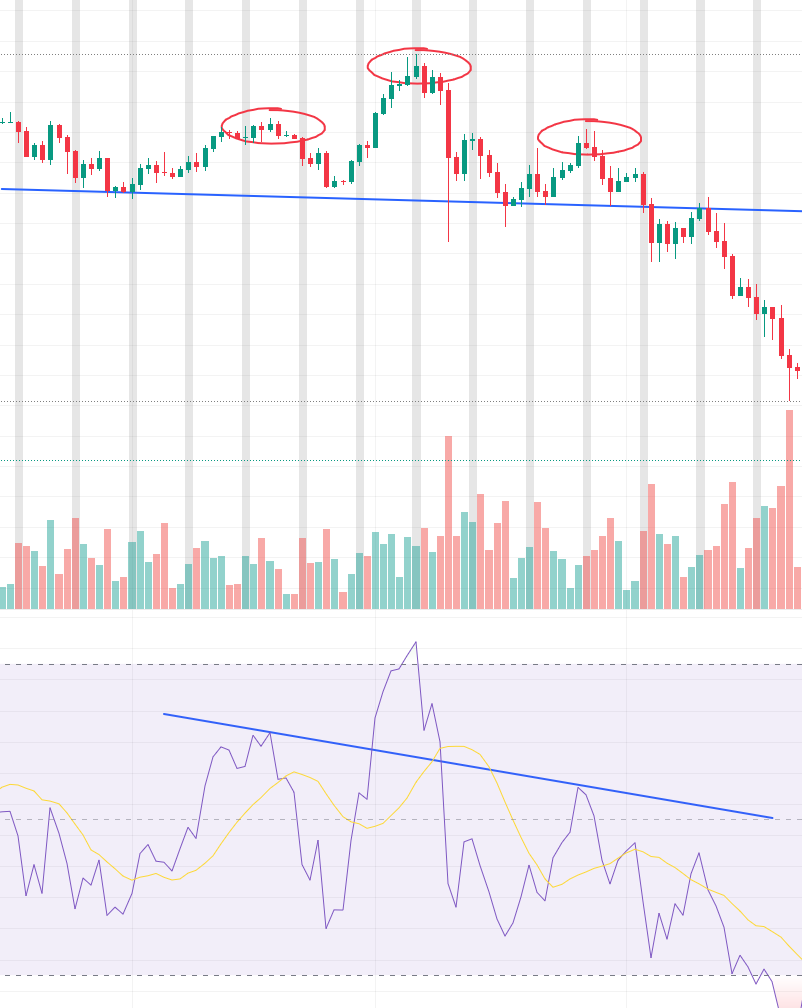
How to read Multiple Heads and Shoulders
In complex market environments, you may encounter formations with multiple left or right shoulders. When trading these complex structures, Confluence becomes critical; confirming signals like RSI bearish divergence or a bearish MACD crossover are extremely helpful to help filter out false breakdowns.
Market Behaviour & Psychology Behind Head & Shoulders Pattern
At its core, the head and shoulders pattern shows a shift from trend continuation to distribution and, eventually, a break of support. The head marks the final push to a higher high, while the right shoulder shows weakening demand as buyers fail to push price higher again. As momentum fades, early longs take profit, late buyers become trapped, and sellers gain confidence. Once the neckline breaks, stop losses and systematic sell orders can add downside momentum.
Several market forces can drive a head and shoulders pattern, and more than one may be active at the same time.
Institutional Distribution
Large participants may reduce exposure into strength to secure better selling prices. As demand fades near the top, price struggles to sustain higher highs and the right shoulder begins to form.
Traders Taking Profit, while Buyers are no longer Entering
As the trend matures, more traders lock in gains and fewer buyers are willing to enter at elevated prices. That weaker demand often appears in the right shoulder, where price can no longer extend the uptrend.
Selling Pressure from Previously Trapped Investors
Once price breaks the neckline, late buyers caught near the top may exit on bouncebacks. That overhead supply can turn the neckline retest into resistance and add pressure to the downside move.
Change in Fundamentals or Major News
A shift in earnings expectations, macro data, or major news can change sentiment quickly. When that shift happens near an exhausted uptrend, it can help trigger the reversal.
How to Trade using Head and Shoulders Pattern? Original Research: Case Study
This step by step case study uses real price data from a live chart to show how a disciplined trader can confirm a head and shoulders setup, then plan entry, stop loss, target, and position risk.
First, identify a clear head and shoulders structure with three distinct peaks, one head and two shoulders, supported by a well defined neckline.
A conservative entry can be taken after that close if price does not immediately reclaim the level on the next candle, while a more selective entry waits for a retest of the neckline that rejects and closes back below support. An initial target can be estimated by measuring the distance from the head to the neckline and projecting it from the breakout point, but a more practical objective should also account for major support, product volatility, and whether the setup still offers a sound reward to risk ratio.
A common stop loss level sits above the right shoulder high, often with a small ATR buffer to reduce stop outs, while aggressive entries taken earlier require tighter invalidation if price reclaims the shoulder. Position size should be set so the stop represents a fixed risk unit, and once the trade reaches the first profit objective, traders can reduce part of the position and trail the remainder behind lower highs. If spreads widen or liquidity thins during news or rollover, slippage risk rises and leverage should be reduced.
How to Read & Confirm Head and Shoulders Chart Pattern?
Confirmation should develop in sequence: momentum weakens on the right shoulder as price prints lower highs and lower lows, sell side volume builds after the head, RSI forms a lower momentum peak, and the pattern is confirmed only when a candle breaks and closes decisively below the neckline.
Head and Shoulders Reversal Trading Strategy
A head and shoulders reversal trading strategy is built on one core idea: a mature trend starts to fail, price loses the ability to continue making stronger swings, and the neckline becomes the key decision level. The bearish version appears after an uptrend in the standard pattern, while the bullish version appears after a downtrend in the inverted pattern. In both cases, the best setups combine clean structure, a decisive neckline break, and disciplined risk control.
Bullish Reversal
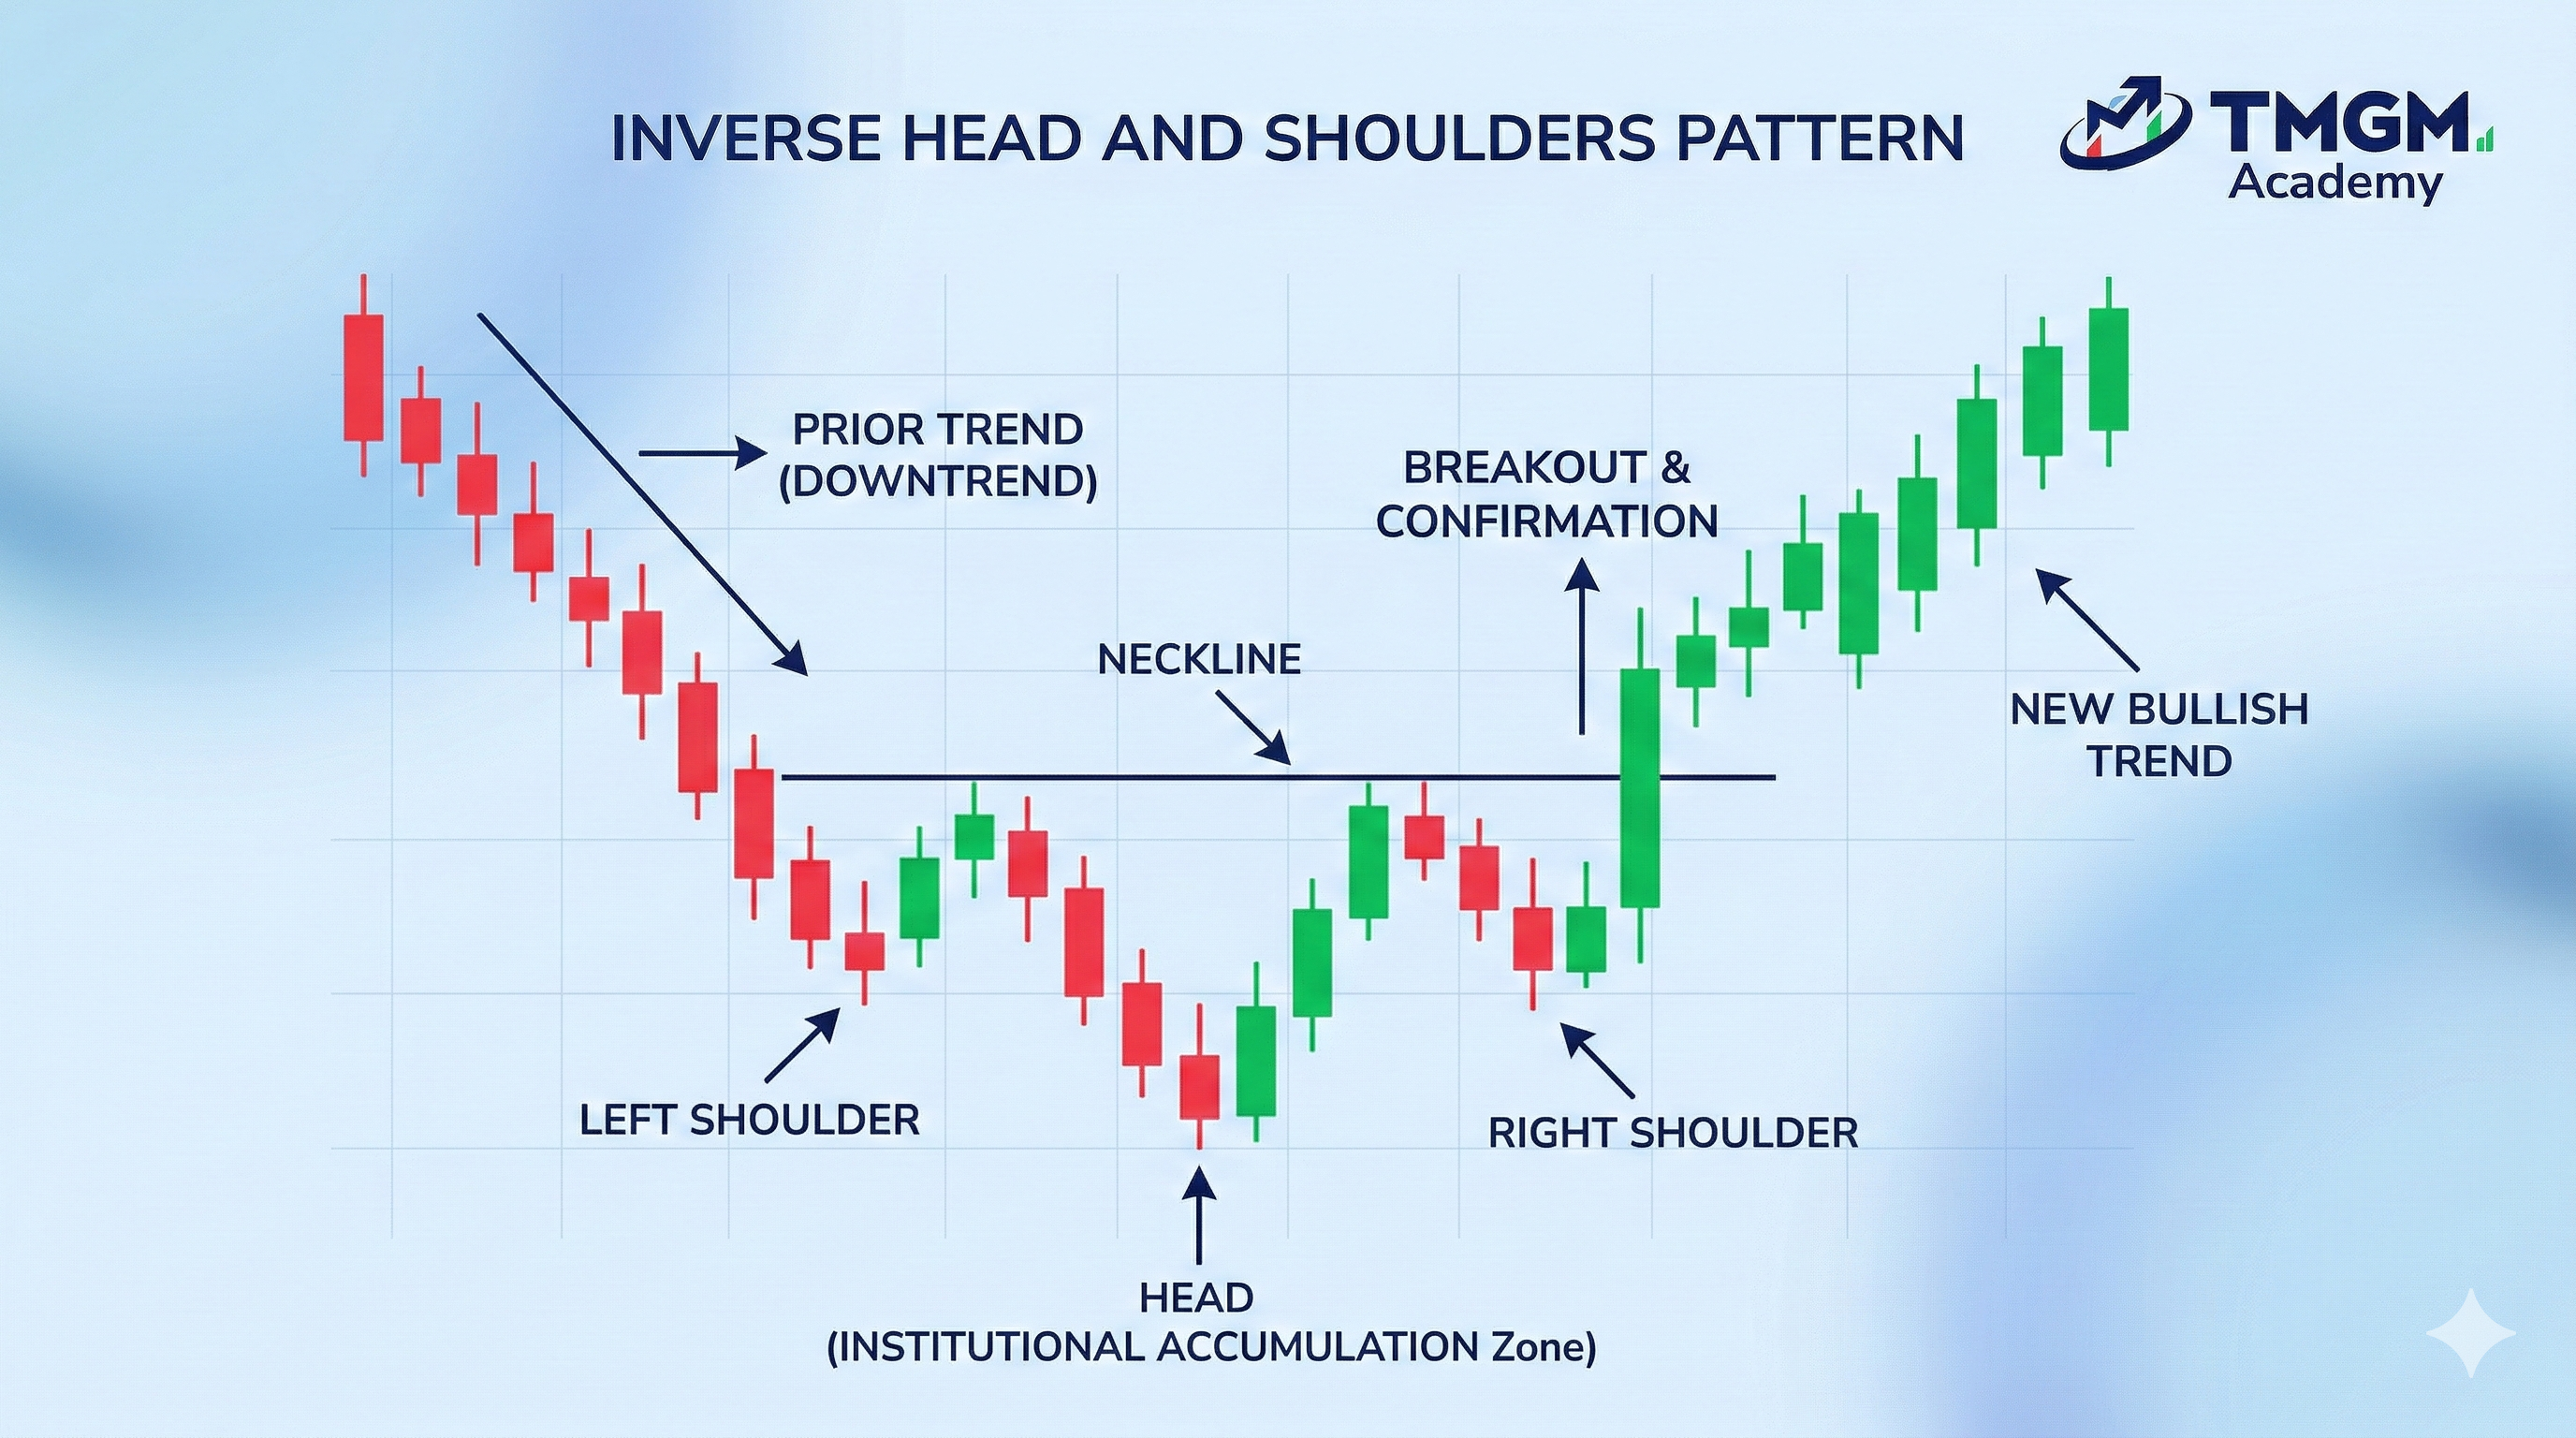
An inverted head and shoulders is a bullish reversal strategy that forms after a clear downtrend. Price creates an initial low (left shoulder), pushes into a deeper low that becomes the head, then forms a higher low on the right shoulder. This matters because it shows that sellers were still able to force one final move lower, but they could no longer maintain the same downside pressure on the next attempt.
The neckline acts as the trigger level for the reversal. A bullish setup becomes stronger when the right shoulder price closes above the neckline with improving momentum, stronger buying participation, or a successful retest that holds as support. More conservative traders often prefer the retest because it reduces the chance of chasing a breakout that immediately fades.
A practical bullish reversal plan usually follows this structure:
Confirm that the market was in a real prior downtrend, not just moving sideways with short term weakness.
Check that the right shoulder holds above the head, showing that selling pressure is fading.
Use the neckline breakout or a successful neckline retest as the entry trigger.
Place the stop below the right shoulder low, or below the retest low if the entry is taken after confirmation.
Estimate the initial target using the distance from the head to the neckline, then compare that projection with nearby resistance and current volatility.
Pro Tips: The bullish reversal tends to work best when downside momentum has clearly weakened before the breakout. If the neckline breaks with poor follow through, low conviction, or directly into major resistance, the quality of the setup drops.
Bearish Reversal

The standard head and shoulders is a bearish reversal strategy that forms after a well established uptrend. Price creates the left shoulder, extends into a higher high that becomes the head, then fails to print another higher high on the right shoulder. That failure is the important shift because it shows buyers are no longer able to push trend continuation with the same strength.
The neckline is the confirmation level. A bearish setup becomes more actionable when price closes below that support and sellers keep control instead of allowing an immediate reclaim. Some traders enter on the actual neckline break, while others prefer to wait for a bounce back into the neckline that fails and turns former support into resistance.
A practical bearish reversal plan usually follows this structure:
Confirm that the pattern formed after a mature uptrend, not inside a choppy range.
Check for weaker momentum, lower quality buying pressure, or rejection around the right shoulder.
Use the neckline break or the failed retest of the neckline as the entry trigger.
Place the stop above the right shoulder high, allowing enough room for normal volatility.
Estimate the initial target using the distance from the head to the neckline, then refine it with major support levels, liquidity zones, and market conditions.
The bearish reversal is often strongest when the pattern forms near a major higher timeframe resistance zone or after an extended trend where late buyers are vulnerable to getting trapped. Once the neckline breaks, profit taking, stop loss selling, and fresh short positioning can all accelerate the move.
Important: In both bullish and bearish reversals, the neckline break confirms the pattern, but the shape alone is never enough. Trade quality still depends on prior trend, breakout behaviour, location, and how price responds after confirmation.
Advantages and Disadvantages of the Head and Shoulders Pattern
The head and shoulders pattern is popular because it gives traders a clear reversal framework with a visible confirmation point, logical invalidation, and measurable target. However, the pattern is not valuable just because the shape looks clean. Its real strength comes from context, neckline behaviour, volume, and whether the breakout happens in the right market environment.
| Advantages | Disadvantages |
|---|---|
| Clarity: Traders can usually identify the left shoulder, head, right shoulder, and neckline without complex tools, which makes the setup easier to plan than many other reversal structures. | Early anticipation risk: A chart may look like a head and shoulders, but without a decisive neckline break and close, the pattern is not confirmed and price may continue in the original trend. |
| Clear risk definition: Once the neckline breaks, the right shoulder often becomes a practical invalidation level, helping traders place stop loss levels with a clear structural reason. | False breakdowns: In choppy or low conviction markets, price can break the neckline briefly, trigger entries, then reverse back above support and invalidate the setup. |
| Simple target framework: Traders can estimate a measured move by projecting the distance from the head to the neckline from the breakout point, which helps assess risk reward potential. | Subjective interpretation: Traders may draw the neckline differently, judge shoulder symmetry differently, or disagree on whether the prior trend was strong enough to make the pattern meaningful. |
| Flexibility across markets and timeframes: The same structural logic can appear in forex, gold, crypto, stocks, and indices, although signal quality still depends on context. | Volume is not equally dependable in every market: In some instruments, traders need to rely more on price action, market structure, and confluence rather than volume alone. |
Important: A head and shoulders pattern is a framework, not a guarantee. A clean shape improves readability, but confirmation and risk control still determine trade quality.
Head and Shoulders Pattern Reliability, Limitations and Key Trading Considerations
The head and shoulders pattern can be reliable when it forms after a clear trend, develops with a well defined neckline, and breaks with confirmation. Its reliability drops sharply in sideways conditions, weak trend environments, and setups where traders enter before the market proves the reversal. In practice, the pattern works best as a structured decision making tool rather than a standalone signal.
Reliability
The pattern tends to be more reliable when it appears after an extended uptrend in the standard version, or after a clear downtrend in the inverted version. In both cases, the setup is more meaningful when it signals real trend fatigue rather than random price movement inside a range.
A well respected neckline also improves reliability. The more clearly the swing lows define support, the more important the break becomes. Reliability increases further when the breakout candle closes decisively beyond the neckline instead of only wicking through it.
Confluence improves signal quality. Momentum divergence, slowing upside pressure, rejection at the right shoulder, higher timeframe resistance, and stronger sell side participation can all support the bearish case. These factors do not guarantee follow through, but they improve the odds that the pattern reflects a genuine shift in control.
Limitations
One limitation is that the pattern often appears visually before it becomes tradable. Many failed trades come from entering during the right shoulder simply because the shape looks complete. Until the neckline breaks, the pattern remains unconfirmed.
Another limitation is that measured move targets are only a guide. Price does not always travel the full head to neckline distance, especially when major support, event risk, or strong countertrend liquidity sits below the breakout area.
The pattern is also less dependable in compressed, news driven, or thin liquidity conditions. Sudden volatility can distort the structure, create slippage around the neckline, or trigger both sides before the market chooses direction.
Lower timeframes create another limitation. Head and shoulders formations appear more often there, but many are simply noise. Without higher timeframe context, traders can end up reacting to minor swings that do not represent a true reversal.
Key Trading Considerations
Traders should first check whether a real prior trend exists. A head and shoulders pattern forming after an established uptrend is far more meaningful than a similar shape developing inside a sideways range.
Neckline behaviour should be treated as the key decision point. A decisive close beyond the neckline is stronger than an intraday break, and a failed retest can often offer a cleaner entry than chasing the first breakout candle.
Volume and momentum should be judged in context. Declining buying pressure into the head and right shoulder, or stronger sell side activity on the break, can improve confidence. However, price structure still matters more than any single indicator reading.
Risk should be planned before the trade is opened. Traders should know where the setup is invalidated, what the realistic target area is, and whether the risk reward ratio still makes sense after spreads, volatility, and possible slippage are considered.
Pro Tip: The best head and shoulders trades usually do not come from the most dramatic shape. They come from the setups where trend context, neckline structure, breakout confirmation, and trade location all align.
FAQ (People Also Ask)
1) Is head and shoulder pattern bullish?
The standard head and shoulders pattern is usually bearish because it signals a possible reversal after an uptrend. The inverse head and shoulders pattern is the bullish version and typically forms after a downtrend.
2) What does a head and shoulders pattern indicate?
A head and shoulders pattern indicates that trend momentum is weakening and control may be shifting from buyers to sellers. In the standard pattern, a break below the neckline can confirm a bearish reversal.
3) What will happen after a head and shoulders pattern?
After a confirmed head and shoulders pattern, price often moves in the direction of the neckline break, but the outcome depends on volume, market context, and nearby support or resistance. If the break fails, price may return to the prior range instead of continuing the reversal.
4) What is inverse head and shoulders pattern?
An inverse head and shoulders pattern is the bullish mirror image of the standard head and shoulders setup. It usually forms after a downtrend and can signal a reversal higher once price breaks above the neckline.


