


Gold Price History in India: The Last 10 Years
The gold price chart India 10 year history went from ₹26,000 in 2016 to ₹1,46,160 - ₹1,56,070 per 10 grams in 2026.
In 2014, the average price of gold hovered around ₹28,000 per 10 grams. By 2020, gold had surged above ₹50,000, largely due to global uncertainty from the pandemic.
The 2024 gold price in India was significantly different than other years as the data shows that gold reached around ₹77,913 per 10 grams making it one of the biggest appreciation in history.
The latest 2026 benchmark point is even higher at around ₹1,56,070 per 10 grams, though this should be read as a current benchmark rate rather than a completed annual average.
Over the last decade, gold has seen significant shifts influenced by global economic events, inflation trends, and currency fluctuations. By studying the past, traders can better anticipate potential future movements and make more informed trading decisions.
This consistent growth demonstrates why Indian households and traders view gold as a long-term store of value.
Gold Price next 10 years in Indian Rupees
By 2030, analysts and market experts project that 24-karat gold price in India will trade in a base range of ₹1,60,000 to ₹2,25,000 per 10 grams, with aggressive bullish forecasts suggesting it could potentially touch ₹3,000,000 if global macroeconomic pressures accelerate.
Historical Gold Rate in India (Year-by-Year Breakdown)
Gold prices in India have increased sharply over the long term, but yearly gold price data should be read carefully because historical averages and live gold rates measure different things. The table below uses 24K gold price per 10 grams as the standard comparison unit.
For completed years, the price shown is the annual average gold price. For the current year, the price should not be treated as a full year average because 2026 is still in progress. The latest 2026 figure is shown separately as a current benchmark rate, based on the latest available bullion market update.
Historical Gold Rate in India Year Wise — 24K Gold Price in India (₹ per 10g, annual average)
Gold Rate Year Wise — 24K Gold Price in India (₹ per 10g, annual average)
| Financial Year | 24K Gold Rate (₹ per 10g) | YoY Change | Data Basis |
|---|---|---|---|
| 1964-65 | ₹63.25 | — | Annual average |
| 1965-66 | ₹71.75 | +13.4% | Annual average |
| 1966-67 | ₹83.75 | +16.7% | Annual average |
| 1967-68 | ₹102.50 | +22.4% | Annual average |
| 1968-69 | ₹162.00 | +58.0% | Annual average |
| 1969-70 | ₹176.00 | +8.6% | Annual average |
| 1970-71 | ₹184.00 | +4.5% | Annual average |
| 1971-72 | ₹193.00 | +4.9% | Annual average |
| 1972-73 | ₹242.57 | +25.7% | Annual average |
| 1973-74 | ₹369.33 | +52.3% | Annual average |
| 1974-75 | ₹519.19 | +40.6% | Annual average |
| 1975-76 | ₹545.21 | +5.0% | Annual average |
| 1976-77 | ₹549.82 | +0.8% | Annual average |
| 1977-78 | ₹637.93 | +16.0% | Annual average |
| 1978-79 | ₹791.22 | +24.0% | Annual average |
| 1979-80 | ₹1,158.75 | +46.5% | Annual average |
| 1980-81 | ₹1,522.44 | +31.4% | Annual average |
| 1981-82 | ₹1,719.17 | +12.9% | Annual average |
| 1982-83 | ₹1,722.54 | +0.2% | Annual average |
| 1983-84 | ₹1,858.47 | +7.9% | Annual average |
| 1984-85 | ₹1,983.92 | +6.8% | Annual average |
| 1985-86 | ₹2,125.47 | +7.1% | Annual average |
| 1986-87 | ₹2,323.49 | +9.3% | Annual average |
| 1987-88 | ₹3,082.43 | +32.7% | Annual average |
| 1988-89 | ₹3,175.22 | +3.0% | Annual average |
| 1989-90 | ₹3,229.33 | +1.7% | Annual average |
| 1990-91 | ₹3,451.52 | +6.9% | Annual average |
| 1991-92 | ₹4,297.63 | +24.5% | Annual average |
| 1992-93 | ₹4,103.66 | -4.5% | Annual average |
| 1993-94 | ₹4,531.87 | +10.4% | Annual average |
| 1994-95 | ₹4,667.24 | +3.0% | Annual average |
| 1995-96 | ₹4,957.60 | +6.2% | Annual average |
| 1996-97 | ₹5,070.71 | +2.3% | Annual average |
| 1997-98 | ₹4,347.07 | -14.3% | Annual average |
| 1998-99 | ₹4,268.17 | -1.8% | Annual average |
| 1999-00 | ₹4,393.56 | +2.9% | Annual average |
| 2000-01 | ₹4,473.60 | +1.8% | Annual average |
| 2001-02 | ₹4,579.12 | +2.4% | Annual average |
| 2002-03 | ₹5,332.36 | +16.4% | Annual average |
| 2003-04 | ₹5,718.95 | +7.2% | Annual average |
| 2004-05 | ₹6,145.38 | +7.5% | Annual average |
| 2005-06 | ₹6,900.56 | +12.3% | Annual average |
| 2006-07 | ₹9,240.32 | +33.9% | Annual average |
| 2007-08 | ₹9,995.62 | +8.2% | Annual average |
| 2008-09 | ₹12,889.74 | +29.0% | Annual average |
| 2009-10 | ₹15,756.09 | +22.2% | Annual average |
| 2010-11 | ₹19,227.08 | +22.0% | Annual average |
| 2011-12 | ₹25,722.42 | +33.8% | Annual average |
| 2012-13 | ₹30,163.93 | +17.3% | Annual average |
| 2013-14 | ₹29,190.39 | -3.2% | Annual average |
| 2014-15 | ₹27,414.55 | -6.1% | Annual average |
| 2015-16 | ₹26,534.26 | -3.2% | Annual average |
| 2016-17 | ₹29,665.28 | +11.8% | Annual average |
| 2017-18 | ₹29,300.08 | -1.2% | Annual average |
| 2018-19 | ₹31,193.41 | +6.5% | Annual average |
| 2019-20 | ₹37,017.91 | +18.7% | Annual average |
| 2020-21 | ₹48,723.22 | +31.6% | Annual average |
| 2021-22 | ₹47,999.25 | -1.5% | Annual average |
| 2022-23 | ₹52,730.77 | +9.9% | Annual average |
| 2023-24 | ₹60,623.95 | +15.0% | Annual average |
| 2024-25 | ₹75,841.87 | +25.1% | Annual average |
| 2025-26 | ₹1,46,160.00 | +92.7% | Completed year average |
| 2026-27* | Competitor benchmark: ₹1,56,070, Latest consensus (3 Aug 2026): ₹1,43,000–₹1,44,000 | Provisional | In-progress year — benchmark vs. market consensus |
* FY 2026–27 is still in progress, so its figures are provisional: the table shows the competitor’s latest published benchmark of ₹1,56,070 per 10g alongside the current market consensus of about ₹1,43,000–₹1,44,000 per 10g for 24K gold—averaged across major Indian rate trackers as of 3 August 2026—which is running roughly 8% below that benchmark and will be replaced by a full-year average once the year closes.
FY 2026–27 is still in progress, so its figures are provisional: the table shows the competitor's latest published benchmark of ₹1,56,070 per 10g alongside the current market consensus of about ₹1,43,000–₹1,44,000 per 10g for 24K gold—averaged across major Indian rate trackers as of 3 August 2026—which is running roughly 8% below that benchmark and will be replaced by a full-year average once the year closes.
Important Note on 2026 Gold Price Trend Data
The 2026 gold price trend should be labelled as a current or latest benchmark rate, not an annual average. A full year average for 2026 can only be calculated after the year ends. For this reason, 2026 should be shown separately from the historical gold rate trend in India table.
.
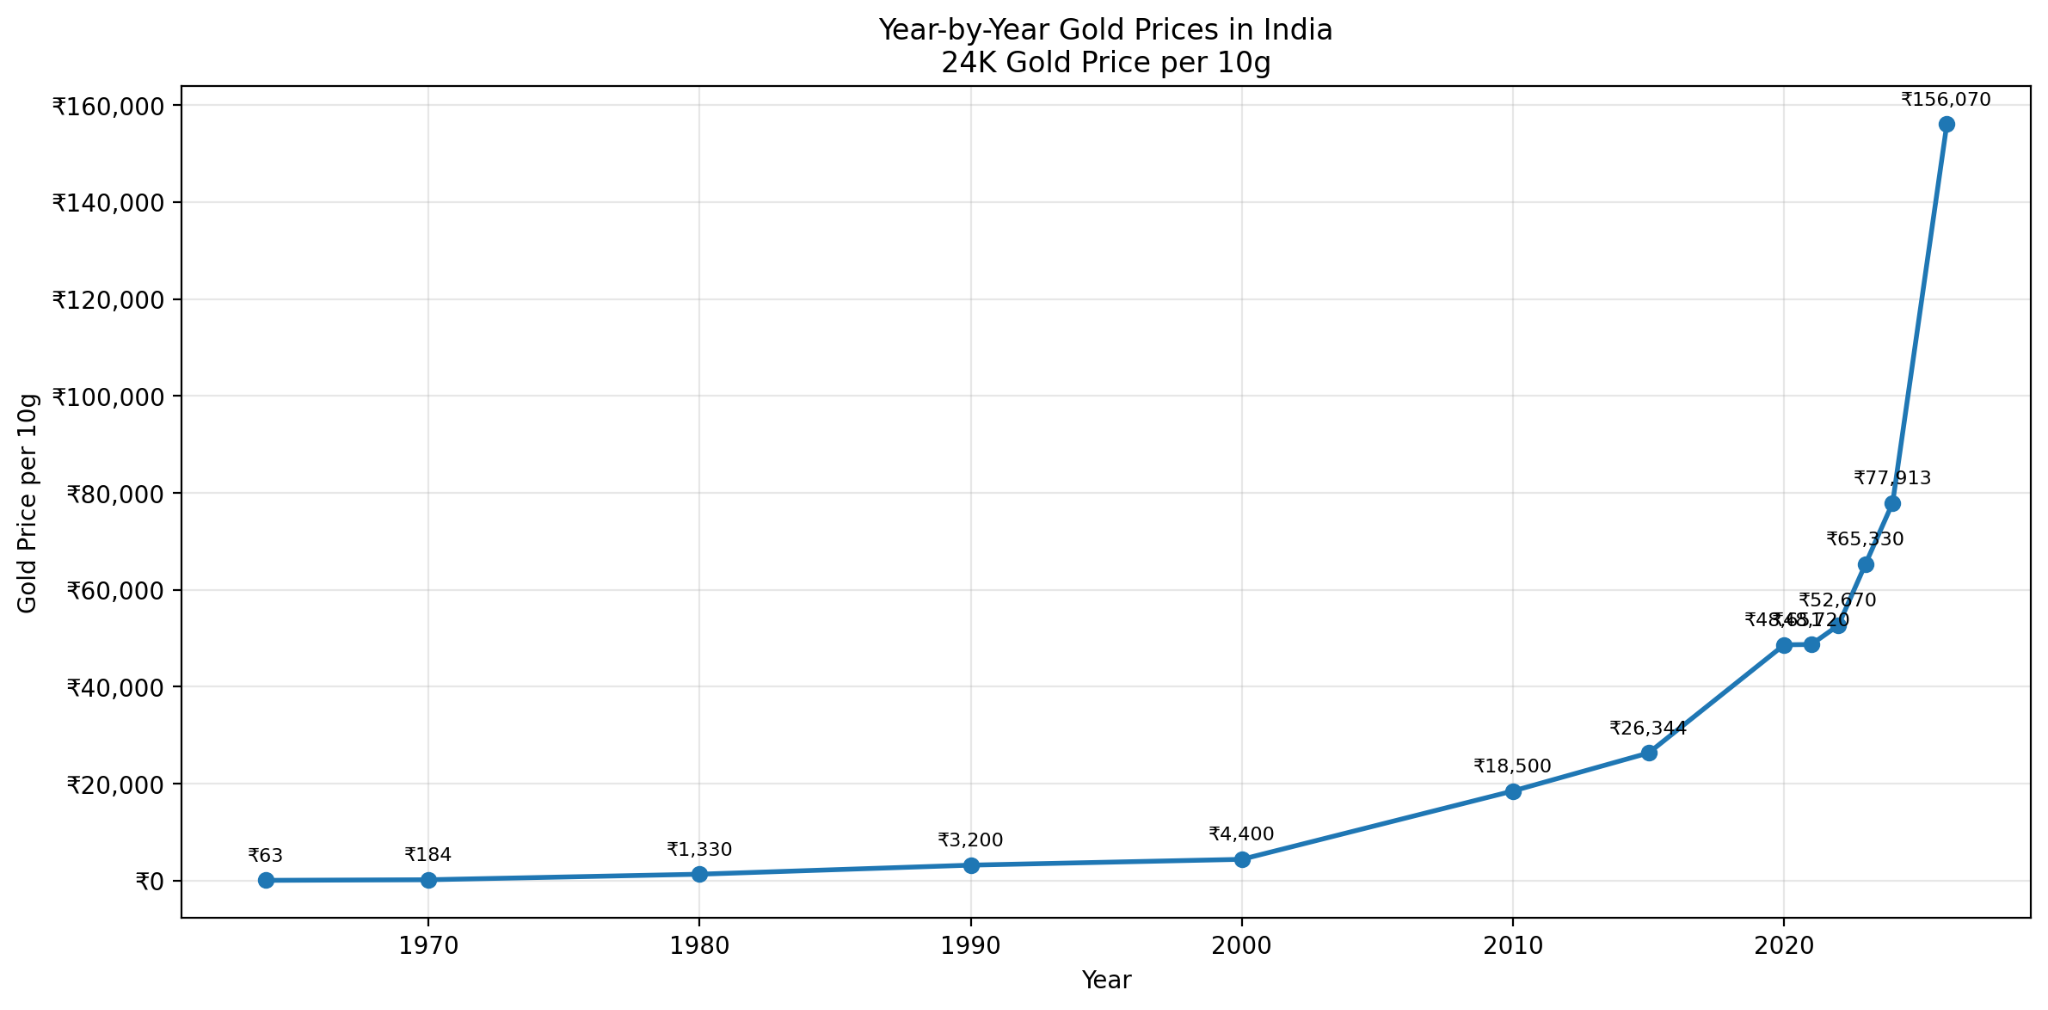
Figure 1: Year-by-Year Breakdown of Gold Prices in India.
Source note: The latest 2026 benchmark rate is based on IBJA’s indicative gold rate for Fine Gold 999. IBJA rates shown are exclusive of GST and making charges.
Here’s a simplified gold price last 10 years in indian rupees:
Gold Rate in 2014 & 2016: Prices ranged between ₹26,000–₹30,000 per 10 grams, showing moderate stability.
Gold Rate in 2017 & 2018: A gradual rise toward ₹32,000–₹34,000 levels, reflecting stronger global demand.
Gold Rate in 2019: Prices jumped to ₹38,000+ as trade wars and economic slowdown increased safe-haven buying.
Gold Rate in 2020: A landmark year—prices crossed ₹50,000 amid the pandemic and global uncertainty.
Gold Rate in 2021 & 2022: Fluctuations between ₹45,000–₹52,000 as markets adjusted to economic recovery and inflation concerns.
Gold Rate in 2023: Gold rate consistently traded above ₹55,000, reaching ₹65,330 per 10g in annual average in 2023 in India.
Gold Rate in 2024: It is supported by strong retail demand and global economic risks, creating another all time high at ₹77,913 to ₹80,450 per 10g depending on source basis.
Gold Rate in 2025: Gold moved into the ₹1,05,000 to ₹1,30,000 per 10 grams range, marking an unprecedented breakout above the ₹1 lakh level as macroeconomic uncertainty, inflation pressure, strong safe haven demand, and global risk sentiment continued to support prices.
Gold Rate in 2026: Gold continued climbing to new historical highs, with the latest benchmark rate reaching ₹1,56,070 per 10 grams based on IBJA’s indicative Fine Gold 999 rate. This figure should be treated as a latest benchmark rate, not an annual average, because 2026 is not yet complete.
The chart shows the long term rise in 24K gold prices in India, measured per 10 grams. Gold prices increased from ₹63.25 per 10 grams in 1964 to ₹65,330 in 2023, based on historical annual reference data. The price then moved much higher in recent years, with 2024 shown as a recent annual reference point and 2026 shown as the latest available benchmark rate, not a completed full year average.
Because 2026 is still in progress, the 2026 figure should be read as a current market benchmark rather than an annual average. Recent year prices can vary across sources depending on whether the data uses annual average prices, year to date averages, daily benchmark rates, retail jewellery rates, GST, or making charges.
Key Factors Influencing Gold Price in India for the next 10 years in Indian Rupees
Several global and domestic factors have contributed to the gold price in the next 10 years in India:
Global Uncertainty
Events such as the US-China trade tensions and the COVID-19 pandemic played a major role in increasing global demand for gold. During times of crisis, investors tend to move away from risky assets and prefer safe-haven investments like gold, which pushed prices upward worldwide.
Currency Movements
The Indian Rupee’s performance against the US Dollar has a direct impact on domestic gold prices. When the Rupee weakens, importing gold becomes more expensive, which in turn raises the overall price of gold in India.
Inflation and Interest Rates
Gold has traditionally been viewed as a hedge against inflation, and rising inflation levels usually boost its appeal among investors. Additionally, changes in US Federal Reserve interest rates affect global sentiment, often leading to shifts in demand for gold.
Indian Demand
Local cultural traditions continue to drive strong demand for gold in India. Weddings, religious festivals, and family celebrations contribute to consistent purchases, cementing India’s position as one of the largest consumers of gold in the world.

Gold Returns in the Last 10 Years in India: What Traders Should Know
When calculating the historical average return on gold in India last 10 years, gold has delivered far stronger appreciation than the 2014 to 2024 period. Based on an average 24K gold price of around ₹28,623.50 per 10 grams in 2016 and the latest 2026 benchmark rate of ₹1,56,070 per 10 grams, gold prices have risen by about 445%.
This means investors who bought gold in 2016 would have seen the value of their holdings grow by more than five times by 2026. The implied compound annual growth rate is approximately 18.5% per year, although the 2026 figure should be treated as a latest benchmark rate rather than a full year annual average.
For Indian traders, this underlines why gold remains a reliable hedge against inflation, market volatility, and currency depreciation.
What the 10-Year Chart Reveals for Indian Traders
Looking at the gold price history India, two important insights stand out:
Long-term Uptrend
Despite experiencing short-term dips over the years, gold has consistently delivered strong long-term returns. This steady upward movement highlights why many Indian investors and traders continue to see gold as a dependable asset for wealth preservation.
Safe-Haven Appeal
During times of crisis, whether caused by global economic slowdowns or unexpected events, gold prices have surged. This reinforces its reputation as a safe-haven asset that investors turn to when uncertainty dominates the markets.
For traders, this reinforces the importance of analyzing long-term charts before making short-term trading decisions.
How Traders Can Use Gold Price History to Plan Ahead
Studying the 10 year gold price chart in India allows traders to identify long-term support and resistance levels that shape price movements. By recognizing these key zones, traders can better anticipate potential reversals or continuations in the market and refine their strategies accordingly. It also helps them understand how major global events, such as economic crises or policy changes, directly influence domestic gold prices.
In addition, reviewing the 10-year chart assists traders in planning more effective entry and exit points for trading contracts or CFDs. Beyond timing trades, it also highlights the importance of balancing risk by diversifying portfolios with precious metals, ensuring stability even when other asset classes face uncertainty.
TMGM: Helping You Trade Precious Metals in India
At TMGM, traders in India can access advanced tools to trade gold and other precious metals with confidence. TMGM provides:
Competitive Spreads and Deep Liquidity: Trade gold with minimal costs.
Global Market Access: Benefit from exposure to gold and other commodities.
Trusted Regulation: TMGM is regulated by multiple international financial authorities, ensuring a safe trading environment.
Educational Resources: Learn more through the TMGM Academy.
Ready to experience gold trading with TMGM?
Open a Demo Account to practice risk-free.
Or start real trading with a Live Account.
Explore TMGM’s Precious Metals Trading for more opportunities.




















