On Balance Volume: What Can It Tell Traders?
• Volume support becomes easier to assess with OBV's single trend line. Rather than examining individual volume bars, traders can follow a cumulative figure: on balance volume adds each period's volume after a higher close and deducts it after a lower close.
• The direction of the close matters; the extent of the change does not. No additional weight is assigned to a larger price move. OBV checks only whether the closing price is above, below or equal to the preceding close.
• Opposing moves in price and OBV may expose a trend losing strength. A trend may lack the volume backing required to keep going when its price direction differs from that of OBV.
• Trend validation is more central to OBV than forecasting. Since this lagging indicator responds to price and volume information already recorded, traders generally combine it with other analytical tools instead of trading solely on its readings.
• An OBV figure needs context to be meaningful. Whether its line climbs or declines becomes useful only when assessed against price, the quality of the volume feed and the market being traded.
How Does On Balance Volume (OBV) Work?
Whether volume is supporting a move can be assessed using on balance volume, a cumulative volume indicator. It builds a running balance by crediting volume in up periods and deducting it in down periods. That balance indicates direction; it never represents a price level.
The idea that volume tends to precede price underpinned Joseph Granville's introduction of OBV in his 1963 book, Granville's New Key to Stock Market Profits. Its use continues today, with traders checking whether volume reinforces a price movement or conflicts with it.
Which Pressure Does OBV Capture?
Price itself is not what on balance volume measures. Instead, it represents the net pressure implied by buying and selling volume behind price. When a period closes higher, its volume is credited to the cumulative balance; when it closes lower, that volume is deducted. Pressure developing behind price moves is reflected in the resulting OBV line.
There is no direct display of actual buy or sell orders in OBV. Closing-price direction and volume form the calculation, making it a reasonable proxy for pressure in traders' assessments, rather than a real-time tally of orders. Later sections examine how that pressure can be assessed relative to price.
Which Inputs Are Needed to Calculate OBV?
Four pieces of information go into the calculation: the latest closing price, the prior closing price, volume in the current period and the preceding OBV value. Whether current volume is credited to the running balance, deducted or ignored depends on the comparison between those closing prices.
Which Rules Govern the On Balance Volume Formula?
Three outcomes are possible in the OBV formula. They depend on a comparison of the latest closing price with the preceding day's closing price, as the table sets out.
Price Comparison | Effect on OBV |
The period closes higher than the preceding period | To obtain the latest OBV, combine the preceding OBV with the current period's volume, thereby increasing the volume balance |
The period closes lower than the preceding period | To obtain the latest OBV, deduct the current period's volume from the preceding OBV, thereby reducing the volume balance |
The period closes at the same price as the preceding period | The preceding OBV value is carried forward without change |
An initial value is required to begin the OBV series. On most charting platforms, this is either zero or the opening period's volume; the three rules then apply from the next period onwards. The cumulative nature of OBV means its absolute value can be negative or positive, depending on where counting began. What is useful is the line's direction and shape thereafter, not that absolute value. The table below demonstrates the process with hypothetical price and volume figures. It is not real market data.
How Does an OBV Calculation Look in Practice?
Period Number | Price at Period Close | Volume Recorded | Change in Close | OBV |
1 | $50.00 | 1,200 | Opening period | 1,200 |
2 | $50.50 | 1,500 | Closed above prior period | 2,700 |
3 | $50.20 | 900 | Closed below prior period | 1,800 |
4 | $50.20 | 1,100 | Closed at prior period's price | 1,800 |
5 | $51.00 | 2,000 | Closed above prior period | 3,800 |
The subtraction occurs in period 3, whereas period 4 leaves the balance intact: volume was traded, but the closing price did not differ from the preceding period. For a simplified interpretation, think of OBV as average volume multiplied by the difference between the number of up days and down days. Even minimal price movements contribute. Days recording price changes below 0.25% accounted for 14.5% of OBV changes.
What Should Traders Look for When Reading On Balance Volume?
The price chart provides the reference for interpreting OBV. Compare the indicator's direction and swing points with those of price, rather than relying on its numerical value. When the two cease to move together, that comparison also identifies on balance volume divergence.
Because the calculation's starting point determines the absolute OBV figure, that figure has no significance in isolation. Attention instead belongs on the line's upward or downward direction and on higher or lower swing points relative to price. The sections that follow explore these features.
What Can Changes in OBV Direction Reveal?
Buying pressure is the usual interpretation when OBV climbs: additions during up days are outpacing deductions during down days. If volume expands as price advances, an upward OBV line can reflect upward momentum. A declining line reflects the reverse balance, with down-period deductions exceeding up-period additions. That points to selling pressure and can warn that the volume backing a move is diminishing.
Neither side has a clear advantage when OBV runs flat or sideways, as volume in up and down periods is broadly balanced. These movements do not guarantee the next direction of price. They provide context, not a self-sufficient signal for action.
When Does OBV Validate a Price Trend?
For a price trend to receive confirmation from OBV, the indicator and price must travel in the same direction over the same interval. Higher highs in both suggest better volume backing for the trend. A rising price that is not matched by a fresh OBV high, however, indicates incomplete volume support. This warrants attention but is not an instruction to exit.
Research reporting a correlation of 0.959 between OBV and price movement helps explain its principal use: validating trends rather than generating signals independently.
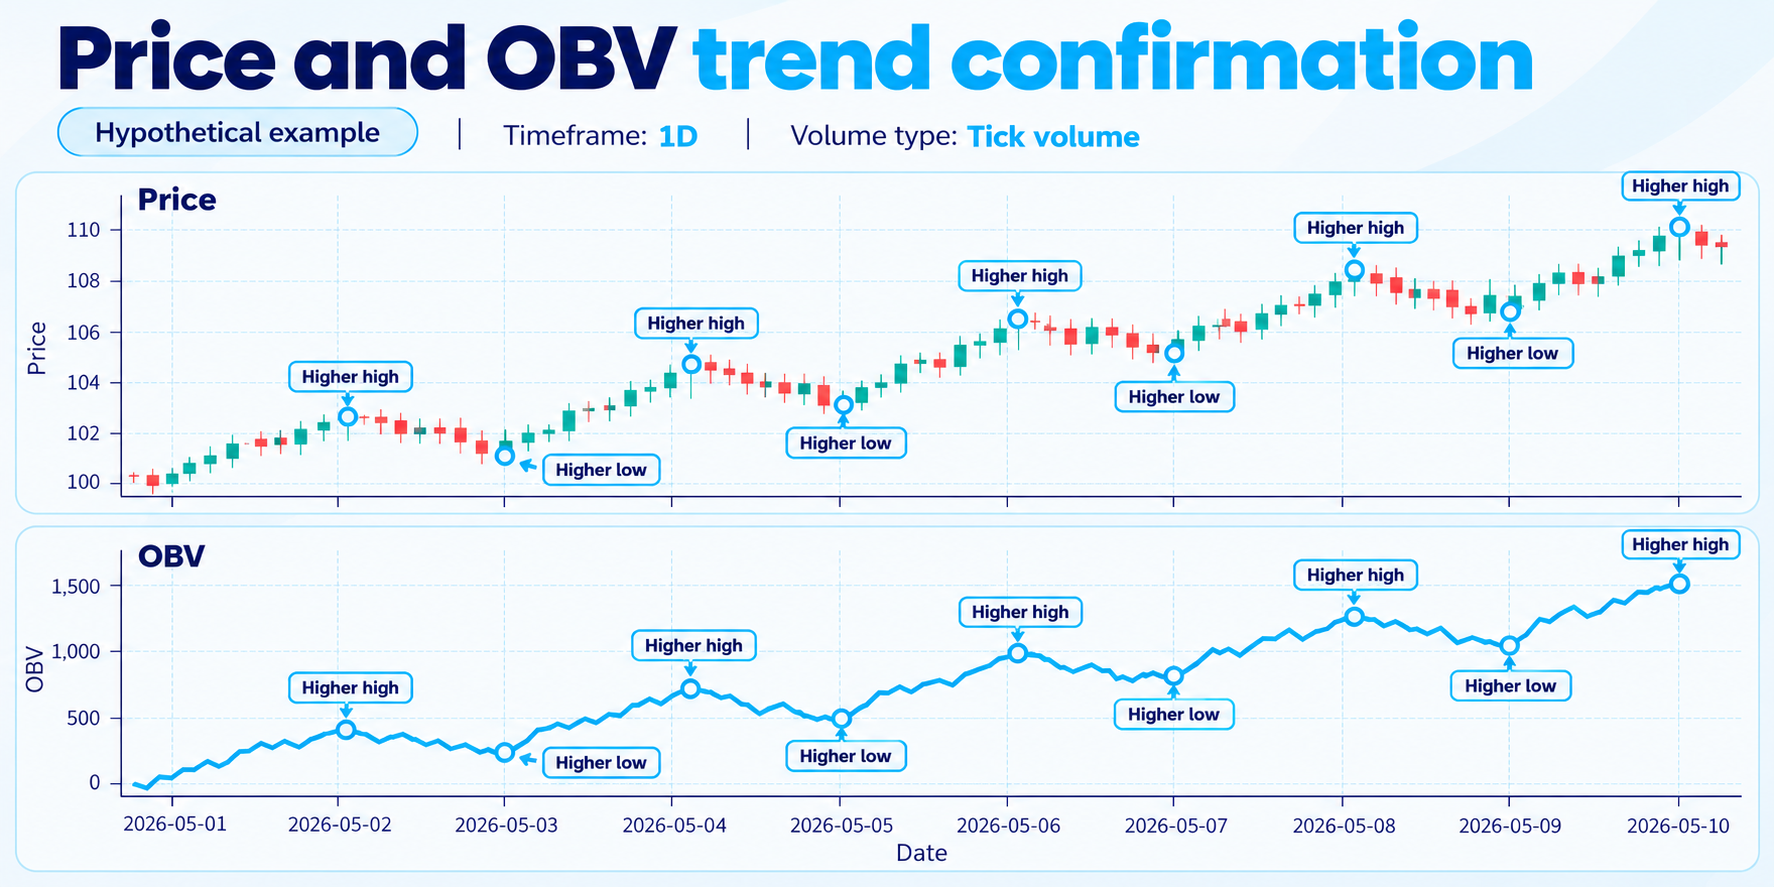
A trade is not triggered merely because OBV confirms a move. Traders weigh that evidence against price structure, support and resistance, and other tools before making a decision.
What Distinguishes Bullish OBV Divergence?
Improving volume beneath an apparently weak price can appear as bullish OBV divergence. At corresponding swing points, price registers a lower low but OBV registers a higher low. Selling pressure may therefore be receding before the improvement appears in price.
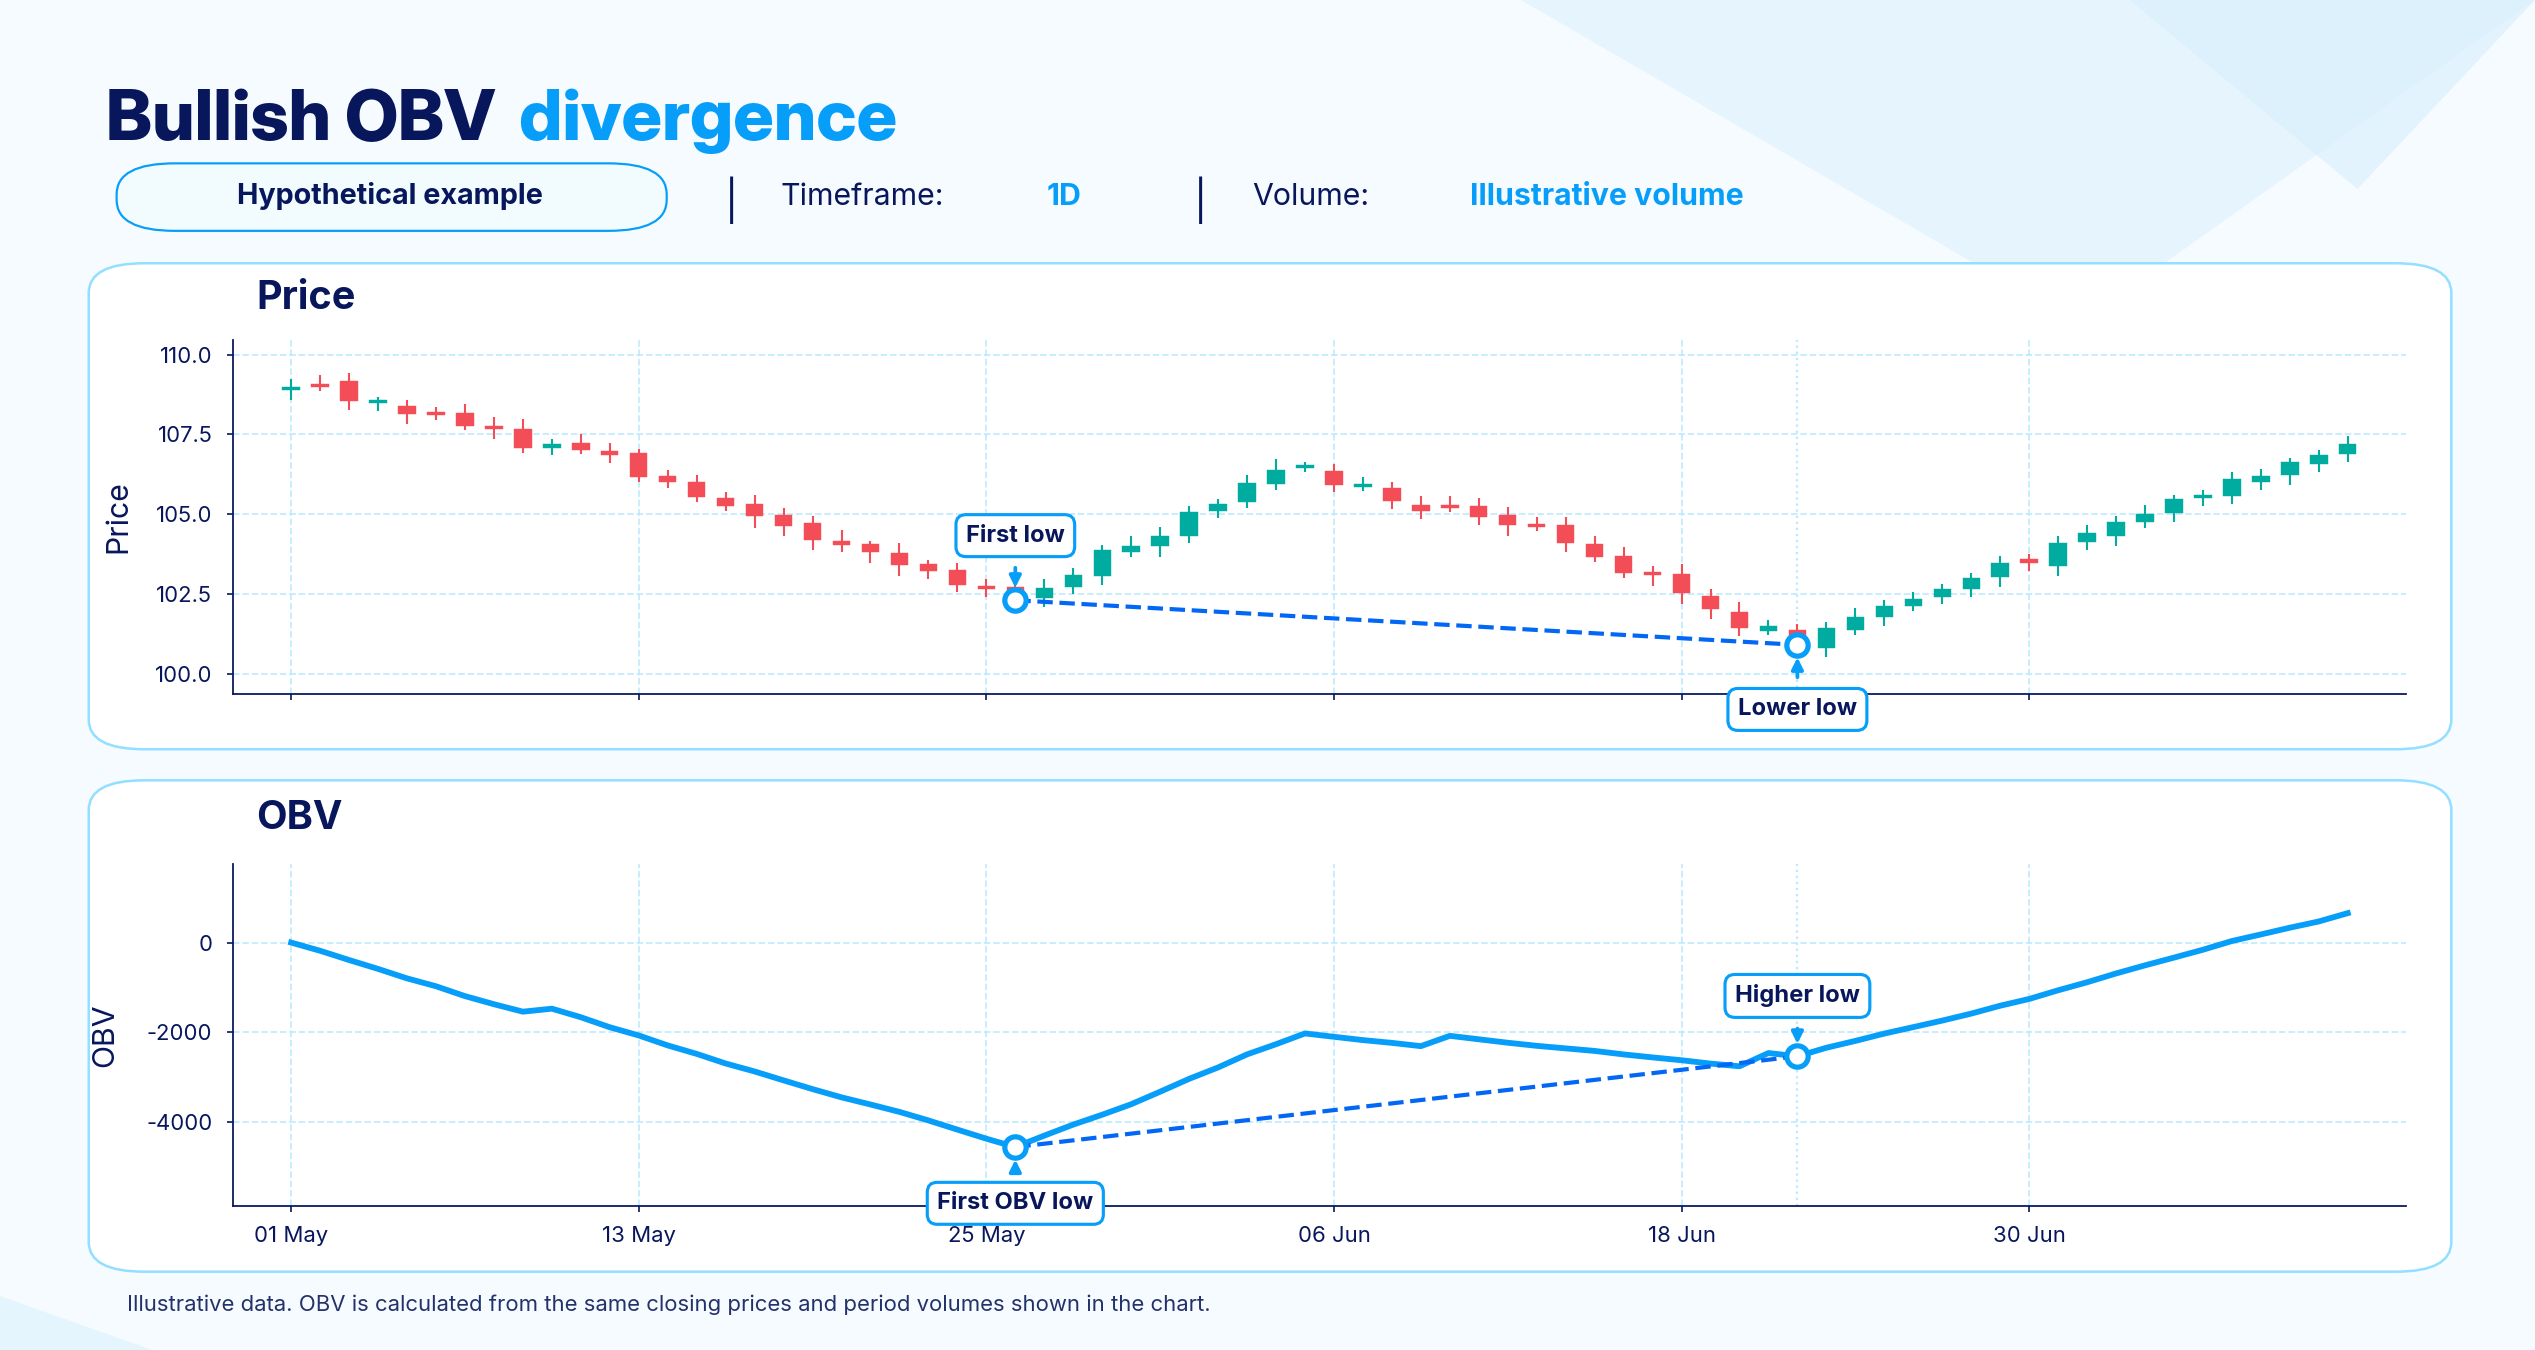
The chart pattern alone does not establish that a shift has occurred. Before considering it more than an early warning, traders typically seek confirmation from price, such as a break above a recent swing high.
What Distinguishes Bearish OBV Divergence?
Weakening volume beneath an apparently strong price can appear as bearish OBV divergence. At corresponding swing points, price reaches a higher high while OBV records a lower high. That mismatch may indicate buying pressure is being depleted before price turns lower.
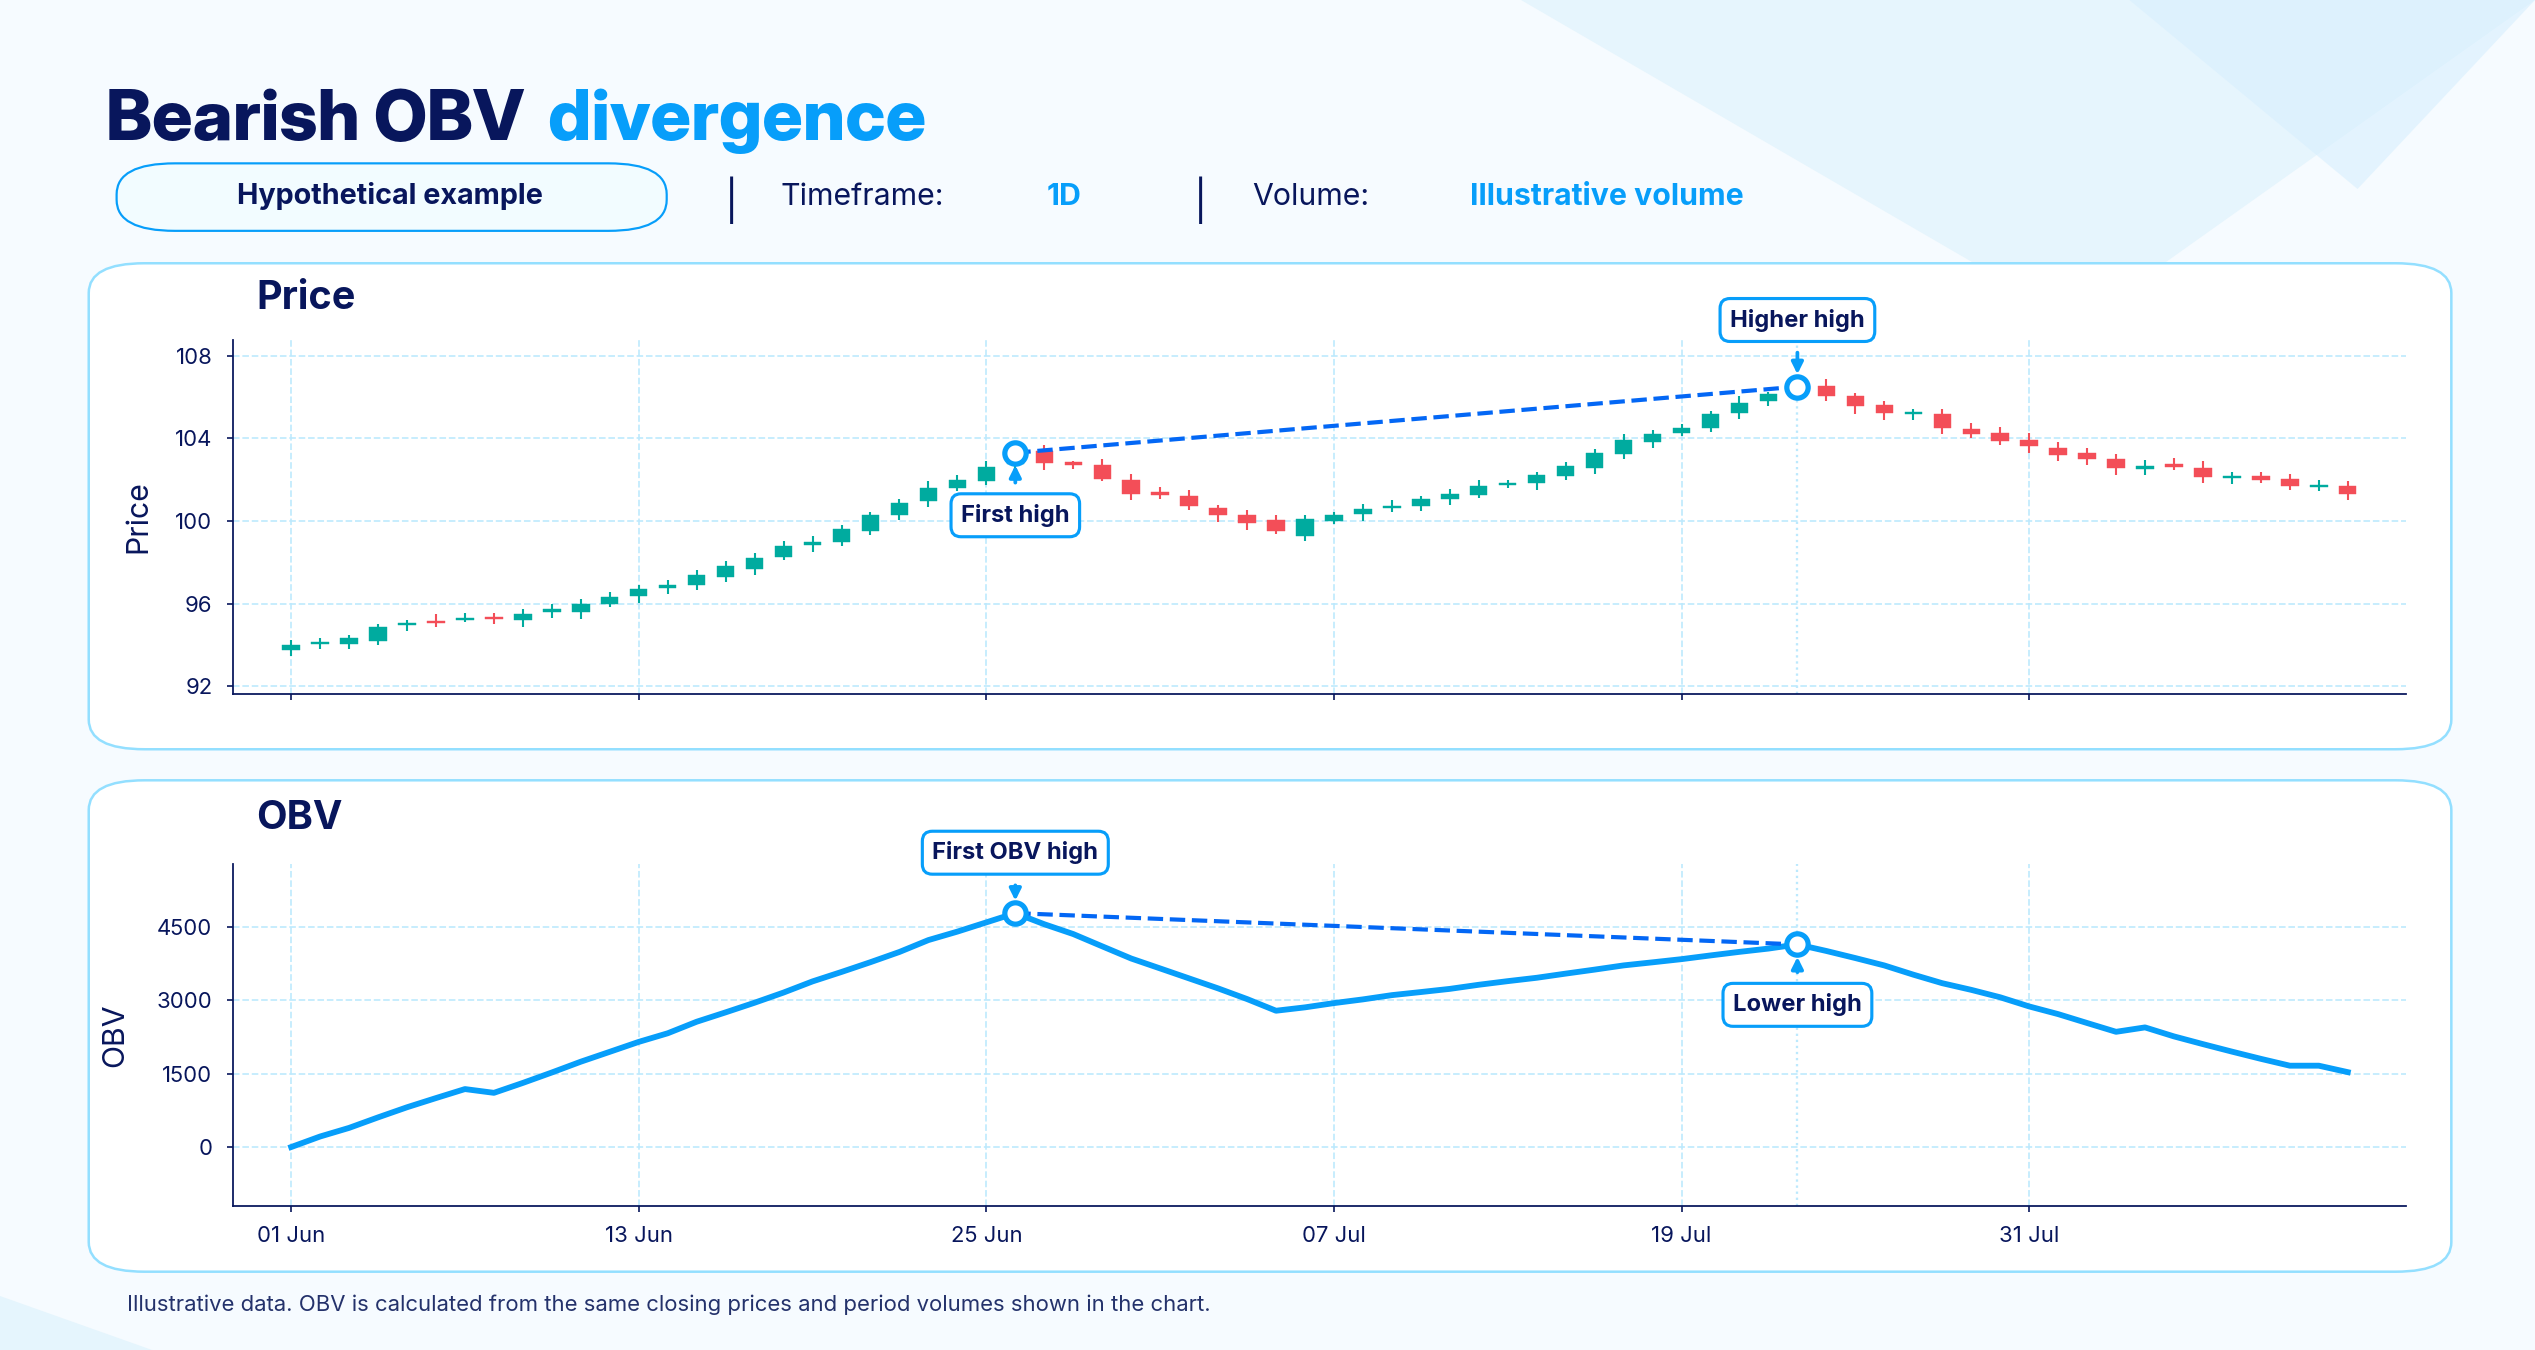
A reversal cannot be timed using this warning pattern. The divergence may last for an extended stretch before price turns, and price may not reverse at all.
How Can OBV Improve Price Analysis?
Whether actual volume backs a movement is not apparent from price direction alone. Placing OBV alongside a rising or falling price line supplies that missing volume-based check. Three principal benefits follow from this context.
Checking trend credibility. Agreement between OBV and price lends weight to a trend supported by genuine volume, rather than one driven simply by a few large trades moving the price.
Detecting pressure changes early. Divergence can reveal the volume pressure underpinning a move, alerting traders to weakening buying or selling pressure before price responds.
Applying the tool across markets. Closing price and volume are the only inputs required, allowing OBV to be used on stocks, forex pairs and other liquid markets that provide volume data.
Where Can OBV Fall Short?
Before placing reliance on OBV, traders need to account for four principal constraints.
Misleading movements. OBV can jump sharply following one large trade or a brief surge in volume, even without a genuine shift in buying or selling pressure.
Event-driven volume distortions. Around earnings announcements, economic releases and contract expiries, increased volume may have little connection with the prevailing trend. The OBV line can consequently become distorted for a short time.
Uneven reliability of volume feeds. A single centralised volume total is unavailable for forex and certain other markets. Reliability of the OBV line therefore depends on the volume supplied to the chart, an issue examined in greater detail later.
Equal treatment of large and small price changes. Whether the close changes substantially or only marginally, the formula credits or deducts the entire period's volume. A small movement can therefore contribute just as much to the calculation as a large one.
Taken together, these constraints favour using OBV with price structure and at least one additional tool, rather than independently. As a lagging indicator, it validates events already reflected in price and volume; it does not forecast price's next direction.
How Can Traders Apply the On-Balance Volume Indicator?
Begin an OBV workflow by establishing the price setting, then assess the indicator against that price action. Check for agreement or divergence and evaluate any conflicting signals. OBV can also complement wider beginner day trading strategies that specify entry, exit and risk management rules.
Establish the price setting first. Before consulting OBV, locate the prevailing trend, trading range or important level on the price chart. Interpretation requires price context; OBV is not meaningful in isolation.
Align the periods being compared. Over the same interval, examine whether OBV's highs and lows correspond with those of price or depart from them. This reveals whether volume is following the trend.
Check whether the two agree or diverge. Agreement suggests a strengthening trend. A separation between price and OBV may instead point to weakness, making it a warning to monitor rather than a reason to enter.
Assess disagreements between tools. When OBV conflicts with price action or another tool such as a moving average, exercise caution rather than dismissing either reading.
In Which Situations Is OBV Useful?
A trend, a prospective breakout or a possible change in buying and selling pressure may warrant an additional check from OBV. Three typical applications are outlined below.
Reviewing trend support. Movement in step with price helps establish whether a trend is backed by actual volume.
Monitoring breakout potential. An OBV rise before or during a price breakout suggests increasing volume support for the move.
Recognising price-volume disagreement. A trend may be weakening when the direction of OBV departs from that of price.
Not every situation benefits equally from OBV. An ambiguous reading or incomplete volume data is a reason to give price greater weight in the decision and OBV less. The indicator is most useful when the signal is clear and the supporting volume information is dependable.
How Do Price Action and Moving Averages Complement OBV?
A small set of complementary tools provides a better setting for OBV than using it alone. Through candles, support, resistance and chart patterns, price action records the prices buyers and sellers have actually accepted. Potential turning points are often assessed using price-action reversal candlestick patterns. To this picture, OBV contributes evidence of volume participation behind a movement. A moving average, in turn, condenses price into a smoother trend line, making direction easier to assess than from unsmoothed price alone. Traders can also add a volume moving average to compare current activity with its recent baseline while using OBV to assess direction. The timeframe chosen can alter that interpretation.
Agreement across all three offers stronger evidence than any tool individually. For instance, price may break resistance while OBV advances and price remains above an upward-sloping moving average. Disagreement is informative too: a price breakout accompanied by a stalling OBV suggests the advance may not have sufficient volume or trend support to persist. That calls for caution, not a trade against the breakout.
What Might an On-Balance Volume Trading Strategy Look Like?
Trend confirmation is the basis of the illustrative OBV approach outlined here. It is a teaching example that shows how the pieces fit together, not a system with a guaranteed edge. In liquid markets offering reliable volume data, such as major forex pairs or heavily traded stocks, the aim is to filter a price signal through OBV confirmation before acting on it.
Which Rules Define the OBV Trend Confirmation Approach?
Required price structure. An established trend must already be present; an uptrend, for instance, would show successive higher highs and higher lows.
Required OBV alignment. Across the corresponding swings, the indicator must likewise form higher highs and higher lows, following price direction.
A further confirmation filter. The chosen moving average must have price on the appropriate side. In an uptrend, for example, trading above a rising 50 period moving average supplies a second check.
Conditions for avoiding the setup. Do not proceed when OBV is sideways or diverges from price, when the instrument's volume feed is thin or unreliable, or when an approaching major news event could distort volume readings.
What Determines Entry, Exit, and Invalidation?
Within the established uptrend described above, a fresh price swing high accompanied by a fresh OBV swing high offers a possible entry trigger. The stop loss is placed beneath the latest price swing low, with sizing aligned to the trader's risk tolerance and position size.
A predetermined profit objective, a trailing stop or a clear price reversal signal can provide the exit. The setup ceases to be valid if the next swing produces price-OBV divergence, price closes below the moving average serving as the filter, or the wider trend setting changes.
None of these levels are universal settings that work on every instrument or timeframe. Their purpose is to demonstrate the connections within the strategy; traders adapt them to the market concerned and their own tolerance for risk.
How Would an OBV Strategy Setup Unfold?
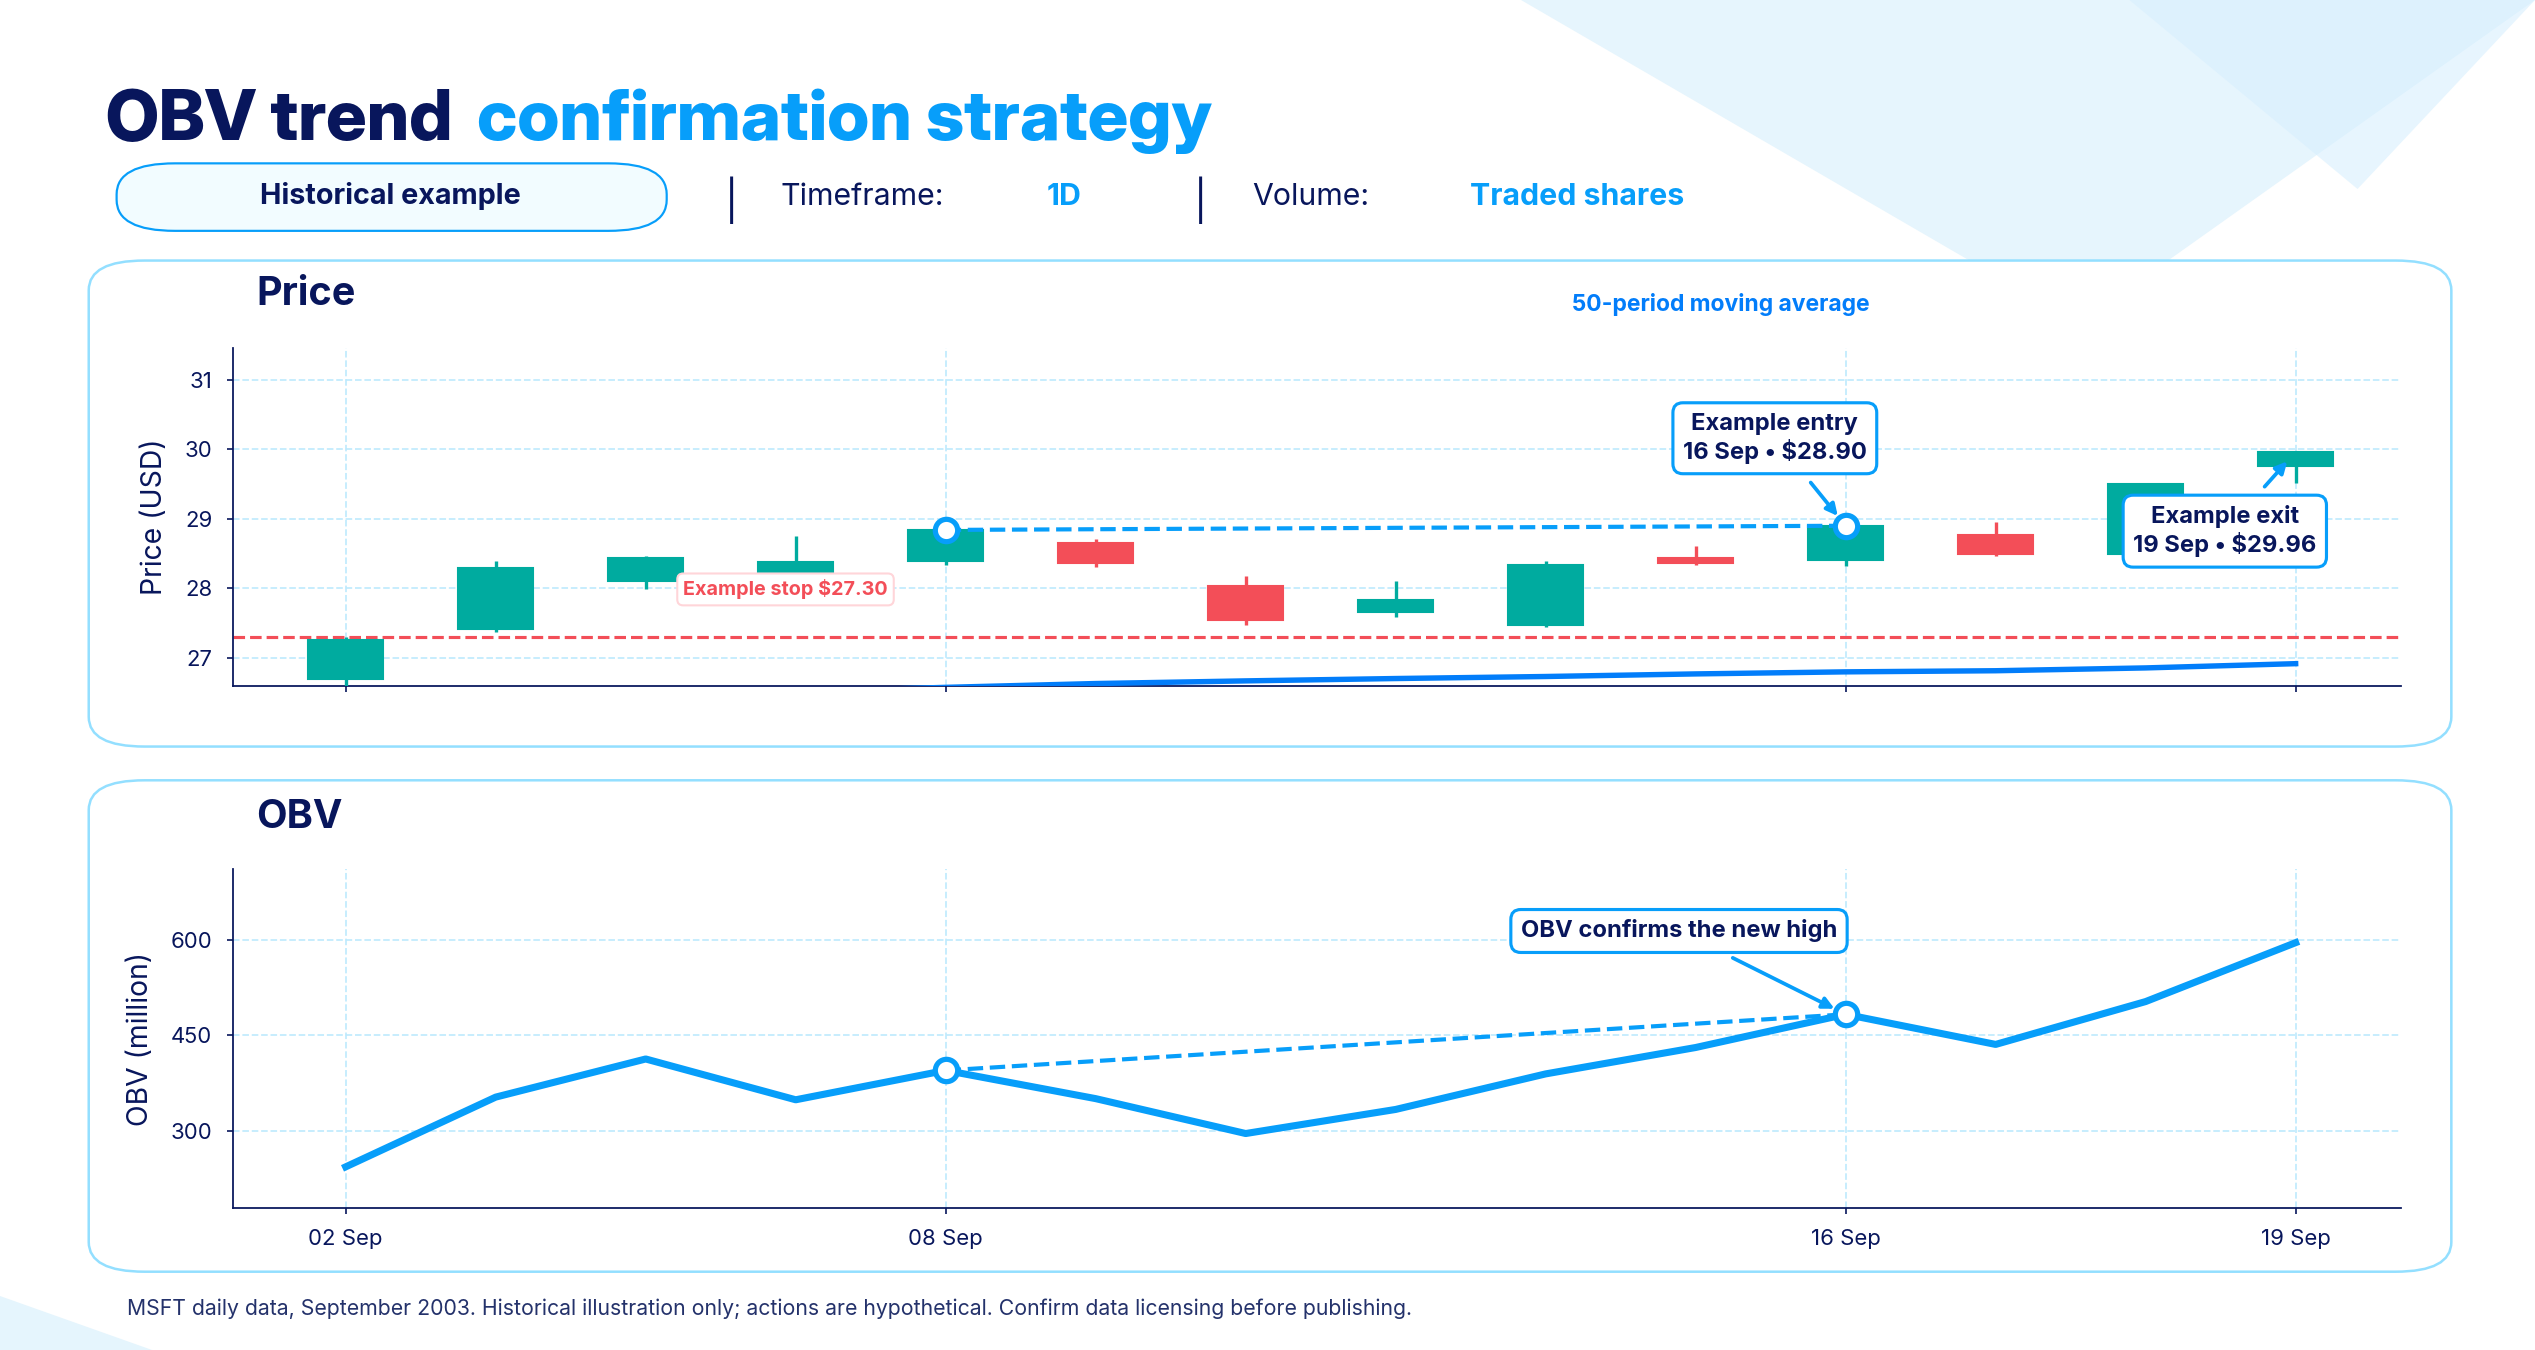
Consider the sequence. While remaining above the selected moving average, price establishes a higher low and then clears its preceding swing high. At approximately the same time, OBV establishes a corresponding higher low and clears its own preceding swing high, validating the price movement.
Without that OBV confirmation, there is no trigger. If price breaks upwards while OBV remains flat or declines, for example, the mismatch is interpreted as insufficient volume support for the trend. Rather than forcing a trade, the trader waits for another setup.
How Do You Add and Use OBV on MT4 and MT5?
The instructions here apply to the desktop editions of MT4 and MT5; mobile and web procedures may vary slightly. Before adding the indicator, traders who do not yet have MT4 installed can use a dedicated MetaTrader 4 download and trading configuration guide to get started.
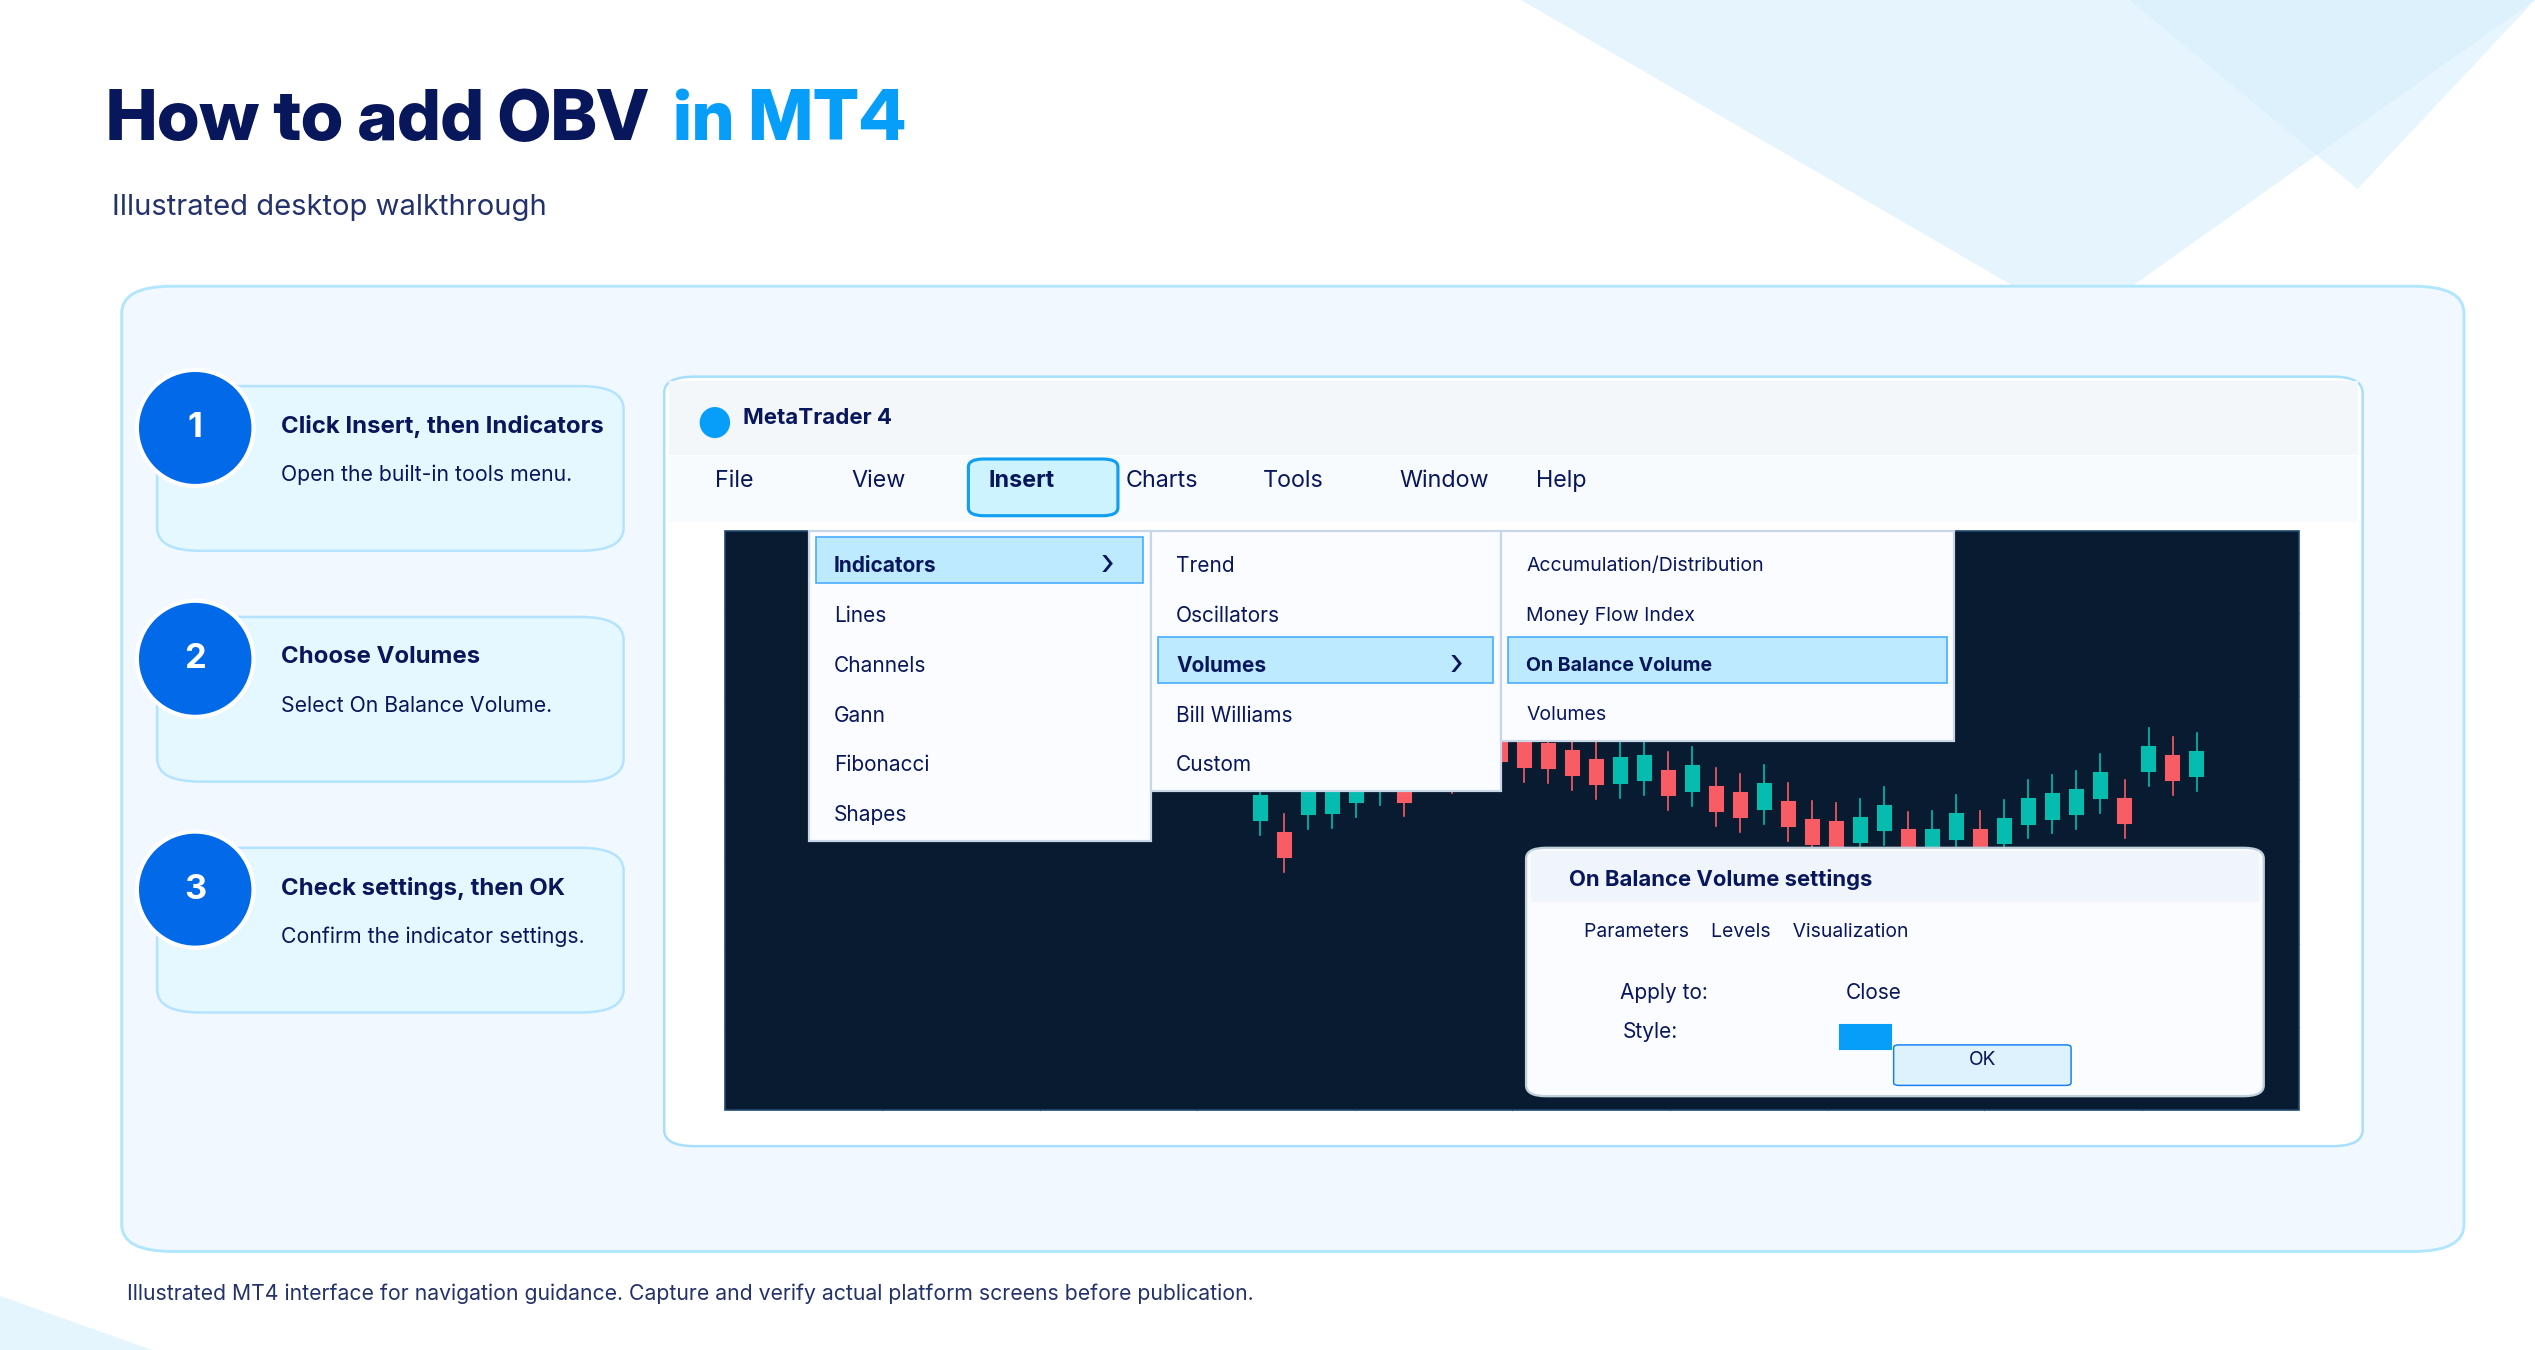
Adding OBV on MT4. First open the chart of the instrument to be analysed. From the top menu, select Insert, followed by Indicators, Volumes and On Balance Volume. In the separate indicator window beneath the price chart, adjust the colour, line style and volume type as required, then confirm the settings.
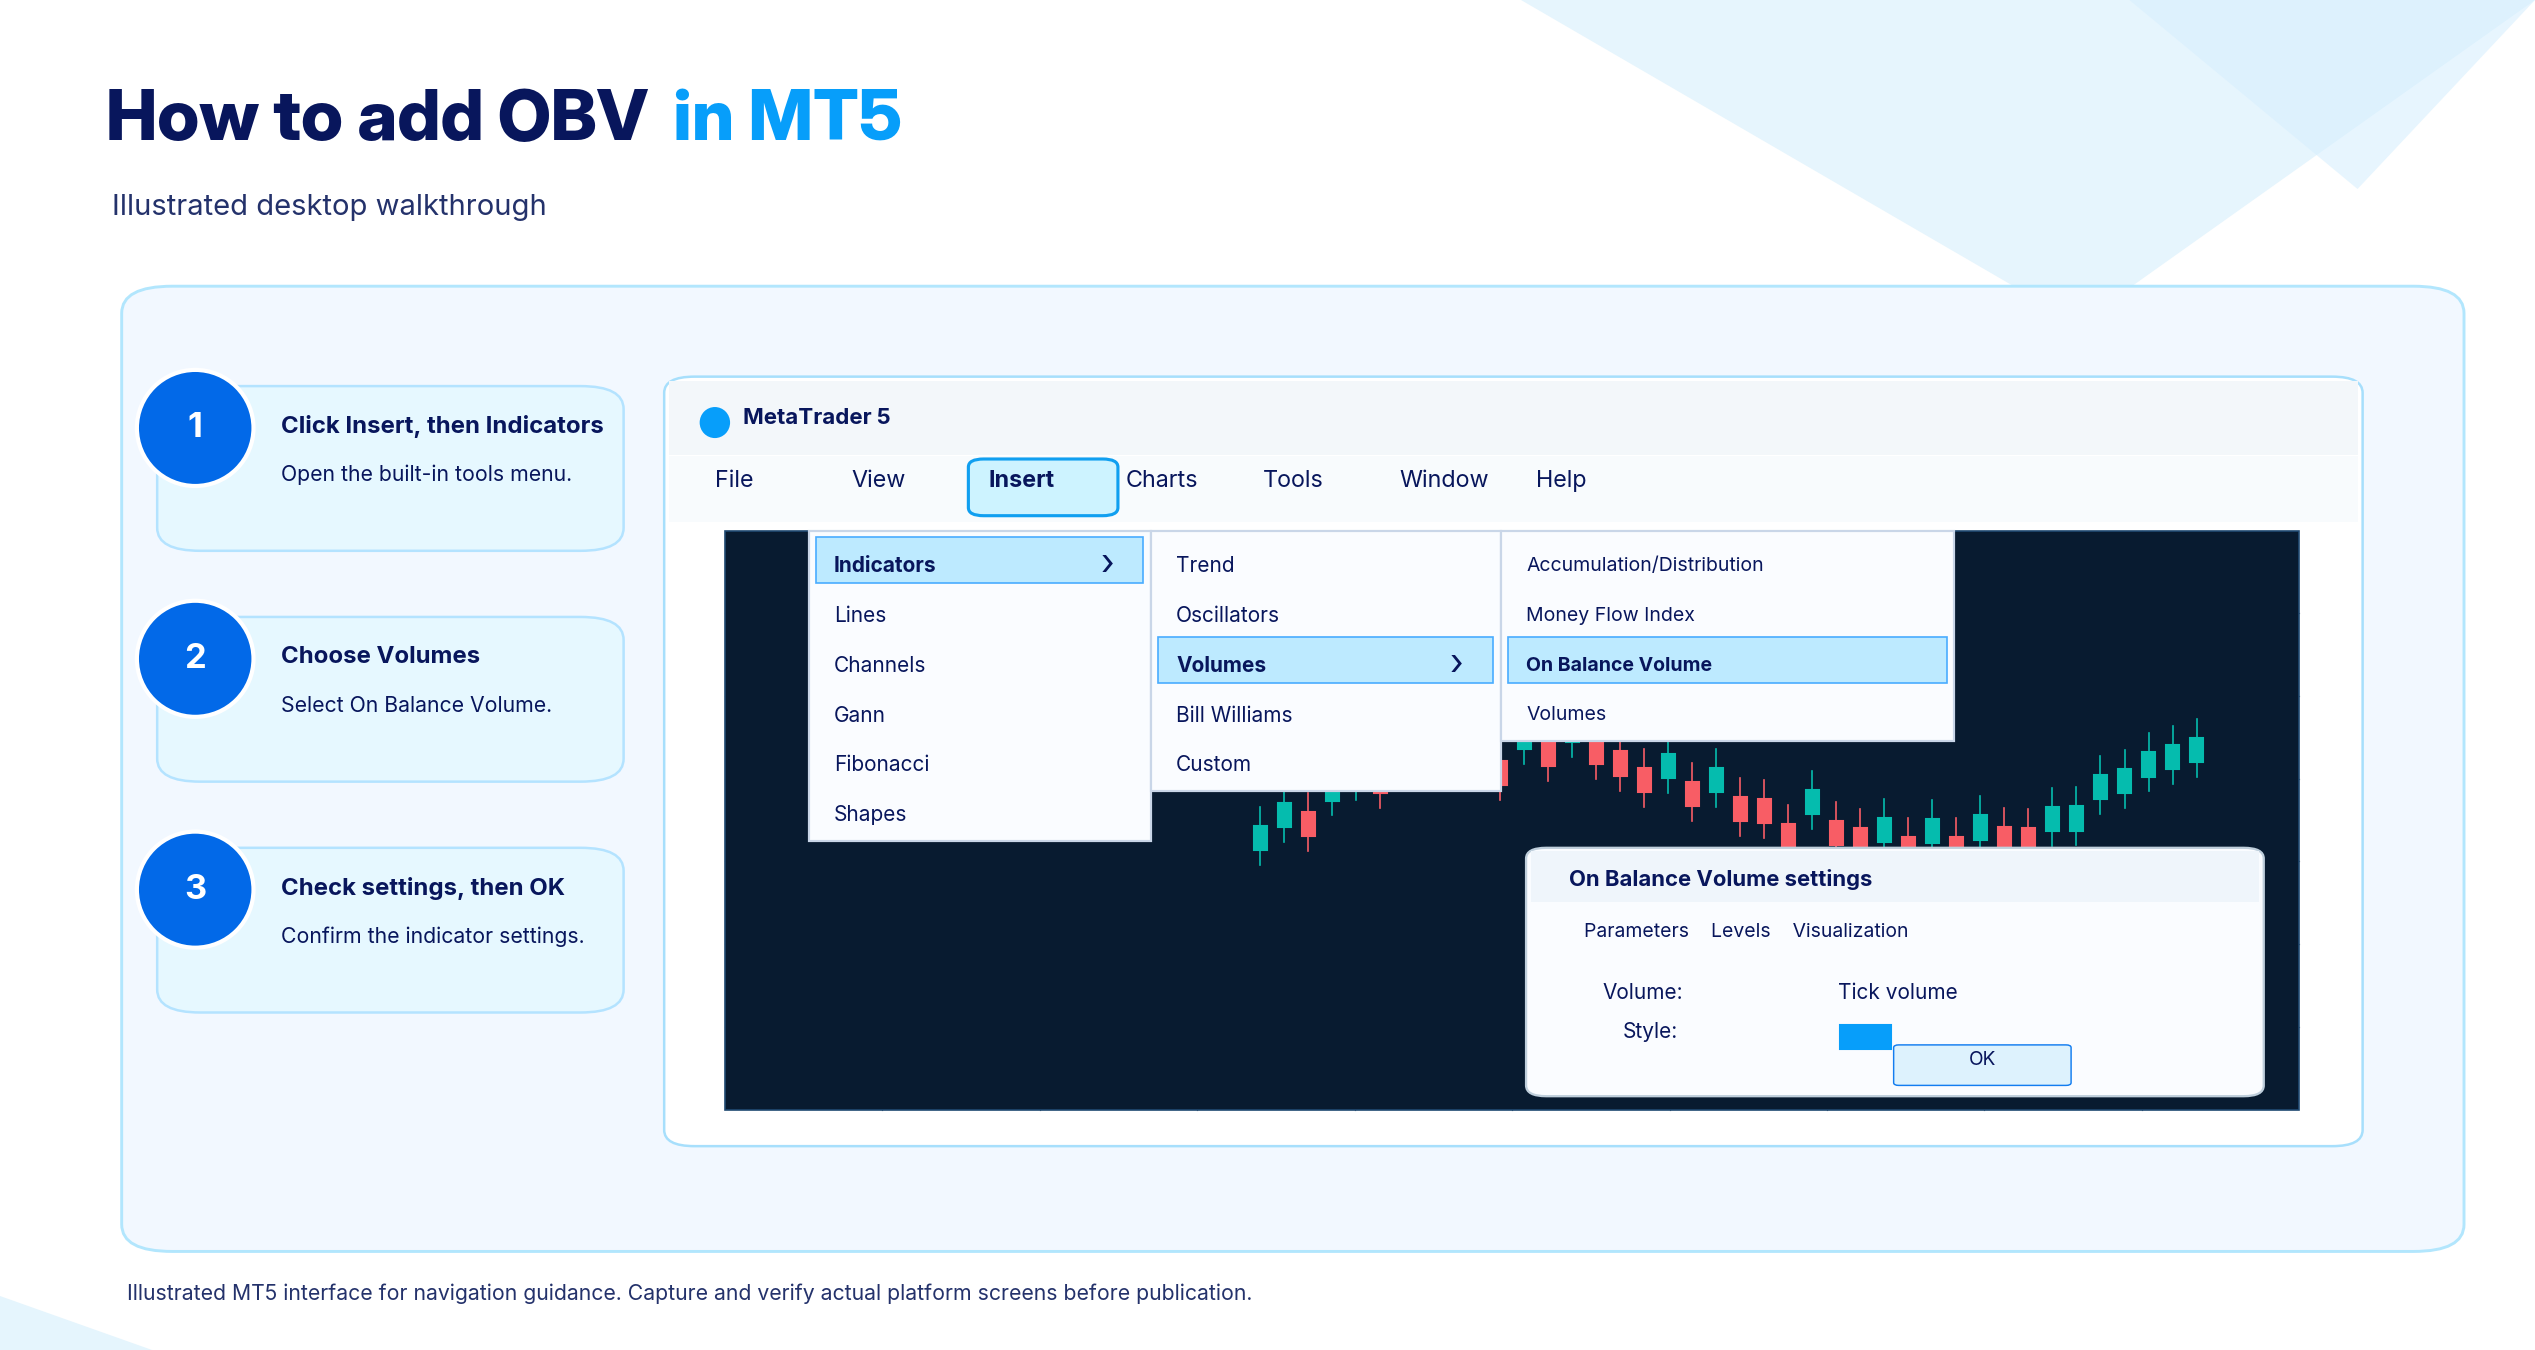
Adding OBV on MT5. Begin with a chart of the instrument to be analysed, then use the top-menu path Insert, Indicators, Volumes, On Balance Volume. Alternatively, drag OBV onto the chart from the Navigator window. Both routes open the same settings dialogue, allowing the applied volume type and line appearance to be adjusted before confirmation.
What Changes When OBV Is Applied to Forex and Gold?
Applying OBV to forex and gold differs from applying it to an exchange-traded stock. The distinction comes from the way each market records volume.
How Do Tick Volume and Traded Volume Differ?
The number of price changes within a period is tick volume, not a count of units traded. By contrast, traded volume records the contracts, shares or lots that actually changed hands over that period.
There is no single feed covering the global forex market's full traded volume, because transactions occur across a decentralised network of brokers and liquidity providers. Consequently, tick volume serves as a proxy on most forex charts, including MT4 and MT5 charts.
Identify the underlying volume type before interpreting OBV on a chart. The applied volume field in MT4 and MT5 indicator settings supplies this information. It is generally tick volume for forex; other instruments may use tick or real volume, depending on the broker's feed.
For gold CFDs or gold offered through a forex-style broker, the volume shown is typically that broker's tick volume rather than centralised futures-exchange volume. As a result, two brokers' feeds for the same instrument will not produce precisely identical OBV readings, although the line usually has a similar shape. On forex and CFD gold, regard OBV as useful for direction, not as a precise gauge of worldwide traded volume.
How Does On-Balance Volume Compare With Price Volume Trend and Accumulation/Distribution?
Different treatment of each period means that on balance volume and the Accumulation/Distribution Line often produce divergent readings, even though both express volume as a cumulative line. Other comparisons include the money flow index and price volume trend, each of which links price and volume differently.
Feature Compared | On Balance Volume (OBV) | Accumulation/Distribution Line (ADL) |
Calculation Method | The comparison with the preceding close alone determines whether the whole period's volume is credited, deducted or left out when the close is unchanged | The close's location between the period's high and low determines the portion of volume credited or deducted |
Price Inputs | Only the change in direction between closing prices is used; the close's location within the period is disregarded | Each period's high, low and close are used, with volume weighted according to the close's proximity to the high or low |
Volume Contribution | The entire volume figure is credited or deducted for each period | Only a proportion of volume is credited or deducted, determined by the close's position within the range |
Reading the Indicator | Assess upward or downward direction and divergence in relation to price swings | Apply a broadly similar interpretation, while recognising that different inputs drive the movement |
Main Constraints | Neither the extent of the price change nor the close's position within the period's range receives any weighting | Actual buying or selling pressure may still be misrepresented if a strong directional move ends with the close near the middle of the period's range |
Different handling of price can send OBV and the Accumulation/Distribution Line in opposite directions on the same chart over the same period. One does not take precedence over the other. Looking at both offers a broader view of volume behaviour than either alone; disagreement calls for closer examination of price action, not an automatic preference for one indicator. Price and volume are combined by the MFI to gauge buying and selling pressure. PVT, by comparison, weights volume according to the extent of the price change. It also follows money flow. For additional context, some traders combine it with a volume-based average price reference such as VWAP. Compared with OBV, the Klinger Volume Oscillator places greater emphasis on relating volume to price reversals.
What Else Should Traders Know About OBV?
Can OBV Forecast the Next Price Move?
Forecasting price is not OBV's function. Closing prices and volume already recorded form this lagging indicator, so confirmation follows the availability of that data rather than anticipating the next move. A change such as emerging divergence is treated by traders as an early warning to monitor, not proof that price will follow.
Does a Larger OBV Reading Imply a Bullish Market?
A larger figure does not, by itself, imply bullish conditions. Since the starting point entirely determines the absolute OBV value, two charts for an identical instrument may display markedly different figures yet convey the same directional message. The relevant evidence is the line's upward or downward movement and its swing points relative to price, not how large the reading is.
Why Is OBV Classified as Lagging Rather Than Leading?
Every OBV reading uses closing prices and volume that have already been recorded, which makes it a lagging indicator. When divergence emerges before a visible price response, some traders attribute leading qualities to OBV. That description concerns the interpretation of a signal that may precede a price move. It does not change the calculation's backward-looking use of existing data.
Can Earlier OBV Readings Be Repainted?
Once a period has closed, its closing price and volume fix its OBV value, so historical readings do not repaint. The still-open candle is different: incoming volume can alter its current reading until the candle closes. Such changes are normal behaviour, not repainting.
Historical values can change separately if a broker fixes a data error or a platform recalculates following a feed problem. A claim that a particular broker's or platform's OBV repaints should therefore be checked directly with that provider.
What Should Crypto Traders Know Before Using OBV?
Crypto supports the use of OBV, but the indicator represents only the volume supplied by the chart's particular exchange or data feed. Trading takes place across numerous exchanges without one consolidated volume total. Calculating OBV from a single exchange therefore cannot capture market-wide volume.
Compared with the same instrument on an exchange recording greater volume, a sharp move on a thin-volume exchange can generate a misleading OBV picture. Identifying the exchange or feed supplying a chart's volume is thus just as important for crypto as for forex.