


Key Takeaways
Technical indicators convert raw market data into usable signals.
Different indicators answer different questions like trend, momentum, volatility, and volume are not the same.
More indicators do not mean better decisions. Too much overlap can reduce clarity.
Indicators support price action. They do not replace it.
What Are Technical Indicators?
Technical indicators are formulas applied to chart data to help traders interpret what the market is doing. Most indicators use price, some use volume, and some combine both.
In simple terms, they help answer questions such as these: Is the market trending, losing momentum, becoming overextended, or compressing before a breakout? That is why technical indicators in stock market analysis, forex trading, oil trading, and gold trading remain widely used.
A trader should not think of indicators as prediction tools. A better way to view them is as decision support tools that make market behavior easier to organize and test.
How do Technical Indicators Work
Indicators work by transforming chart data into a readable signal. For example, a moving average smooths price, an oscillator measures momentum, and a volatility tool measures how widely price is moving.
Most types of technical indicators fall into one of four core functions. They either identify trend, measure momentum, track volatility, or show price levels that traders watch for reaction.
A trend indicator can show whether a market is moving higher, lower, or sideways. A momentum indicator can show whether buying or selling pressure is strengthening or fading.
A volatility indicator can show whether the market is calm or expanding. A level based indicator can help map support, resistance, or intraday reference points.
Important: Two indicators from the same category often confirm the same idea, not two separate edges.
Types of Technical Indicators
There is more than one type of indicator, and traders often confuse their purpose. The cleanest way to understand them is by timing, display, and function.
Leading vs Lagging Indicators
Leading indicators try to signal a possible move before it fully develops. Oscillators such as RSI or Stochastic Oscillator are often treated as leading because they can warn that momentum is stretched before price reverses.
Lagging indicators react after the price has already moved. SMA, EMA, and MACD often fall into this group because they confirm trend or trend change after price action has already developed.
Leading indicators can help with timing, but they generate more false signals in strong trends. Lagging indicators are slower, but they are often more stable and easier to use in trend following systems.
Oscillator vs Overlay Indicators
Oscillating Indicators move inside a separate panel below or above the main chart. They usually measure momentum or relative position, which is why tools such as RSI, MACD, and Stochastic Oscillator sit outside the candlestick chart.
Overlay Indicators are plotted directly on the price chart. SMA, EMA, Bollinger Bands, VWAP, and Pivot Points are overlays because they sit on top of price and help traders judge structure, direction, or location.
Functional Types of Technical Indicators
Trend Indicators
Trend indicators help traders identify direction. SMA, EMA, and MACD are common tools for deciding whether the market is trending and whether that trend is strengthening or weakening.
Momentum Indicators
Momentum indicators measure the speed of price movement. RSI, MACD, and Stochastic Oscillator help traders judge whether price is accelerating, slowing, or diverging from the trend.
Volatility Indicators
Volatility indicators measure how much price is moving. Bollinger Bands and ATR are widely used to understand whether the market is quiet, expanding, or becoming too unstable for a planned entry.
Volume and Price Level Indicators
Some tools focus on participation or reference levels. VWAP uses price and volume to show average traded value, while Pivot Points and Fibonacci help traders locate probable reaction zones.
Most Important Technical Indicators for Beginners
The best beginner toolkit is not the biggest toolkit. A trader usually learns faster by mastering a core set of technical analysis indicators that cover trend, momentum, volatility, and price location.
Pro Tip: Beginners usually get better results from one trend tool, one momentum tool, and one volatility or level tool than from ten stacked indicators.
SMA
What Is It?
SMA, or Simple Moving Average, calculates the average closing price over a set number of periods. A 20 period SMA, for example, averages the last 20 closes and updates as each new candle appears.
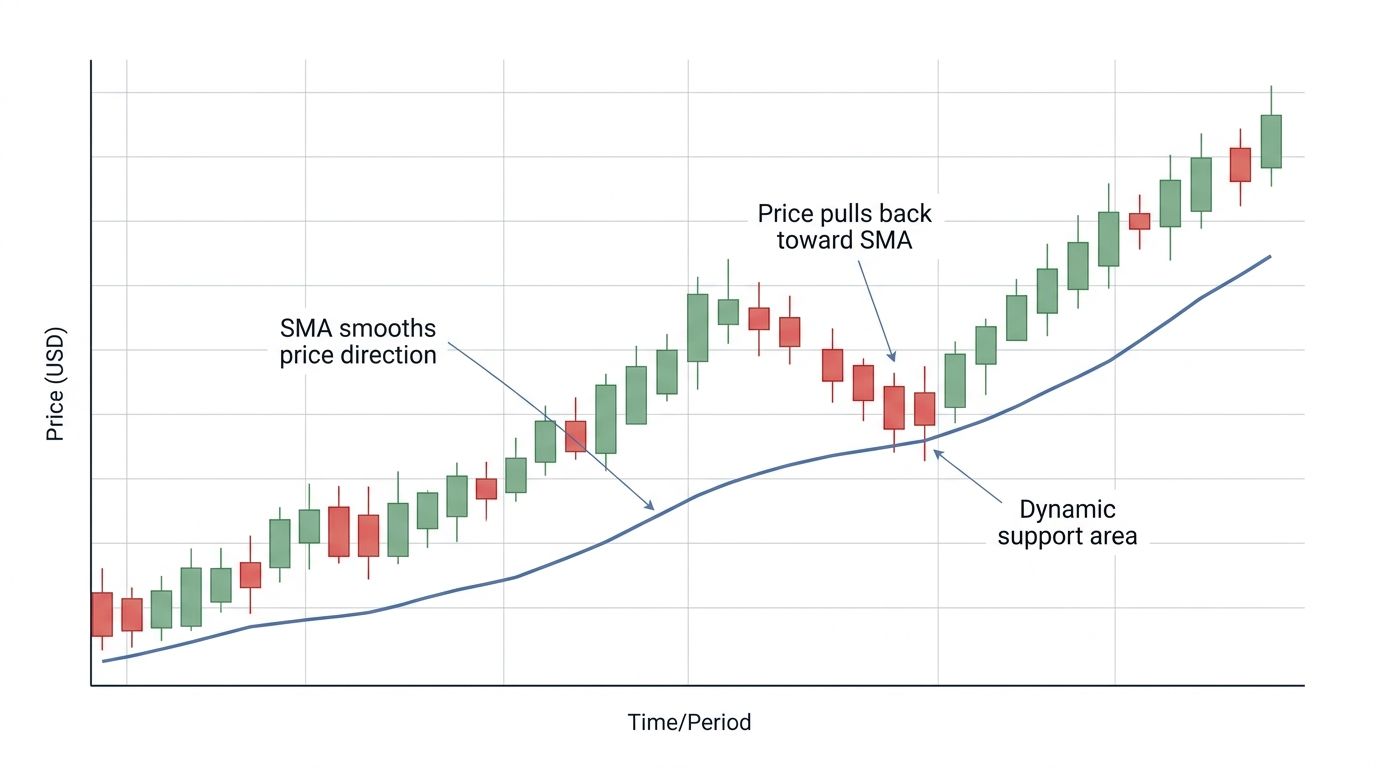
Trading Significance
SMA helps traders identify general direction and filter noise. It is slower than EMA, which makes it useful for broader trend structure, but less responsive for short term entries.
EMA
What Is It?
EMA, or Exponential Moving Average, is a moving average that gives more weight to recent prices. This makes it more reactive than SMA.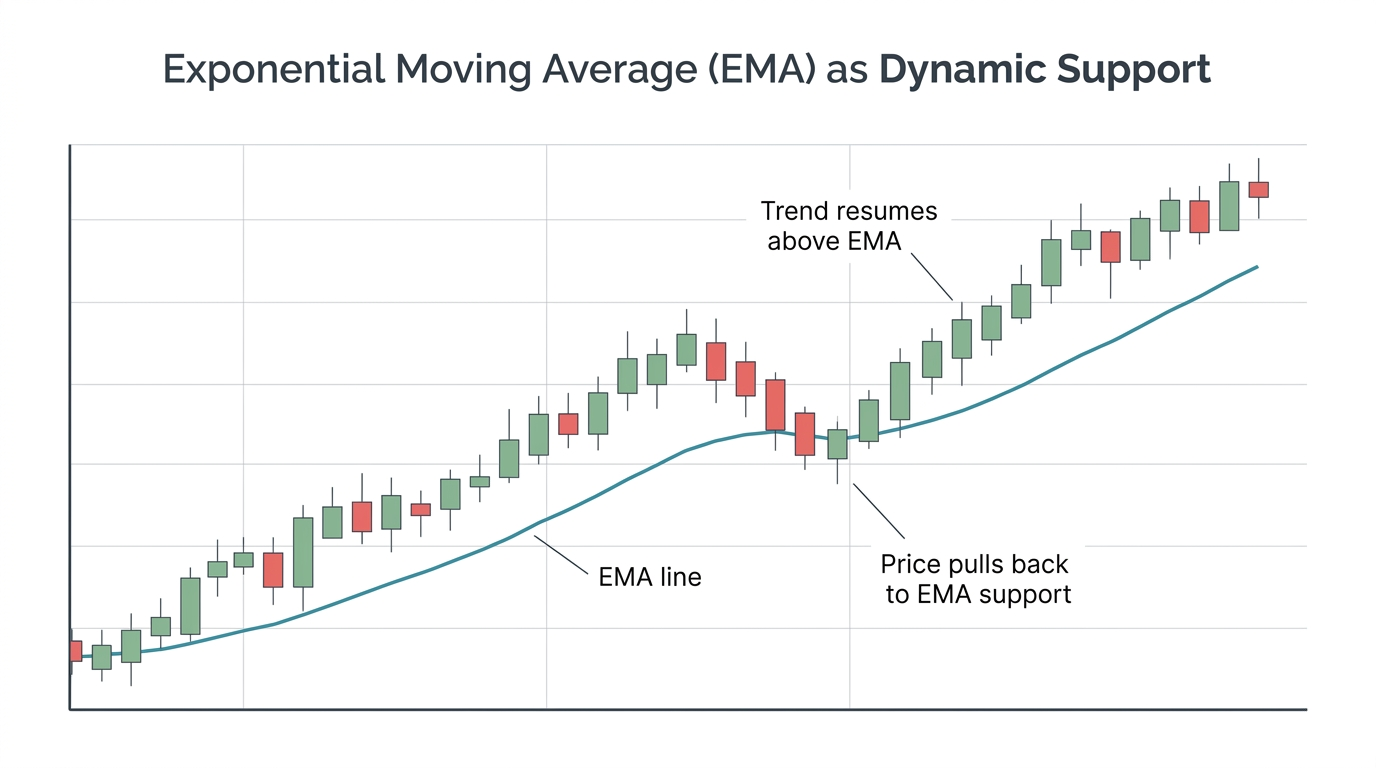
Trading Significance
EMA is widely used for active trend trading because it adjusts faster to price changes. Traders often use it for dynamic support and resistance, pullback entries, and crossover systems.
RSI
What Is It?
RSI, or Relative Strength Index, is a momentum oscillator that measures the speed and magnitude of recent price movement. It usually moves between 0 and 100.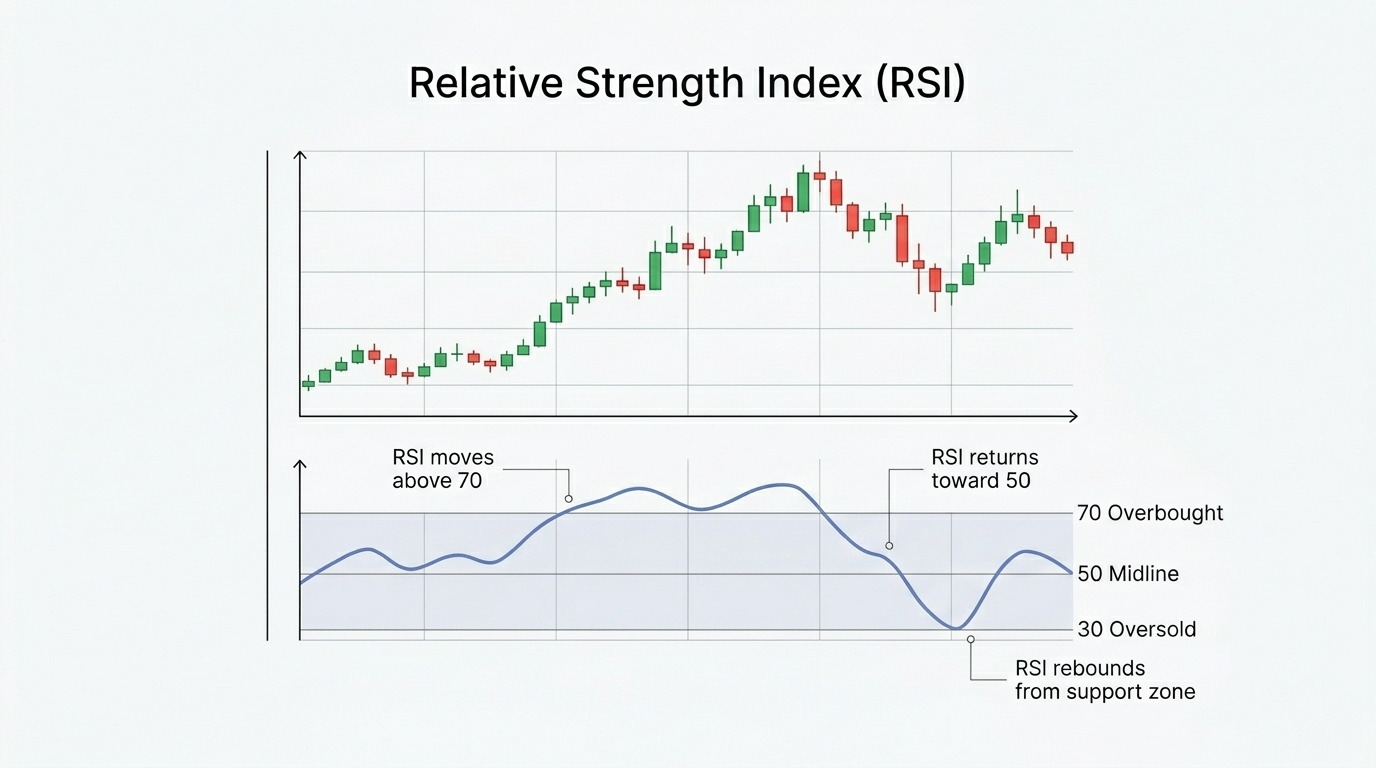
Trading Significance
RSI helps traders spot momentum extremes, divergence, and trend strength. Readings above 70 can suggest overbought conditions, and readings below 30 can suggest oversold conditions, but those signals become weaker if the market is strongly trending.
MACD
What Is It?
MACD, or Moving Average Convergence Divergence, measures the relationship between two moving averages and plots that information with a signal line and histogram. It is both a trend and momentum tool.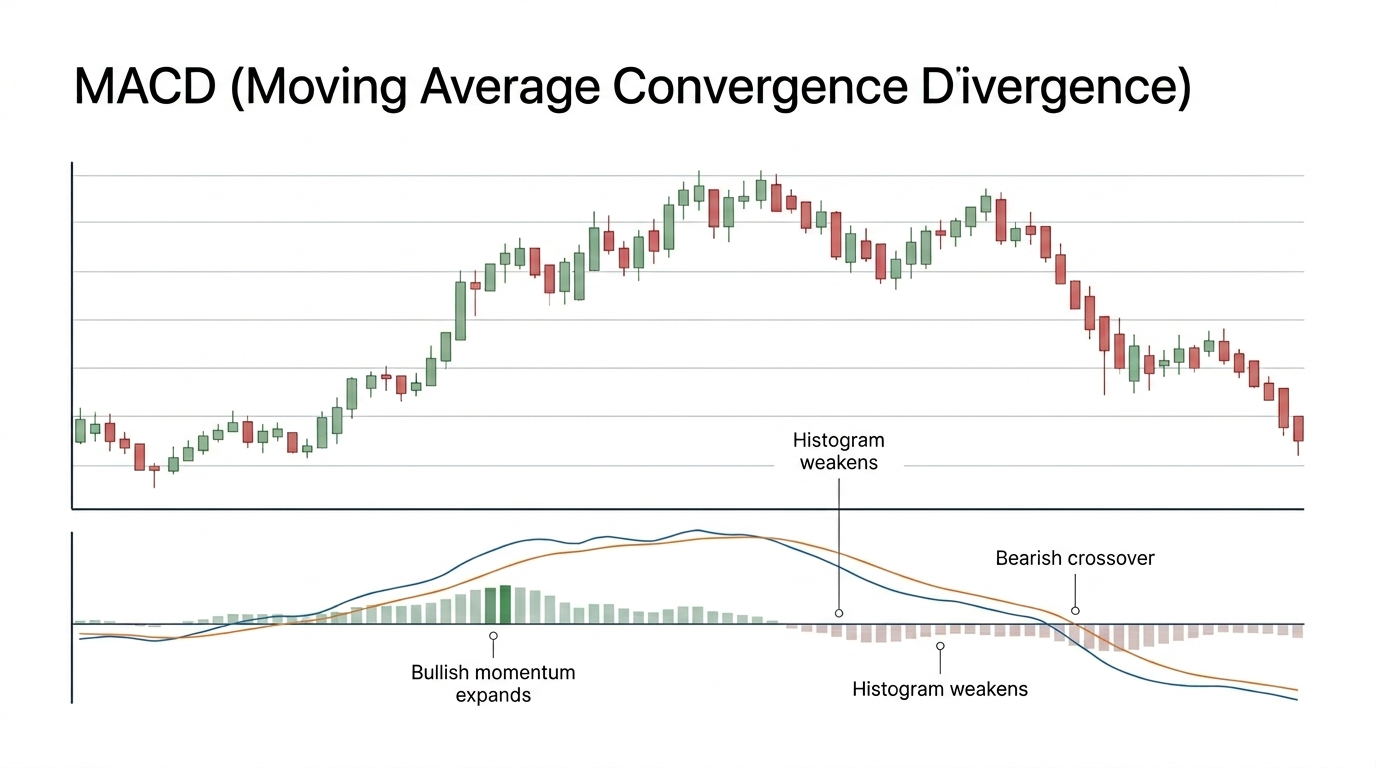
Trading Significance
MACD helps traders spot momentum shifts, possible trend continuation, and crossover signals. The histogram is especially useful for seeing whether momentum is expanding or fading before a full crossover appears.
Stochastic Oscillator
What Is It?
The Stochastic Oscillator compares the latest closing price to the recent trading range. It is designed to show where price is closing relative to that range.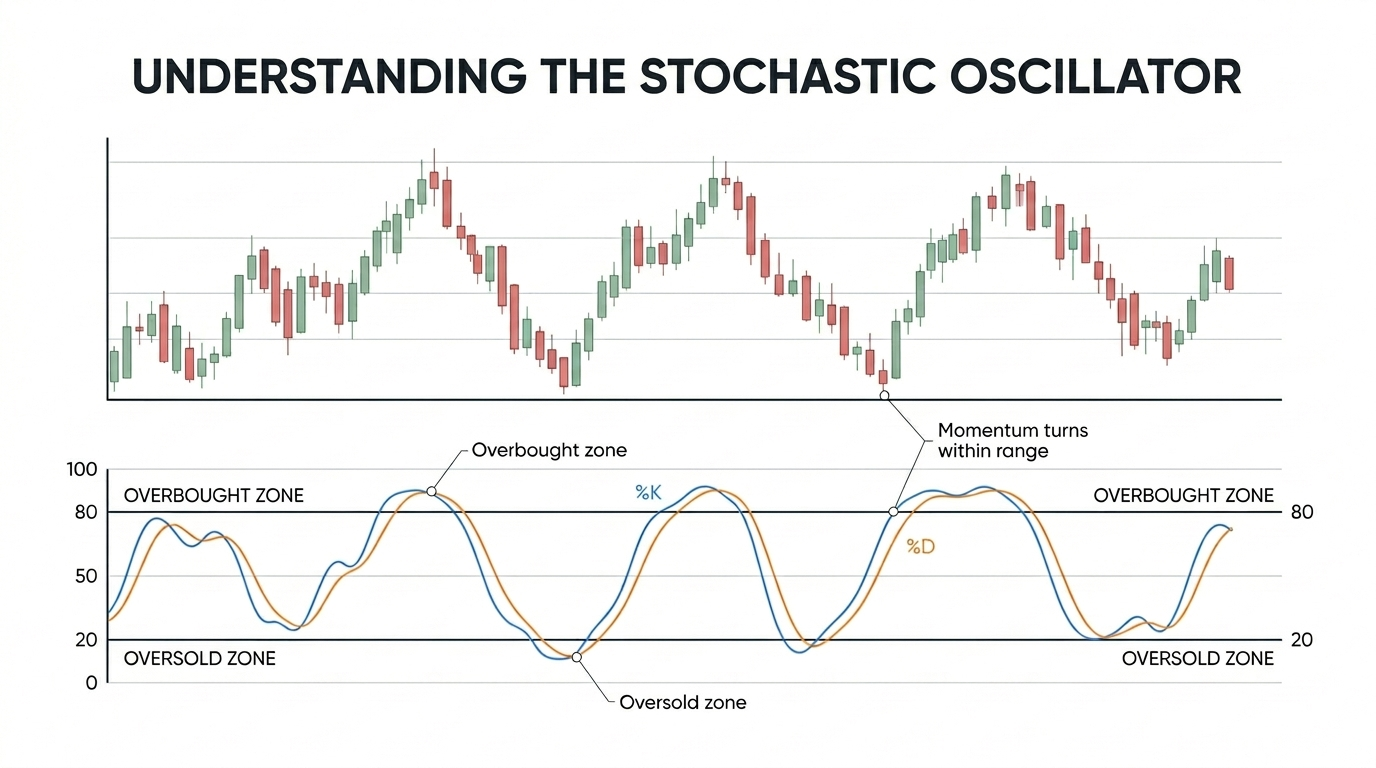
Trading Significance
This indicator is useful for spotting momentum extremes and timing pullbacks inside a range or a slow trend. It is more sensitive than RSI, which can make it useful for entries but also more prone to noise.
Bollinger Bands
What Is It?
Bollinger Bands place an upper band and lower band around a moving average based on standard deviation. The bands widen when volatility expands and narrow when volatility contracts.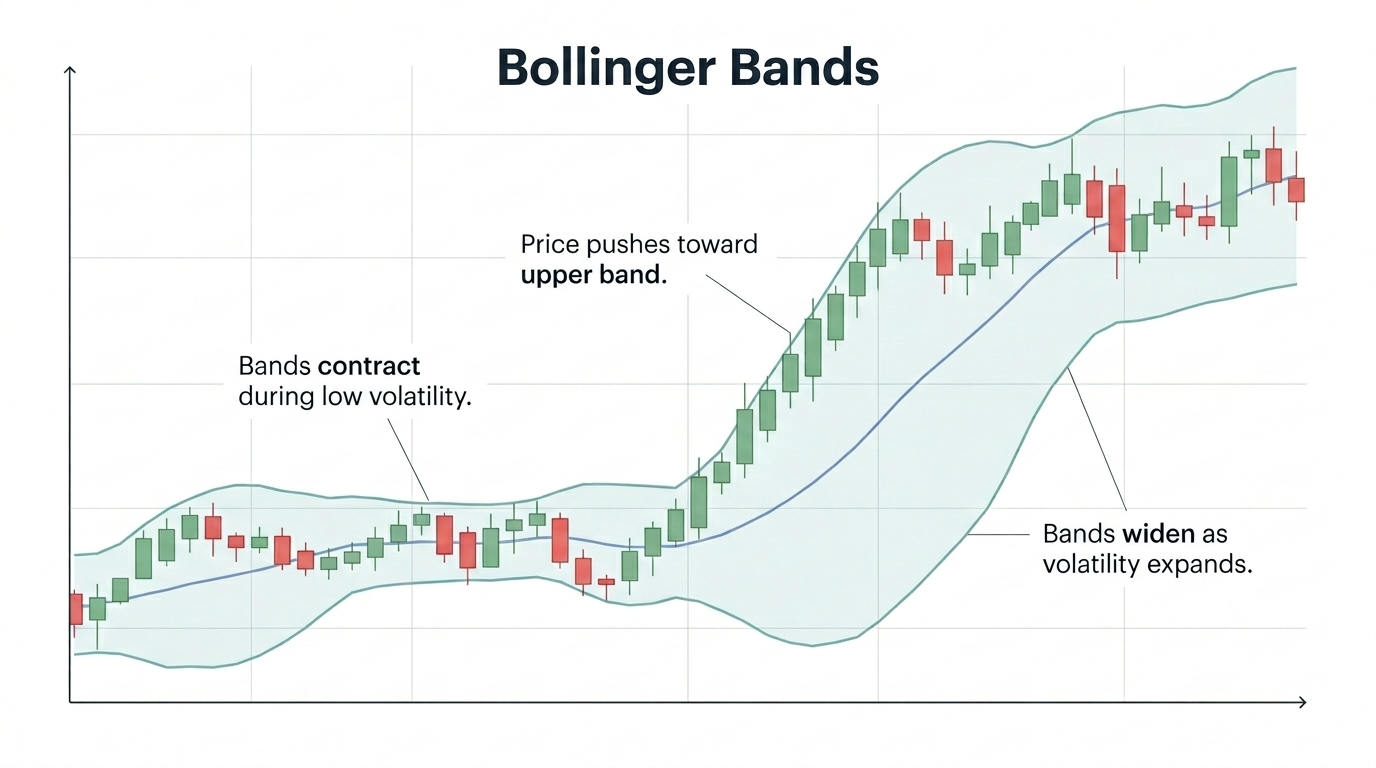
Trading Significance
Bollinger Bands help traders read volatility conditions and possible compression before breakout. They can also help frame mean reversion setups, but touching the outer band alone is not a trade signal.
ATR
What Is It?
ATR, or Average True Range, measures how much price moves on average over a chosen period. It does not show direction. It shows movement size.
Trading Significance
ATR is one of the most practical risk tools for traders. It helps with stop loss placement, position sizing, and deciding whether the market is too quiet or too volatile for a setup.
Fibonacci Retracement
What Is It?
Fibonacci Retracement is a level based tool that plots common pullback ratios such as 38.2 percent, 50 percent, and 61.8 percent between a swing high and swing low. Traders use it to map probable reaction zones.
Trading Significance
Fibonacci is useful when combined with trend structure, support and resistance, or candlestick confirmation. On its own, it is only a reference tool, but with confluence it can improve pullback timing.
VWAP
What Is It?
VWAP, or Volume Weighted Average Price, shows the average traded price adjusted by volume. It is mainly used by intraday traders and institutions.
Trading Significance
VWAP helps traders judge whether price is trading above or below the session’s average value. It can act as a trend filter, a mean reversion reference, or an execution benchmark.
Pivot Points
What Is It?
Pivot Points are pre-calculated price levels derived from the previous session’s high, low, and close. They produce a central pivot plus support and resistance levels.
Trading Significance
Pivot Points are useful for short term traders who want a structured map before the session starts. They work best when combined with trend, session flow, and actual price reaction.
Real World Example Using Multiple Technical Indicators
In this EURUSD daily example, price has rebounded after a pullback and moved back above the moving average, while volume has increased, RSI has climbed back above 50, and MACD has turned higher again.
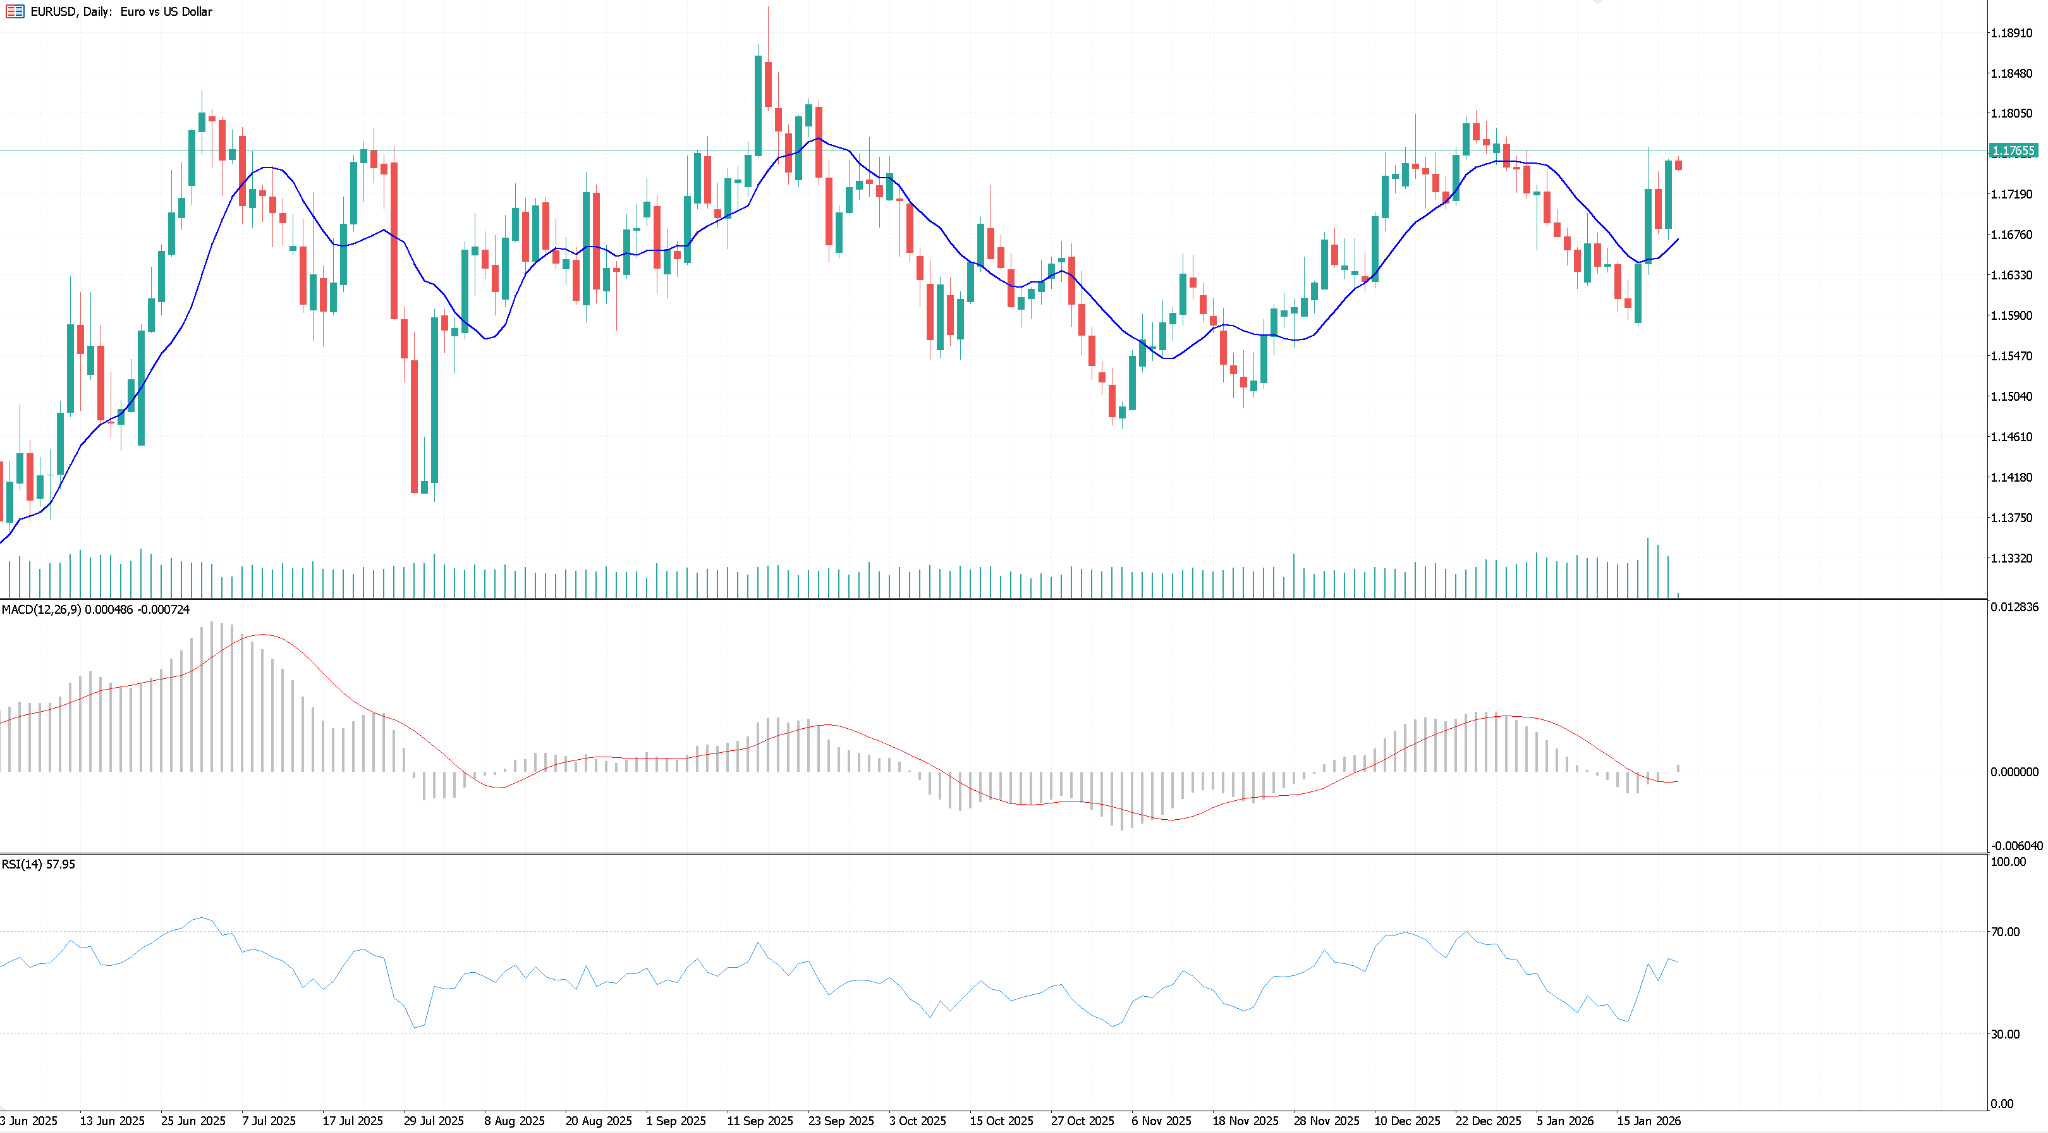
Together, these indicators suggest that buyers are regaining control and momentum is improving, but the recovery is still weaker than the earlier rally and price is approaching resistance, so this is not yet a high conviction breakout.
A practical decision would be to wait for a strong close above the recent highs before entering, because in this setup the moving average shows trend, volume shows participation, RSI shows momentum bias, and MACD shows whether that momentum is strong enough to support continuation.
Advanced Technical Indicator Example With Candlestick and Chart Patterns
Technical indicators work better when they are read together with candlestick behavior and chart structure. In this EUR USD example, price has rebounded above the moving average, volume has increased, RSI has moved back above 50, and MACD has turned higher, so the short term bias has improved.
However, if we look at candlestick and chart patterns, the price is now trading back into a well tested resistance zone, which means the rebound is meeting a decision area rather than breaking into open space.
From a chart pattern perspective, this area can be read as a possible new double top, triple top, or loose head and shoulders structure, but confidence level is not high. The latest candlestick also shows hesitation near resistance, not a strong continuation close, which adds caution.
That creates a mixed signal: the indicators suggest recovery, but the candlestick and chart pattern context show that buyers still need to prove they can break through resistance.
In practice, this is the kind of setup where a trader usually waits for either a strong bullish breakout above resistance or a clear bearish rejection and breakdown before entering.
How to Pick a Technical Indicator for Yourself
The best indicator is the one that fits the trader’s method, time frame, and risk model. There is no universal best tool because scalpers, swing traders, and position traders do not solve the same problem.
A practical starting point is to open a demo account and test a small set of tools in live market conditions without financial risk. If the account is with TMGM, the trader can also connect that practice with platform familiarity and actual execution flow.
After that, the next step is education. A trader should learn the basics of market structure, risk control, and setup building before stacking indicators, which is why studying through the TMGM Trading Academy can help build the right foundation.
Once the basics are clear, the trader can build a simple plan. For example, the plan may use one trend filter such as EMA, one momentum tool such as RSI, and one risk or volatility tool such as ATR.
Then the trader should test that plan over enough trades to judge consistency. The goal is not to find the indicator with the most signals. The goal is to find the indicator mix that fits the plan and produces decisions the trader can repeat.
A good self selection process usually looks like this:
Start with one market and one time frame.
Choose no more than two or three indicators.
Define what each indicator must do in the setup.
Record entries, exits, and reasons for every trade.
Remove indicators that do not improve decisions.
Keep only the tools that match the trading plan.
FAQ
What are technical indicators in trading?
Technical indicators are formulas built from chart data that help traders evaluate trend, momentum, volatility, volume, and price location. They are used to support trade decisions, not to guarantee market direction.
Which technical indicators should beginners learn first?
Most beginners should start with SMA, EMA, RSI, MACD, ATR, and Bollinger Bands. That group covers the main market questions without creating unnecessary complexity.
Are technical indicators enough on their own?
No. Indicators work best when combined with price action, support and resistance, chart patterns, and risk management. A trader who uses indicators without context often gets signals, but not a real edge.


