

Trading
Explore a wide range of markets with competitive pricing, deep liquidity, and advanced trading tools.
Learn More 
Platform
Trade seamlessly with TMGM's powerful platform, built for speed, precision, and a superior trading experience.
Learn More Trading Platform
Academy
Learn the fundamentals of trading with beginner-friendly resources, including guides, webinars, and market insights.
Learn More News & Analysis
Get real-time market updates and expert analysis to stay ahead of trading opportunities
Learn More News & Analysis
About
Learn what sets TMGM apart — our global presence, regulatory strength, and commitment to innovation in trading.
Learn More Why Choose TMGM
Sponsorship
Crypto Today: Bitcoin, Ethereum, XRP fall further as market attention turns to US CPI
- Selling pressure takes Bitcoin below $75,000 on Tuesday as markets await US CPI data.
- Weakening momentum indicators keep Ethereum under pressure near $2,100.
- With gains firmly capped, XRP trades below $1.10 as its decline extends to a sixth consecutive day.
Selling pressure is building across cryptocurrencies on Tuesday. Bitcoin (BTC) remains below $75,000, while Ethereum (ETH) drifts towards $2,100 and Ripple (XRP) stays just beneath immediate resistance at $1.10.
Can US CPI data shift sentiment as risk appetite weakens?
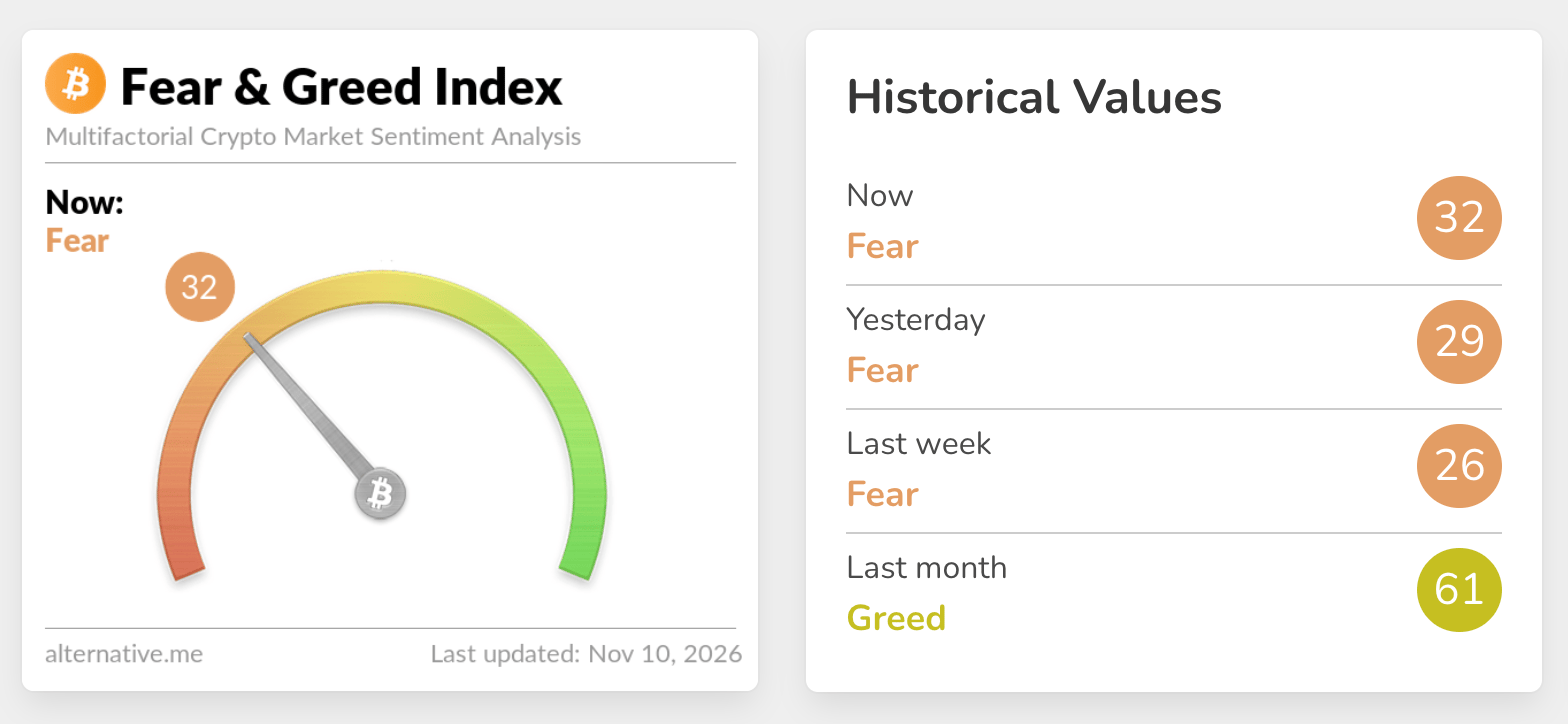
Risk aversion continues to weigh on interest in crypto-related digital investment products. On Tuesday, the Fear & Greed Index stands at 32, remaining in Fear territory despite a modest rise from 29 in the same range a day earlier. The wider decline from last month's reading of 61 in Greed territory underscores the risk-off mood.

Attention across the crypto market is turning to the United States (US) Consumer Price Index (CPI) report, due from the Bureau of Labor Statistics (BLS) later on Tuesday. As a key measure of inflation, the release informs monetary policy decisions at the Federal Reserve (Fed).
An October CPI increase of 0.3% is expected by economists polled by Dow Jones and Bloomberg. Their forecast for core CPI, which strips out volatile food and energy prices, is a 0.2% rise over the previous month.
The release precedes the Fed's December interest rate decision, for which market participants widely anticipate a 25 basis-point interest rate move. In October, rates were left unchanged within the 3.75-4.00% range.
Technical analysis: Can Bitcoin regain $75K as bears tighten their grip?
Trading at $74,743, Bitcoin remains in a corrective phase, with its position below the main Exponential Moving Averages (EMAs) maintaining a bearish near-term outlook. Overhead resistance includes the 200-day EMA at $76,457, the 100-day EMA near $77,575 and the 50-day EMA around $79,141. This positioning suggests that the broader uptrend is under challenge, with the SuperTrend line at $81,375 providing an additional ceiling.
Intermittent rebounds have yet to dispel the weakness in momentum. The Relative Strength Index (RSI) is close to 36 and the Moving Average Convergence Divergence (MACD) remains negative, indicating that downward pressure has not yet run its course.
The first resistance hurdle is the 200-day EMA around $76,457, with the 100-day EMA at $77,575 next in line. A sustained break above the latter would be required to relieve immediate selling pressure. Beyond these levels, a wider supply zone comprises the 50-day EMA near $79,141 and the SuperTrend barrier at $81,375, which would likely restrain advances unless buyers decisively regain control.
The daily chart offers no notable support levels. Unless Bitcoin recovers above these overhead averages, the balance of risks points to further weakness or a retest of lower levels towards $70,000.
In an analysis report sent by email, Crypto Finance said, "Should the macro backdrop improve, we would expect BTC to retest $76,300 first, followed by $78,700. On the downside, the market remains fragile, with limited support below $73,700," and added, "A break lower would bring the August 2026 levels back into focus, with the psychological $70,000 mark the key level to watch."
Ethereum technical analysis: Can ETH loosen the bears' grip?
At $2,113, Ethereum continues to show a distinctly bearish near-term bias. It remains below the $2,229 break point of its upward-sloping support trendline and well beneath the 200-day EMA at $2,301. Further overhead, the 100-day EMA at $2,333, the 50-day EMA at $2,361 and SuperTrend resistance near $2,391 together suggest limited room for rallies. Negative MACD readings and an RSI just above oversold territory point to continuing downside pressure, although short-covering rebounds remain a risk.
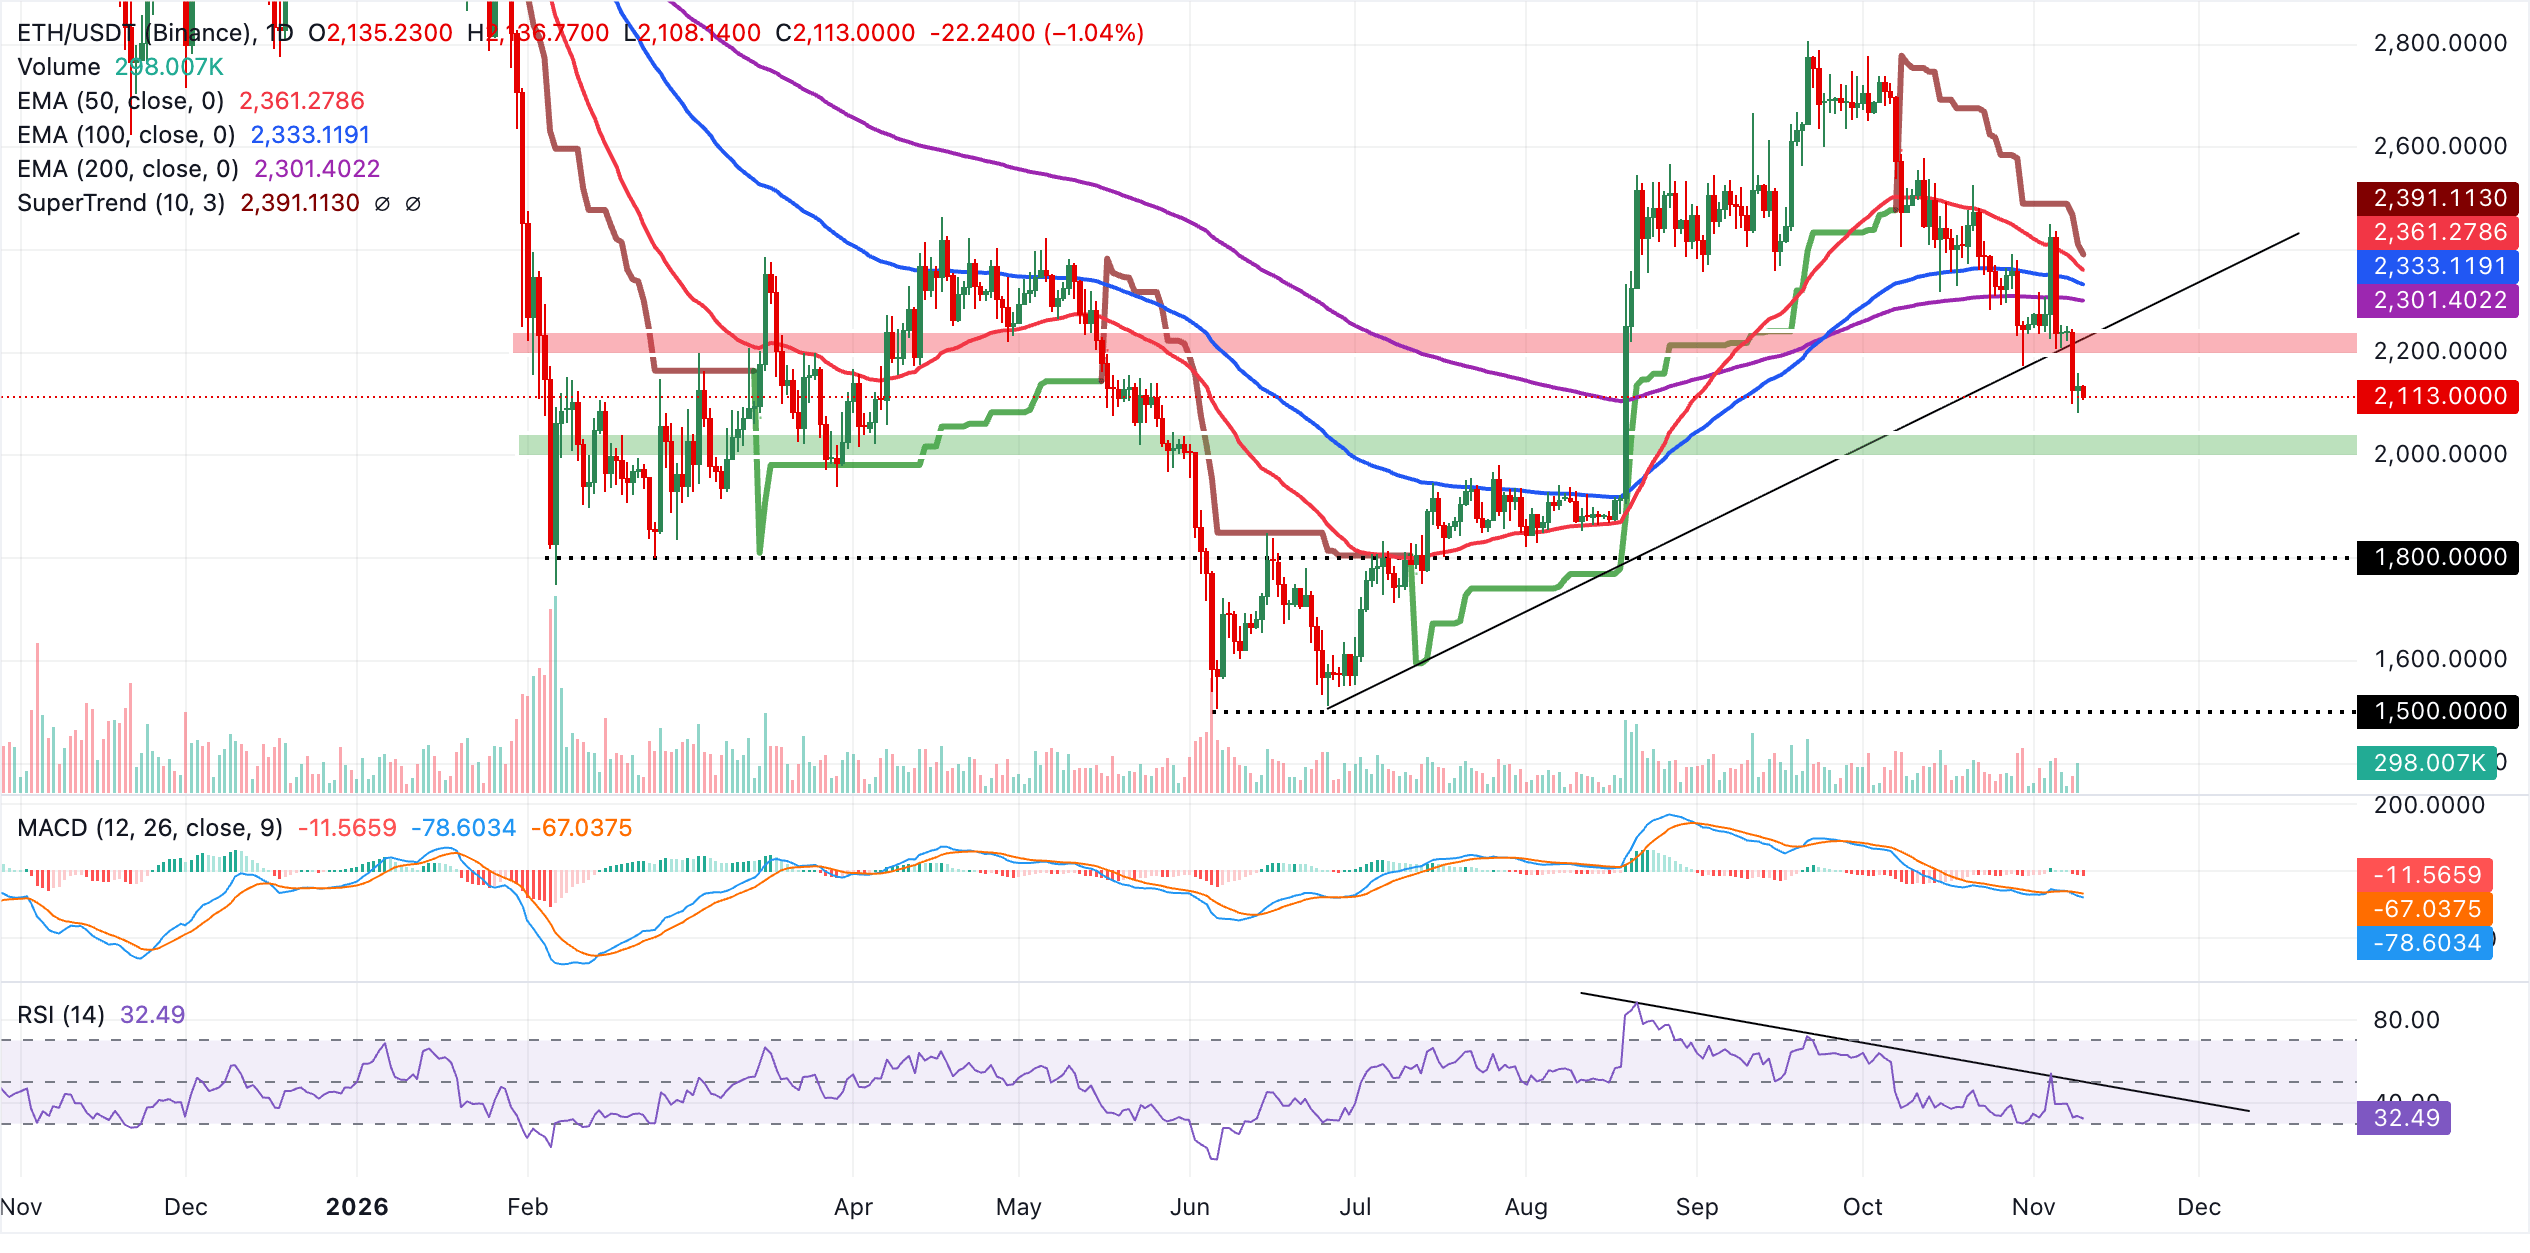
The broken trendline around $2,229 presents the first resistance test, followed by the 200-day EMA at $2,301. Only a sustained advance above these levels would ease the prevailing bearish bias and bring the 100-day EMA at $2,333 and the 50-day EMA at $2,361 into view. The more distant SuperTrend barrier stands at $2,391.
None of the indicators under review identifies nearby structural support below the market, leaving the latest low near the current trading area as a provisional floor. A decisive breach of $2,113 would pave the way for a deeper decline. ETH therefore remains vulnerable as long as it stays below all major moving averages and trend resistance.
Technical analysis: Can XRP interrupt its persistent downtrend?
At $1.09, XRP retains a bearish bias, trading well beneath both the EMA cluster and the active SuperTrend line. The overhead 50-day EMA at $1.29, 100-day EMA at $1.30 and 200-day EMA at $1.35 reinforce the constraints on any advance. Adding to that resistance is the SuperTrend at $1.26.
A MACD reading below zero continues to signal weak momentum, while the RSI has slipped into oversold territory at 26. Together, these indicators suggest that selling pressure is stretched, but has yet to reverse.
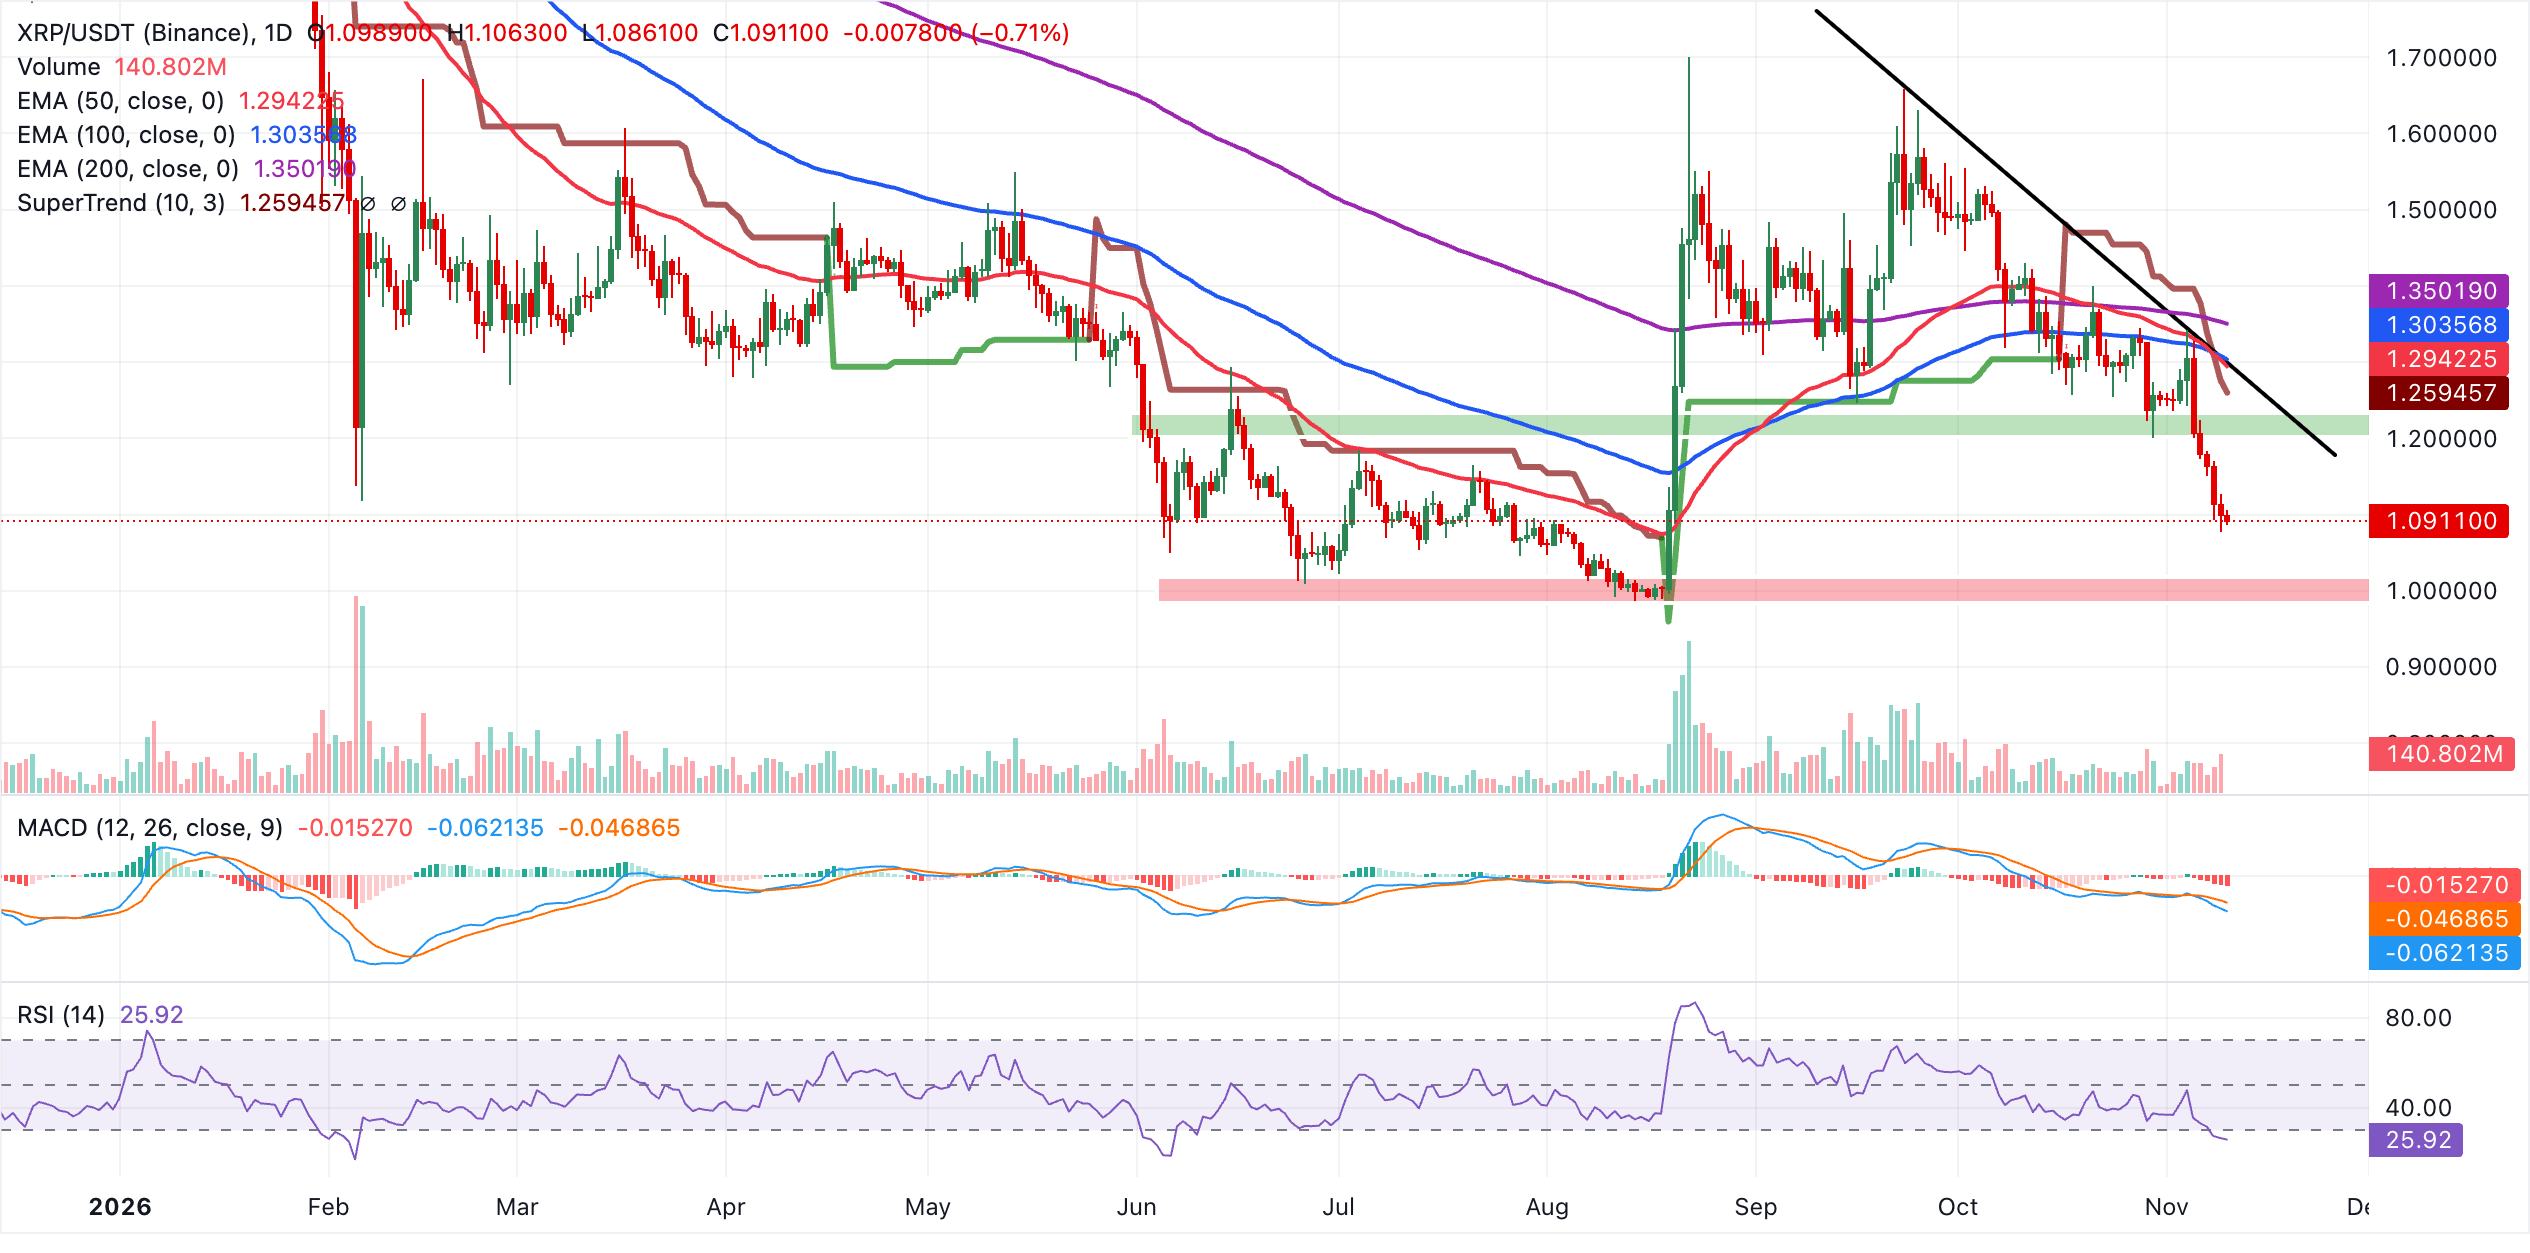
The SuperTrend around $1.26 is the first resistance hurdle. Beyond it lies a dense structural band comprising the 50-day EMA at $1.29 and the break point of the downward resistance trendline at $1.30. Higher still, the 100-day EMA at $1.30 precedes the 200-day EMA near $1.35, a more substantial obstacle to a sustained recovery.
No nearby support is evident in the current set of indicators, leaving the pair exposed beneath these layered resistance levels. Any rebound would likely encounter difficulty on approaching the $1.26-$1.30 region, where the first overhead technical barriers are concentrated.
(The technical analysis of this story was written with the help of an AI tool. Know more.)
FAQs on Bitcoin, altcoins and stablecoins
Designed to function as money, Bitcoin is a virtual currency and the largest cryptocurrency by market capitalisation. No single person, group or entity can control this means of payment, removing the need for third-party involvement in financial transactions.
The term altcoin covers cryptocurrencies other than Bitcoin. Some also exclude Ethereum from this category, as forking originates from these two cryptocurrencies. Under that interpretation, Litecoin is the first altcoin: it was forked from the Bitcoin protocol and is therefore an “improved” version of it.
To maintain a stable price, stablecoins are designed as cryptocurrencies whose value is backed by reserves of the asset they represent. Their value is pegged to a commodity or financial instrument, such as the US Dollar (USD), while an algorithm or demand regulates supply. Their primary purpose is to offer an entry and exit route for investors seeking to trade and invest in cryptocurrencies. They also enable investors to preserve value, given the volatility generally associated with cryptocurrencies.
Measured as Bitcoin's market capitalisation divided by the combined market capitalisation of all cryptocurrencies, Bitcoin dominance offers a clear gauge of investor interest in Bitcoin. High BTC dominance is typically seen before and during a bull run, when investors favour a relatively stable cryptocurrency with a large market capitalisation, such as Bitcoin. By contrast, falling BTC dominance usually signals a shift of capital and/or profits into altcoins in pursuit of higher returns, often triggering a surge in altcoin rallies.
POPULAR ARTICLES
1As traders weigh ECB's rate path, Euro edges higher near 1.11002Japanese Yen rebounds from two-month low amid BoJ rate hike expectations and intervention risk3BoJ's Asada says expected economic impact of past rate increases must be considered4UK inflation: Further upside in sight, says Deutsche Bank – Deutsche Bank5Why is the Canadian Dollar holding steady as hawkish Fed bets stabilise the US Dollar?6USD/CNY reference rate set by PBOC at 6.774, up from 6.7191 previously7Forex fluctuations are excessively rapid, says Japan’s Mimura8WTI falls as OPEC+ output rises and US, Iran avoid further escalation9British Pound holds steady above 1.3250 ahead of UK GDP data


Get Started!
Sign up and access the Global Markets in less than 3 minutes

Connect With Us









Contacts
Phone: +61 2 8036 8388
Fax: +61 2 8036 8388
Email: support@tmgm.com



The information provided on this website is of a general nature only and does not constitute personal financial advice. Before acting on any information on this website, you should consider the suitability of the information in relation to your objectives, financial situation and needs. Investing in CFDs and FX Margin Contracts carries significant risks and is not suitable for all investors. You may lose more than your initial deposit. You do not own, or have, any interest in the underlying asset. We recommend that you seek independent advice and ensure you fully understand the risks involved before trading. It is important that you read and consider the disclosure document before you acquire any product listed on the website. The information and advertisements offered on this website are not intended for use by any person in any country or jurisdiction where such use would be contrary to local laws and regulations. The Products and Services offered on this website are not intended for residents of the United States, Malaysia and Thailand.
TMGM is authorized and regulated in various jurisdictions.
Trademax Australia Limited, trading as TMGM, is regulated by the Australian Securities and Investments Commission (ASIC), AFSL no. 436416 and is located at Level 28, One International Tower, 100 Barangaroo Avenue, 2000 Sydney, NSW Australia.
Email: support@tmgm.com.au
Trademax Global Limited, trading as TMGM, is authorized and regulated by the Vanuatu Financial Services Commission (VFSC), registration number 40356 and registered at 1276, Kumul Highway, Port Vila, Vanuatu, Republic of Vanuatu.
Email: support@tmgm.com
Trademax Global Markets (SE) Limited, trading as TMGM, is authorized and regulated by the Financial Services Authority (FSA) of Seychelles, with license number SD224. The company is registered at Office No 13, Providence Estate ABIS Centre, Mahe, Seychelles.
Email: support@tmgm.com
Trademax Global Markets (International) Pty Ltd, trading as TMGM, is authorized and regulated by the Financial Services Commission, Mauritius (FSC) with license no. GB22201012, and registered at 33, Edith Cavell Street C/o IQ EQ Fund Services (Mauritius) Ltd Port Louis, 11324 Mauritius.
Email: support@tmgm.com
Copyright © TMGM. All rights reserved