

Trading
Explore a wide range of markets with competitive pricing, deep liquidity, and advanced trading tools.
Learn More 
Platform
Trade seamlessly with TMGM's powerful platform, built for speed, precision, and a superior trading experience.
Learn More Trading Platform
Academy
Learn the fundamentals of trading with beginner-friendly resources, including guides, webinars, and market insights.
Learn More News & Analysis
Get real-time market updates and expert analysis to stay ahead of trading opportunities
Learn More News & Analysis
About
Learn what sets TMGM apart — our global presence, regulatory strength, and commitment to innovation in trading.
Learn More Why Choose TMGM
Sponsorship
Ethereum Price Forecast: Whales resume accumulation as ETF flows remain strong
Ethereum price today: $2,680
- Whales returned to accumulation this week, scooping 260K ETH after a brief distribution last week.
- ETH ETFs continue their strong run, with a fourth consecutive day of net inflows worth $104.6 million.
- ETH bounces near 20-day EMA after a brief decline.
Ethereum whales have returned to accumulation after last week's modest distributions following the Clarity Act's failure to progress in the Senate.
Wallets with a balance of 10K-100K ETH offloaded 140K ETH within three days after Congress halted the legislation, according to CryptoQuant data. However, this cohort of investors has bounced back, scooping 260K ETH since Saturday.

Retail traders, meanwhile, have shown mixed activity. Wallets with a balance of 1K-10K largely held steady since last week before a slight 50K ETH distribution across the past two days.
On the other hand, investors holding 100-1K ETH continued their selling trend, offloading roughly 140K ETH since the Clarity Act's failure.
Broadly, exchange flow data shows withdrawals outpacing deposits over the past few days after last week's spike in inflows. The move indicates dip-buying mixed with modest profit-taking upon negative macro news.
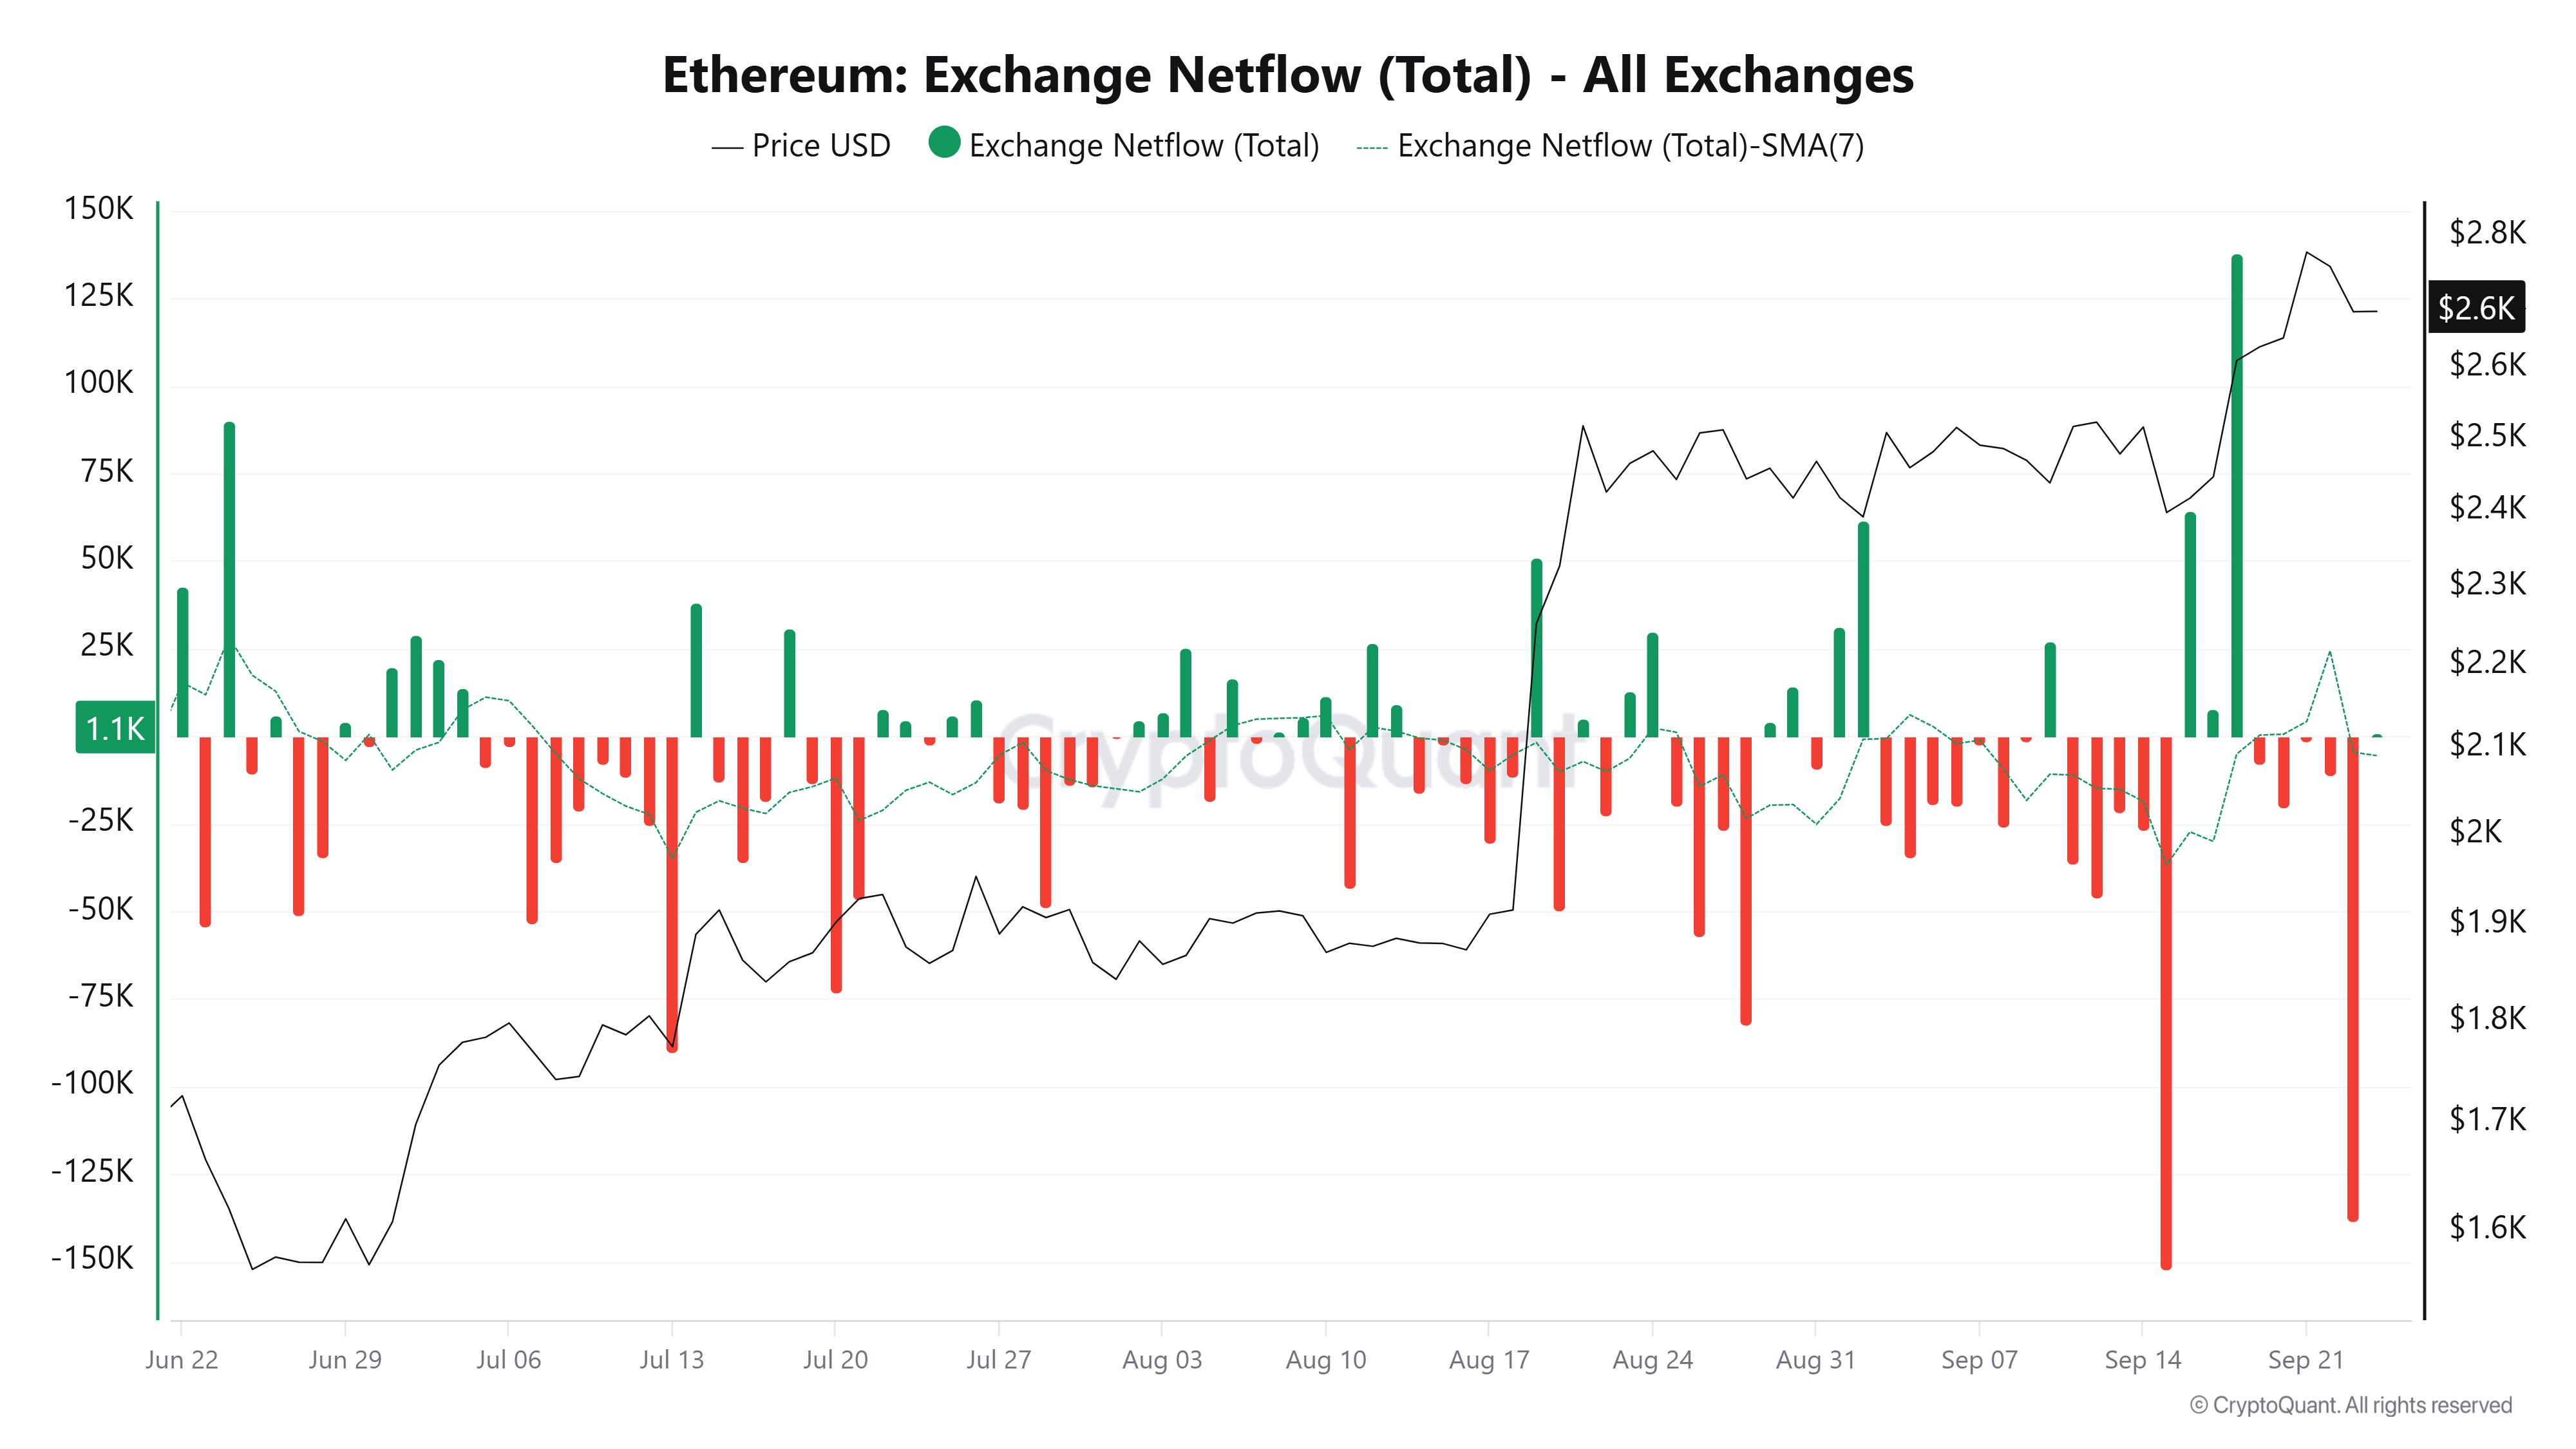
The institutional front shows strength, with US spot ETH exchange-traded funds (ETFs) recording a fourth consecutive day of net inflow worth $104.63 million. BlackRock's ETHA and Fidelity's FETH continue to lead the pack.
Despite ETH's strength, the macro picture leaves room for caution. Brent crude rose nearly 3% on Thursday as talks between the US and Iran appear to have collapsed. Treasury yields continue to rise, with the US 10Y Note Yield rising above 5.15% for the first time since June 2007.
Ethereum technical outlook: ETH finds support near 20-day EMA
Ethereum recorded $74.5 million in liquidations over the past 24 hours, led by $44.4 million in long liquidations, according to Coinglass data.
ETH bounced near the 20-day Exponential Moving Average (EMA) as it continues to trade above both the short- and long-term averages. The 14-day Relative Strength Index (RSI) at 63 and the Stochastic Oscillator (Stoch) near 75 suggest firm but not extreme bullish momentum.
On the downside, initial support is seen at the recent horizontal floor around $2,626, ahead of the 20-day EMA at $2,564, followed by $2,544, which together form a near-term demand cluster. Further below, $2,431 and the 50-day EMA at $2,381 guard the pullback, before deeper supports at $2,242, $2,230 and $2,172.
On the topside, immediate resistance emerges at $2,786, followed by $2,894, while a more distant barrier awaits at $3,177, where buying pressure could start to fade if momentum indicators edge further into overbought territory.
(The technical analysis of this story was written with the help of an AI tool. Know more.)
POPULAR ARTICLES
1New Zealand Dollar grinds lower as US bond yields climb to new highs2Dow Jones Industrial Average falls a third day as bond yields climb3Pound Sterling slides again as Fed speakers line up behind another hike4Indonesian Rupiah: BI prioritizes IDR stability – Commerzbank5Ethereum Price Forecast: Whales resume accumulation as ETF flows remain strong6Banxico: Flexible stance with upside risks – Rabobank7Norwegian Krone: Norges Bank hike supports currency – BBH8Mexican Peso slides to April lows as Banxico shrugs off Fed gap9SEC’s Peirce urges shift from KYC/AML data collection to zero-knowledge proofs
LIVE QUOTES


ALL ABOUT TECHNICAL
What Is the Dark Cloud Cover Pattern and How Do You Trade It?
What Is the Piercing Line Candlestick Pattern and How Do You Trade It?
What Are Tweezer Top and Bottom Candlestick Patterns?
Inside Bar Candlestick Pattern: What It Is, How to Identify It, and How to Trade It
Hanging Man Candlestick Pattern: How to Identify and Trade It
VWMA vs VWAP: Key Differences, Formulas and Which to Use
What Is Volume-Weighted Average Price (VWAP)? Formula, Settings and Strategies
Volume Weighted Moving Average (VWMA): Formula, Signals, and Strategy
What Is the Three Black Crows Pattern and How to Trade It?
Get Started!
Sign up and access the Global Markets in less than 3 minutes

Connect With Us









Contacts
Phone: +61 2 8036 8388
Fax: +61 2 8036 8388
Email: support@tmgm.com



The information provided on this website is of a general nature only and does not constitute personal financial advice. Before acting on any information on this website, you should consider the suitability of the information in relation to your objectives, financial situation and needs. Investing in CFDs and FX Margin Contracts carries significant risks and is not suitable for all investors. You may lose more than your initial deposit. You do not own, or have, any interest in the underlying asset. We recommend that you seek independent advice and ensure you fully understand the risks involved before trading. It is important that you read and consider the disclosure document before you acquire any product listed on the website. The information and advertisements offered on this website are not intended for use by any person in any country or jurisdiction where such use would be contrary to local laws and regulations. The Products and Services offered on this website are not intended for residents of the United States, Malaysia and Thailand.
TMGM is authorized and regulated in various jurisdictions.
Trademax Australia Limited, trading as TMGM, is regulated by the Australian Securities and Investments Commission (ASIC), AFSL no. 436416 and is located at Level 28, One International Tower, 100 Barangaroo Avenue, 2000 Sydney, NSW Australia.
Email: support@tmgm.com.au
Trademax Global Limited, trading as TMGM, is authorized and regulated by the Vanuatu Financial Services Commission (VFSC), registration number 40356 and registered at 1276, Kumul Highway, Port Vila, Vanuatu, Republic of Vanuatu.
Email: support@tmgm.com
Trademax Global Markets (SE) Limited, trading as TMGM, is authorized and regulated by the Financial Services Authority (FSA) of Seychelles, with license number SD224. The company is registered at Office No 13, Providence Estate ABIS Centre, Mahe, Seychelles.
Email: support@tmgm.com
Trademax Global Markets (International) Pty Ltd, trading as TMGM, is authorized and regulated by the Financial Services Commission, Mauritius (FSC) with license no. GB22201012, and registered at 33, Edith Cavell Street C/o IQ EQ Fund Services (Mauritius) Ltd Port Louis, 11324 Mauritius.
Email: support@tmgm.com
Copyright © TMGM. All rights reserved