

Trading
Explore a wide range of markets with competitive pricing, deep liquidity, and advanced trading tools.
Learn More 
Platform
Trade seamlessly with TMGM's powerful platform, built for speed, precision, and a superior trading experience.
Learn More Trading Platform
Academy
Learn the fundamentals of trading with beginner-friendly resources, including guides, webinars, and market insights.
Learn More News & Analysis
Get real-time market updates and expert analysis to stay ahead of trading opportunities
Learn More News & Analysis
About
Learn what sets TMGM apart — our global presence, regulatory strength, and commitment to innovation in trading.
Learn More Why Choose TMGM
Sponsorship
1.3140: GBP/USD support turns into resistance
- 1.3110 comes back into view as GBP/USD recovers from two days of steep losses.
- A persistently hawkish Fed tone keeps the US Dollar supported.
- 0.7% MoM growth in October UK Retail Sales beats forecasts for no change.
1.3110 is within reach as the British Pound (GBP) recovers against the US Dollar. During Friday’s European session, GBP/USD breaks a two-day losing streak, drawing buyers after an earlier fall to 1.3079, its lowest level in almost a year.
A brief pause in the US Dollar rally gives Cable some temporary support. At the time of writing, the US Dollar Index (DXY) edges lower to around 103.85. The index, which tracks the Greenback against six major currencies, had reached a fresh 19-month high near 104.00 the day before.

Concerns that the Federal Reserve (Fed) will raise interest rates at consecutive meetings in the near term leave the US Dollar outlook looking bullish.
US Dollar supported by renewed hawkish FOMC expectations
A substantial repricing of the US interest-rate path has taken place, according to analysts at Rabobank. They say the OIS curve now signals that “investors are positioned for a full hike in December, followed by close to 70% of a 25bp hike priced in for the January meeting.” The analysts describe this pricing as “in line with Waller’s comments, after having moved from one of the most hawkish to one of the most dovish FOMC members and now back among the most hawkish.” Rabobank says his latest calls favour “either a 50bp hike at the December meeting or a 25bp hike accompanied by clear forward guidance from Warsh that an additional hike will follow in January.” In this environment, the bank notes that “the USD has continued to dominate FX markets, with the DXY Index climbing back to levels not seen since 2025 on the back of elevated US hiking expectations and safe-haven demand.”
For the British Pound, October Retail Sales figures from the United Kingdom (UK) exceeded expectations. Instead of the forecast flat reading, sales increased 0.7% Month-on-Month (MoM), the Office for National Statistics (ONS) reported.
1.3197 EMA Caps GBP/USD: Technical Analysis
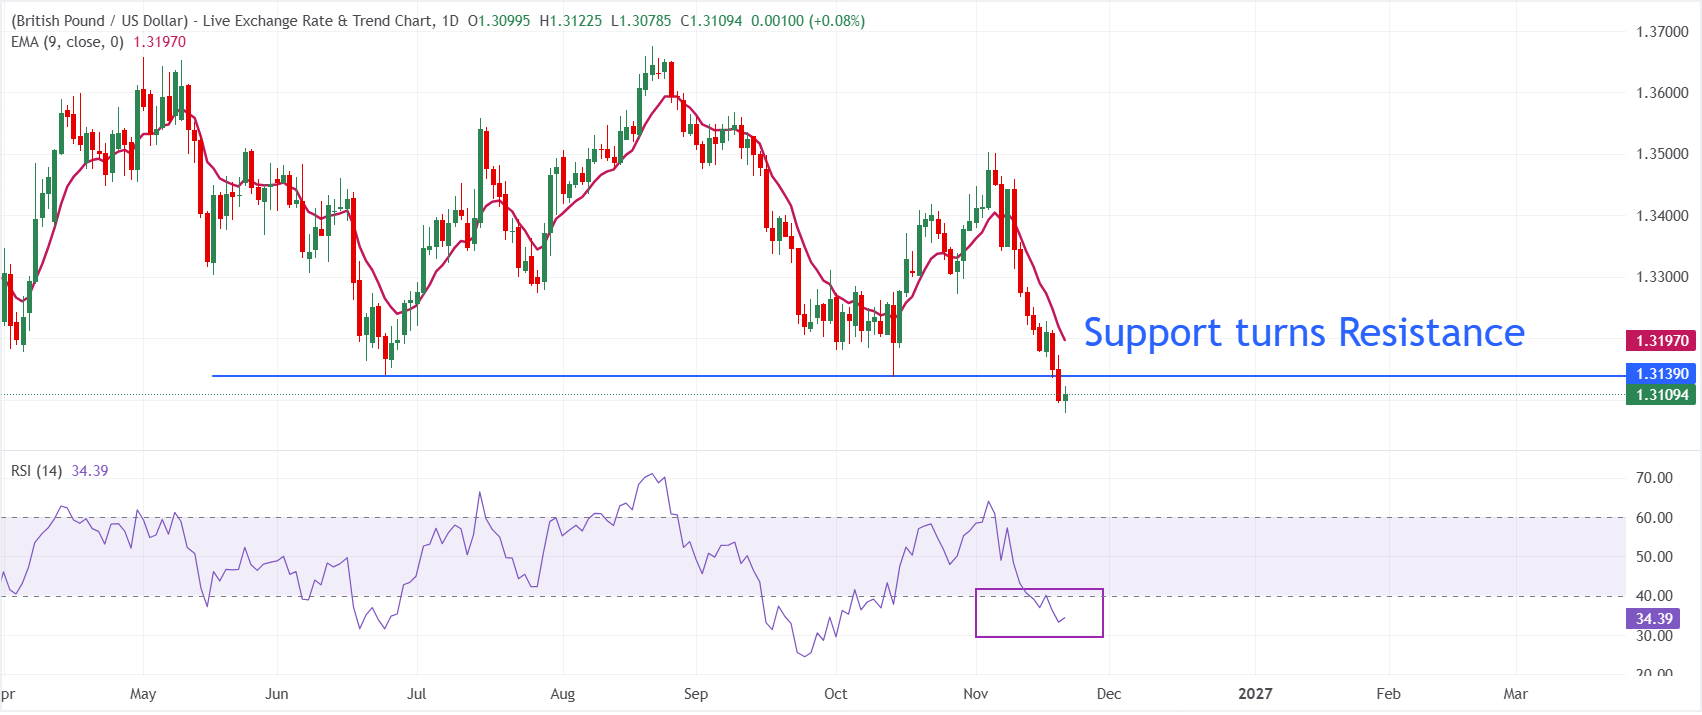
At 1.3109 on the daily chart, GBP/USD retains a bearish near-term bias below its 9-period Exponential Moving Average (EMA) of 1.3197. Rebounds remain capped by this short-term EMA, keeping the pair under pressure. However, the Relative Strength Index (RSI), at around 34, points to easing downside momentum rather than an accelerating slide into oversold territory.
A break below the 24 June low of 1.3140 has heightened concerns over another downward leg. That level now represents a key hurdle for the pair, while further losses could take GBP/USD towards 1.3000.
(The technical analysis of this story was written with the help of an AI tool. Know more.)
Economic Data Indicator
Retail Sales: Month-on-Month (MoM)
Published monthly by the Office for National Statistics, Retail Sales measures the volume of goods sold directly to end customers by retailers in Great Britain. Markets closely monitor changes in the data as a gauge of consumer spending. Percentage changes show how quickly these sales volumes are changing; the MoM figure compares the reference month with the preceding month. A high reading is generally regarded as positive for Pound Sterling (GBP), whereas a low reading is considered negative.
View more.Latest release: Fri 20 Nov 2026 07:00
Release frequency: Monthly
Actual reading: 0.7%
Market consensus: 0%
Previous reading: -0.4%
Data source: Office for National Statistics
POPULAR ARTICLES
1LatAm FX: Strong Dollar weighs on Real and Peso – ING2Bitcoin Weekly Forecast: Turbulence persists31.3140: GBP/USD support turns into resistance4Japanese Yen: AI-driven risk aversion could support Yen against US Dollar – MUFG5Steepest weekly fall since March looms for gold as Fed hike bets and forced selling weigh60.8485 in view for Swiss Franc as UOB sees further weakness against US Dollar7South African Rand: Politics and metals eclipse SARB’s hawkish stance – Commerzbank8$1.00 eludes XRP despite Binance supply shortage: Ripple Price Forecast9Mexican Peso weakens against US Dollar on hawkish Fed stance – Societe Generale

Get Started!
Sign up and access the Global Markets in less than 3 minutes

Connect With Us









Contacts
Phone: +61 2 8036 8388
Fax: +61 2 8036 8388
Email: support@tmgm.com



The information provided on this website is of a general nature only and does not constitute personal financial advice. Before acting on any information on this website, you should consider the suitability of the information in relation to your objectives, financial situation and needs. Investing in CFDs and FX Margin Contracts carries significant risks and is not suitable for all investors. You may lose more than your initial deposit. You do not own, or have, any interest in the underlying asset. We recommend that you seek independent advice and ensure you fully understand the risks involved before trading. It is important that you read and consider the disclosure document before you acquire any product listed on the website. The information and advertisements offered on this website are not intended for use by any person in any country or jurisdiction where such use would be contrary to local laws and regulations. The Products and Services offered on this website are not intended for residents of the United States, Malaysia and Thailand.
TMGM is authorized and regulated in various jurisdictions.
Trademax Australia Limited, trading as TMGM, is regulated by the Australian Securities and Investments Commission (ASIC), AFSL no. 436416 and is located at Level 28, One International Tower, 100 Barangaroo Avenue, 2000 Sydney, NSW Australia.
Email: support@tmgm.com.au
Trademax Global Limited, trading as TMGM, is authorized and regulated by the Vanuatu Financial Services Commission (VFSC), registration number 40356 and registered at 1276, Kumul Highway, Port Vila, Vanuatu, Republic of Vanuatu.
Email: support@tmgm.com
Trademax Global Markets (SE) Limited, trading as TMGM, is authorized and regulated by the Financial Services Authority (FSA) of Seychelles, with license number SD224. The company is registered at Office No 13, Providence Estate ABIS Centre, Mahe, Seychelles.
Email: support@tmgm.com
Trademax Global Markets (International) Pty Ltd, trading as TMGM, is authorized and regulated by the Financial Services Commission, Mauritius (FSC) with license no. GB22201012, and registered at 33, Edith Cavell Street C/o IQ EQ Fund Services (Mauritius) Ltd Port Louis, 11324 Mauritius.
Email: support@tmgm.com
Copyright © TMGM. All rights reserved