

Trading
Explore a wide range of markets with competitive pricing, deep liquidity, and advanced trading tools.
Learn More 
Platform
Trade seamlessly with TMGM's powerful platform, built for speed, precision, and a superior trading experience.
Learn More Trading Platform
Academy
Learn the fundamentals of trading with beginner-friendly resources, including guides, webinars, and market insights.
Learn More News & Analysis
Get real-time market updates and expert analysis to stay ahead of trading opportunities
Learn More News & Analysis
About
Learn what sets TMGM apart — our global presence, regulatory strength, and commitment to innovation in trading.
Learn More Why Choose TMGM
Sponsorship
XAG/USD extends correction ahead of US NFP data: Silver price forecast
- $51.40 comes into view as Silver extends its decline before US NFP data.
- With US NFP in focus, the US Dollar advances sharply.
- Last week, the Fed’s Logan described the labour market as broadly balanced, if anything slightly tight.
$51.40 is the level Silver (XAG/USD) is approaching. During Friday’s European session, the metal extends its correction from the weekly high of $53.45. Renewed US Dollar strength weighs on Silver as investors adopt a cautious stance before October’s United States (US) Nonfarm Payrolls (NFP) release at 13:30 GMT.
At the time of writing, a 0.36% gain puts the US Dollar Index (DXY) near 101.92. The index measures the Greenback against six major currencies.
US Dollar: Today’s Currency Moves
Against the major currencies listed below, today’s percentage moves in the US Dollar (USD) are shown in the table. Its largest gain was against the Australian Dollar.
| USD | EUR | GBP | JPY | CAD | AUD | NZD | CHF | |
|---|---|---|---|---|---|---|---|---|
| USD | 0.34% | 0.31% | 0.09% | 0.32% | 0.88% | 0.68% | -0.02% | |
| EUR | -0.34% | -0.03% | -0.25% | -0.01% | 0.54% | 0.36% | -0.36% | |
| GBP | -0.31% | 0.03% | -0.19% | 0.01% | 0.58% | 0.39% | -0.32% | |
| JPY | -0.09% | 0.25% | 0.19% | 0.24% | 0.79% | 0.58% | -0.11% | |
| CAD | -0.32% | 0.00% | -0.01% | -0.24% | 0.55% | 0.34% | -0.35% | |
| AUD | -0.88% | -0.54% | -0.58% | -0.79% | -0.55% | -0.20% | -0.89% | |
| NZD | -0.68% | -0.36% | -0.39% | -0.58% | -0.34% | 0.20% | -0.68% | |
| CHF | 0.02% | 0.36% | 0.32% | 0.11% | 0.35% | 0.89% | 0.68% |
Percentage moves between the major currencies appear in the heat map. Select the base currency in the left-hand column and the quote currency in the top row. Selecting the US Dollar on the left and reading across to the Japanese Yen, for instance, gives the percentage change for USD (base)/JPY (quote).
In technical terms, US Dollar appreciation makes Silver less attractive to investors on a risk-reward basis.
65K US NFP Forecast; Other Key Labour Data in Focus
Estimates put new hiring by US employers at 65K, compared with 29K in September. The Unemployment Rate is expected to remain at 4.2%.
Annual growth in Average Hourly Earnings, a key wage indicator, is forecast to moderate to 2.9% year-on-year (YoY) from September’s 3%. The monthly increase is expected to reach 0.3%, up from the previous 0.1% reading.
US NFP Seen Having Limited Effect on Fed Policy Expectations
Expectations for Federal Reserve (Fed) interest rates are unlikely to shift substantially on the US NFP release. Officials’ recent comments following the late-October monetary policy decision have signalled that the central bank will remain on a tightening path amid upside risks to inflation.
Last week, Dallas Fed Bank President Lorie Logan called for “at least two more quarter-point rate hikes”. She described inflation’s failure to move back towards the 2% target as “unacceptable”. On employment conditions, Logan said, “Labor market is balanced, perhaps tightening a bit.”
$51.45 Silver: Weekly Technical Outlook
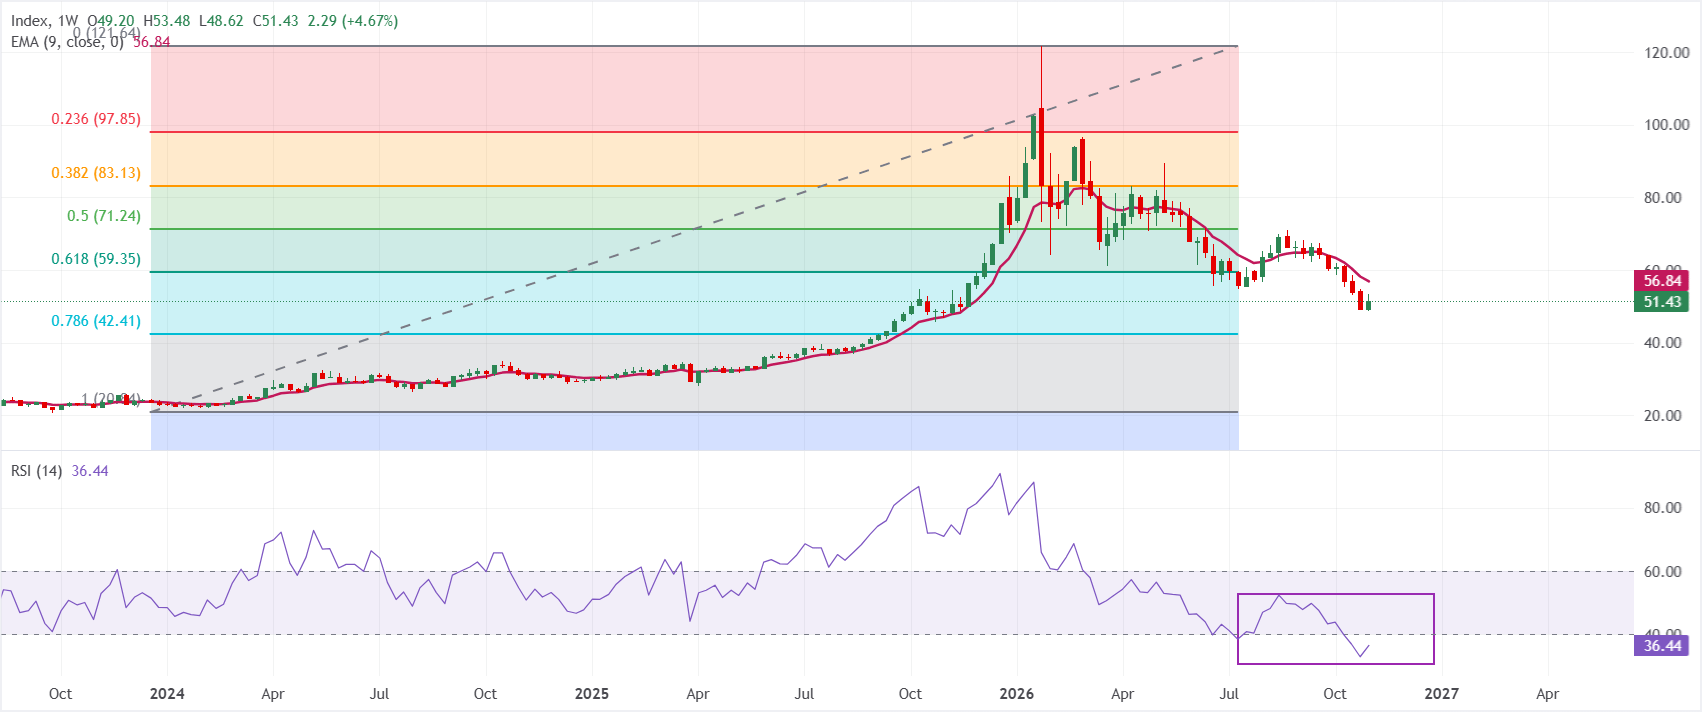
At $51.45 on the weekly chart, XAG/USD retains a bearish near-term bias. The price remains below the 9-week Exponential Moving Average (EMA) of $56.85 and substantially beneath the 61.8% Fibonacci retracement at $59.35. A Relative Strength Index (14) reading of 36.47 places it just above oversold territory. This suggests some easing in downward momentum, although sellers remain in control following the extended retreat from the cycle highs.
The first upside hurdle is the 9-week EMA near $56.85, ahead of the 61.8% retracement at $59.35. A stronger recovery would bring further resistance into focus at the 50% retracement near $71.24 and the 38.2% level of $83.13. Below current prices, the first significant support lies at the 78.6% Fibonacci retracement of $42.41. Beyond that sits the structural low near $20.84, marking the 100% retracement of the broader decline.
(The technical analysis of this story was written with the help of an AI tool. Know more.)
Silver: Key Questions Answered
Historically a store of value and a means of exchange, Silver remains a heavily traded precious metal. Gold attracts greater interest, but traders may choose Silver for portfolio diversification, its intrinsic value or its potential to hedge against high inflation. Investors can hold the physical metal as coins or bars. Alternatively, they can gain exposure through instruments such as Exchange Traded Funds that track Silver’s international market price.
A broad range of influences can drive Silver prices. Its safe-haven characteristics mean geopolitical instability or concerns over a severe recession can lift prices, though typically less than Gold. Lower interest rates also tend to benefit Silver because it pays no yield. As Silver is priced in US dollars (XAG/USD), movements in the US Dollar (USD) matter: a stronger Dollar generally restrains prices, while a weaker one is likely to lift them. Investment demand, mine supply and recycling rates are further influences. Silver is far more abundant than Gold.
Among metals, Silver has one of the highest levels of electrical conductivity, exceeding both Copper and Gold. This supports widespread industrial use, notably in electronics and solar energy. Rising demand can push prices higher, whereas falling demand generally weighs on them. Economic conditions in the US, China and India can also drive price fluctuations. Large industrial sectors in the US and, especially, China use Silver across a range of processes. In India, consumer demand for Silver jewellery is another important price determinant.
With both metals sharing safe-haven characteristics, Silver generally tracks Gold and typically rises when Gold advances. Their relative valuations can be assessed using the Gold/Silver ratio: the number of ounces of Silver equivalent in value to one ounce of Gold. A high reading may be interpreted by some investors as Silver being undervalued or Gold being overvalued. A low reading, by contrast, may indicate that Gold is undervalued compared with Silver.
POPULAR ARTICLES
1US Dollar Index Price Forecast: Safe-haven bid helps recovery above 20-day EMA ahead of US NFP2Upbeat German factory data leaves Euro rangebound against British Pound3Czech Koruna: ING Expects Rangebound Trading Against Euro4Below 158.00: USD/JPY Price Forecast as traders appear hesitant ahead of US NFP5Austria Wholesale Prices n.s.a (MoM) fell from previous 1.9% to -0.2% in October6Austria Wholesale Prices n.s.a (YoY) fell from previous 10.2% to 10% in October7Switzerland Foreign Currency Reserves above forecasts (0B) in October: Actual (759B)8157.00–159.00 band: Bullish bias for Japanese Yen against US Dollar – UOB9Forex Today: Critical employment data loom as US Dollar recovery gains momentum

Get Started!
Sign up and access the Global Markets in less than 3 minutes

Connect With Us









Contacts
Phone: +61 2 8036 8388
Fax: +61 2 8036 8388
Email: support@tmgm.com



The information provided on this website is of a general nature only and does not constitute personal financial advice. Before acting on any information on this website, you should consider the suitability of the information in relation to your objectives, financial situation and needs. Investing in CFDs and FX Margin Contracts carries significant risks and is not suitable for all investors. You may lose more than your initial deposit. You do not own, or have, any interest in the underlying asset. We recommend that you seek independent advice and ensure you fully understand the risks involved before trading. It is important that you read and consider the disclosure document before you acquire any product listed on the website. The information and advertisements offered on this website are not intended for use by any person in any country or jurisdiction where such use would be contrary to local laws and regulations. The Products and Services offered on this website are not intended for residents of the United States, Malaysia and Thailand.
TMGM is authorized and regulated in various jurisdictions.
Trademax Australia Limited, trading as TMGM, is regulated by the Australian Securities and Investments Commission (ASIC), AFSL no. 436416 and is located at Level 28, One International Tower, 100 Barangaroo Avenue, 2000 Sydney, NSW Australia.
Email: support@tmgm.com.au
Trademax Global Limited, trading as TMGM, is authorized and regulated by the Vanuatu Financial Services Commission (VFSC), registration number 40356 and registered at 1276, Kumul Highway, Port Vila, Vanuatu, Republic of Vanuatu.
Email: support@tmgm.com
Trademax Global Markets (SE) Limited, trading as TMGM, is authorized and regulated by the Financial Services Authority (FSA) of Seychelles, with license number SD224. The company is registered at Office No 13, Providence Estate ABIS Centre, Mahe, Seychelles.
Email: support@tmgm.com
Trademax Global Markets (International) Pty Ltd, trading as TMGM, is authorized and regulated by the Financial Services Commission, Mauritius (FSC) with license no. GB22201012, and registered at 33, Edith Cavell Street C/o IQ EQ Fund Services (Mauritius) Ltd Port Louis, 11324 Mauritius.
Email: support@tmgm.com
Copyright © TMGM. All rights reserved