




Shiba Inu Price Forecast: SHIB extends sell-off despite surging futures Open Interest
- Shiba Inu sustains a dominant sell-off, trading at $0.00000450 while key moving averages limit recovery potential.
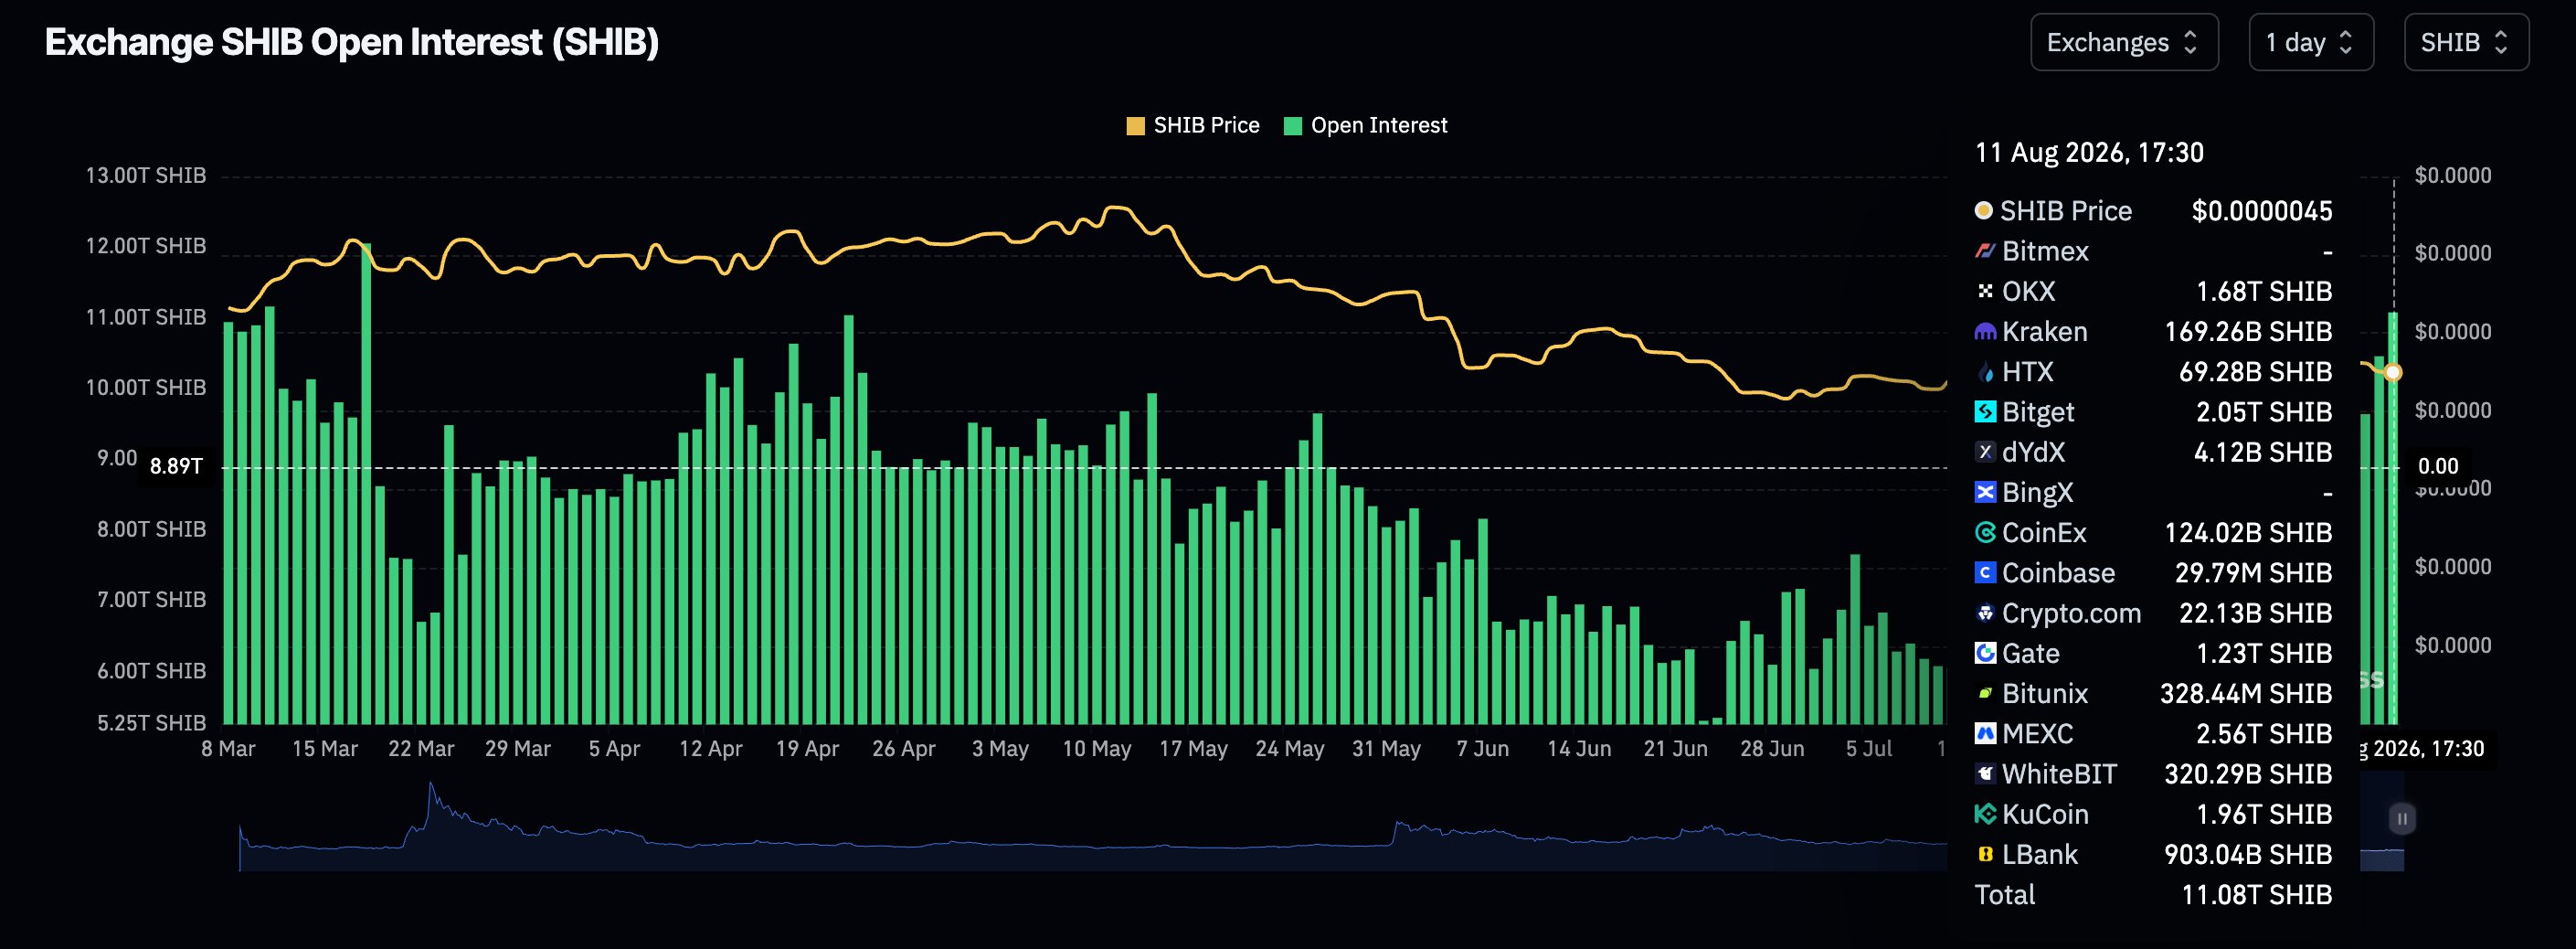
- Retail investors make a notable comeback, with futures Open Interest climbing to 11.08 trillion SHIB.
- SHIB faces a weak technical structure, defined by a bearish RSI and downtrending moving averages.
Shiba Inu (SHIB) maintains a bearish outlook on Tuesday, as it edges lower at $0.00000450. This marks the seventh day the meme coin has sustained a sell-off, weighed down by a weak technical structure.

Shiba Inu attracts retail investors
Shiba Inu derivatives continue to gain momentum, with perpetual futures Open Interest (OI) rising to 11.08 trillion SHIB on Tuesday, from 10.46 trillion the day before. Looking back, retail demand has continued to gain momentum, now standing at nearly twice the July low of 6.05 trillion SHIB.
This surge highlights sustained retail interest in SHIB derivatives, even as the broader market correction persists. In August, Shiba Inu has declined by about 14% from $0.00000583 and currently trades nearly 34% below its June peak of $0.00000671.
Shiba Inu retains positive funding rates
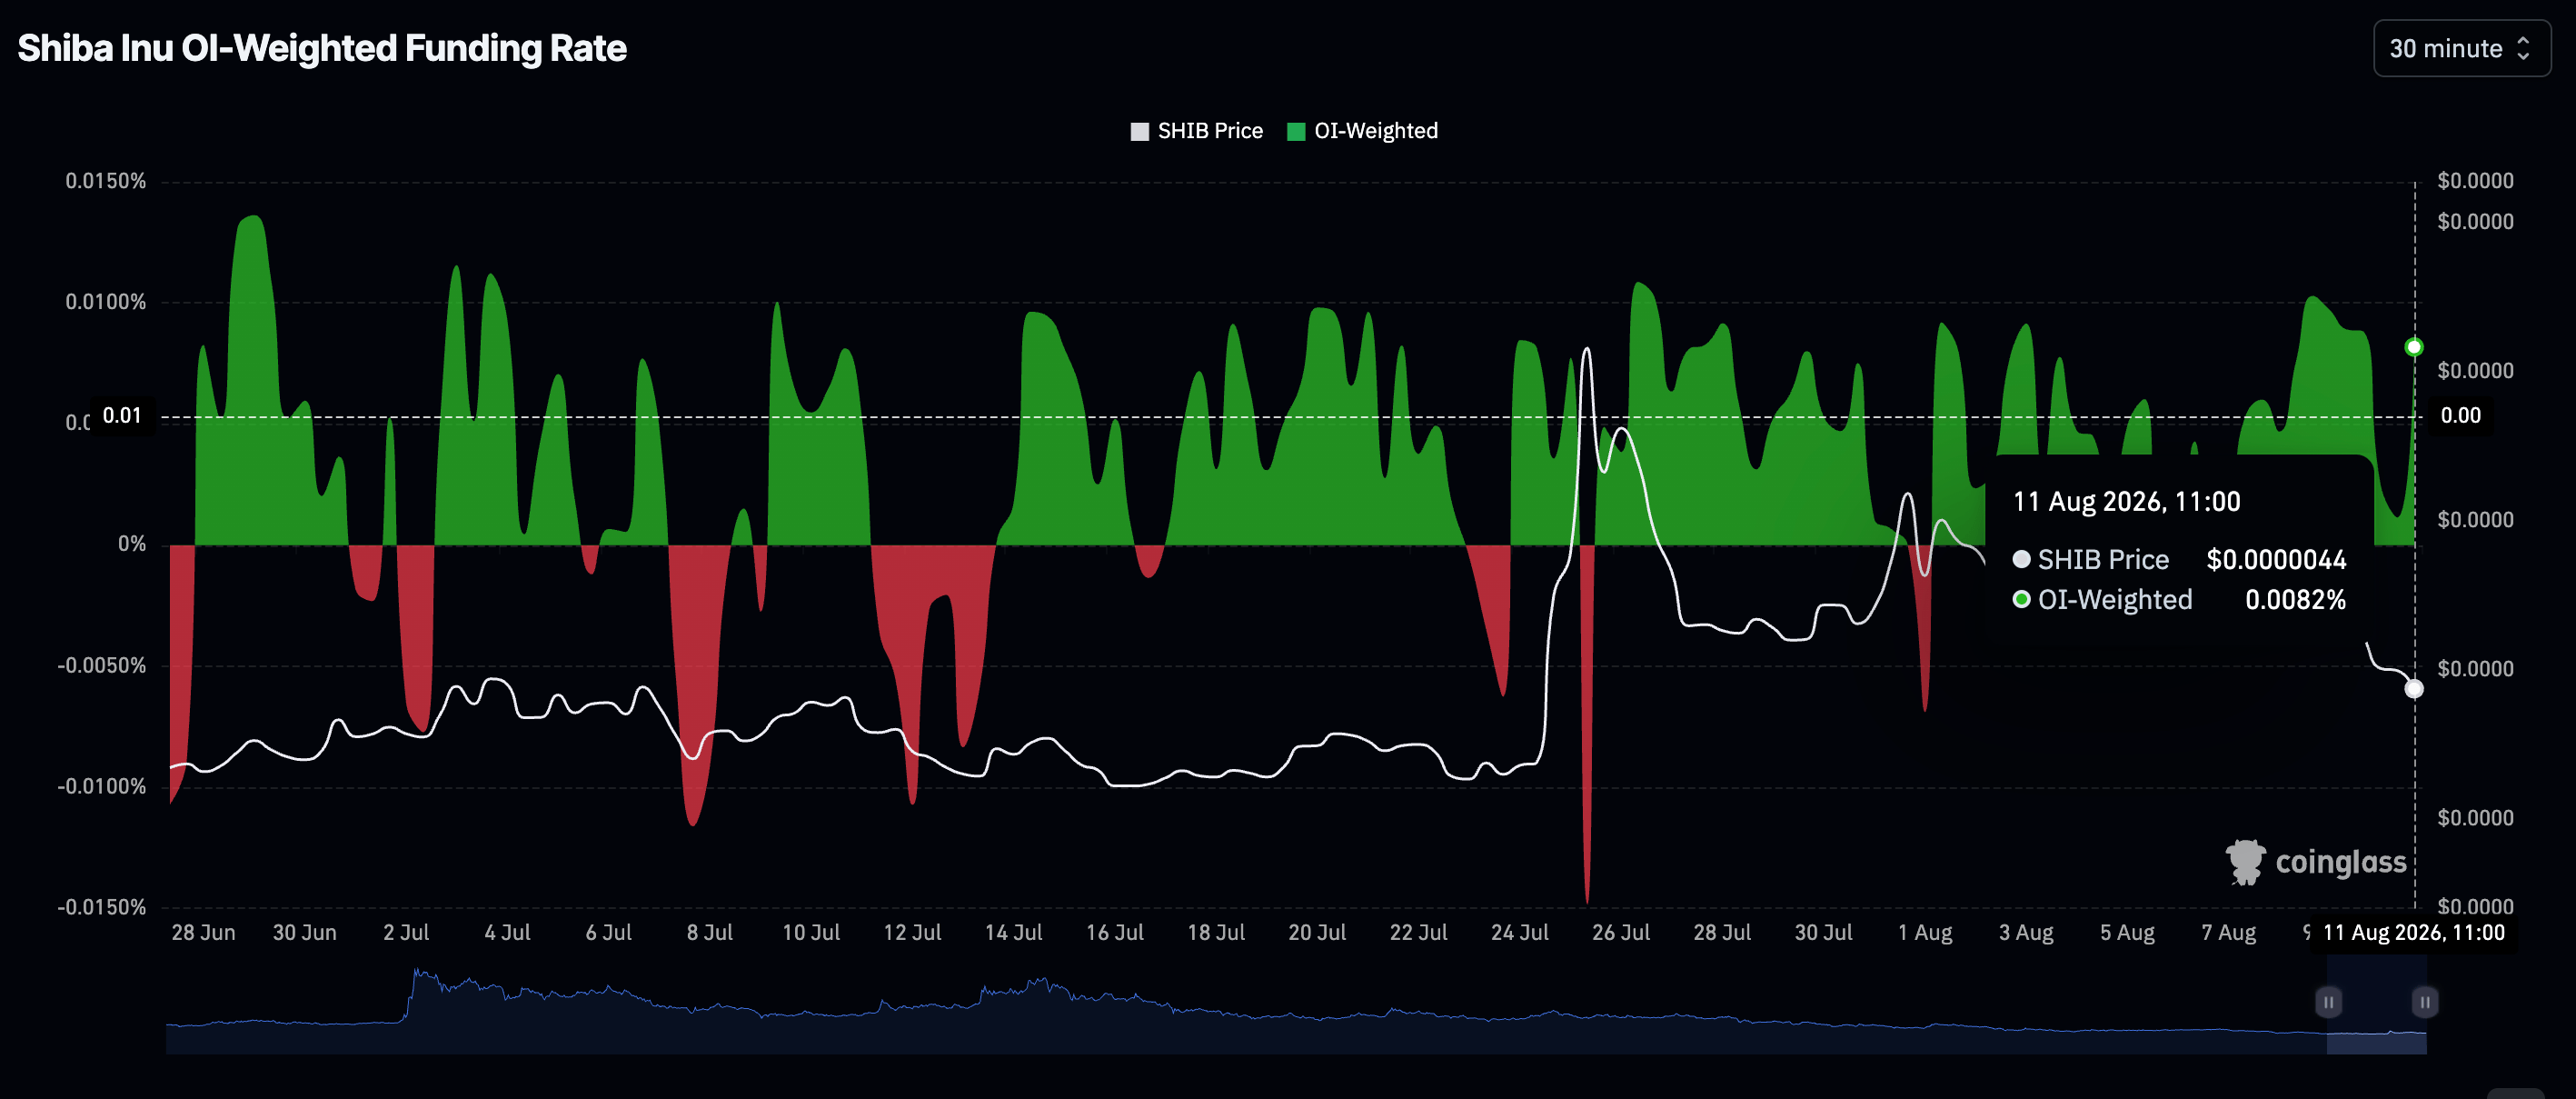
Retail investors are increasing risk exposure, as reflected in the OI-Weighted Funding Rate. According to CoinGlass, the metric holds at 0.0082% in the positive region on Tuesday, up from 0.0025% the day before. If sustained, Shiba Inu derivatives could help absorb the broader selling pressure, raising the odds of an extended recovery.
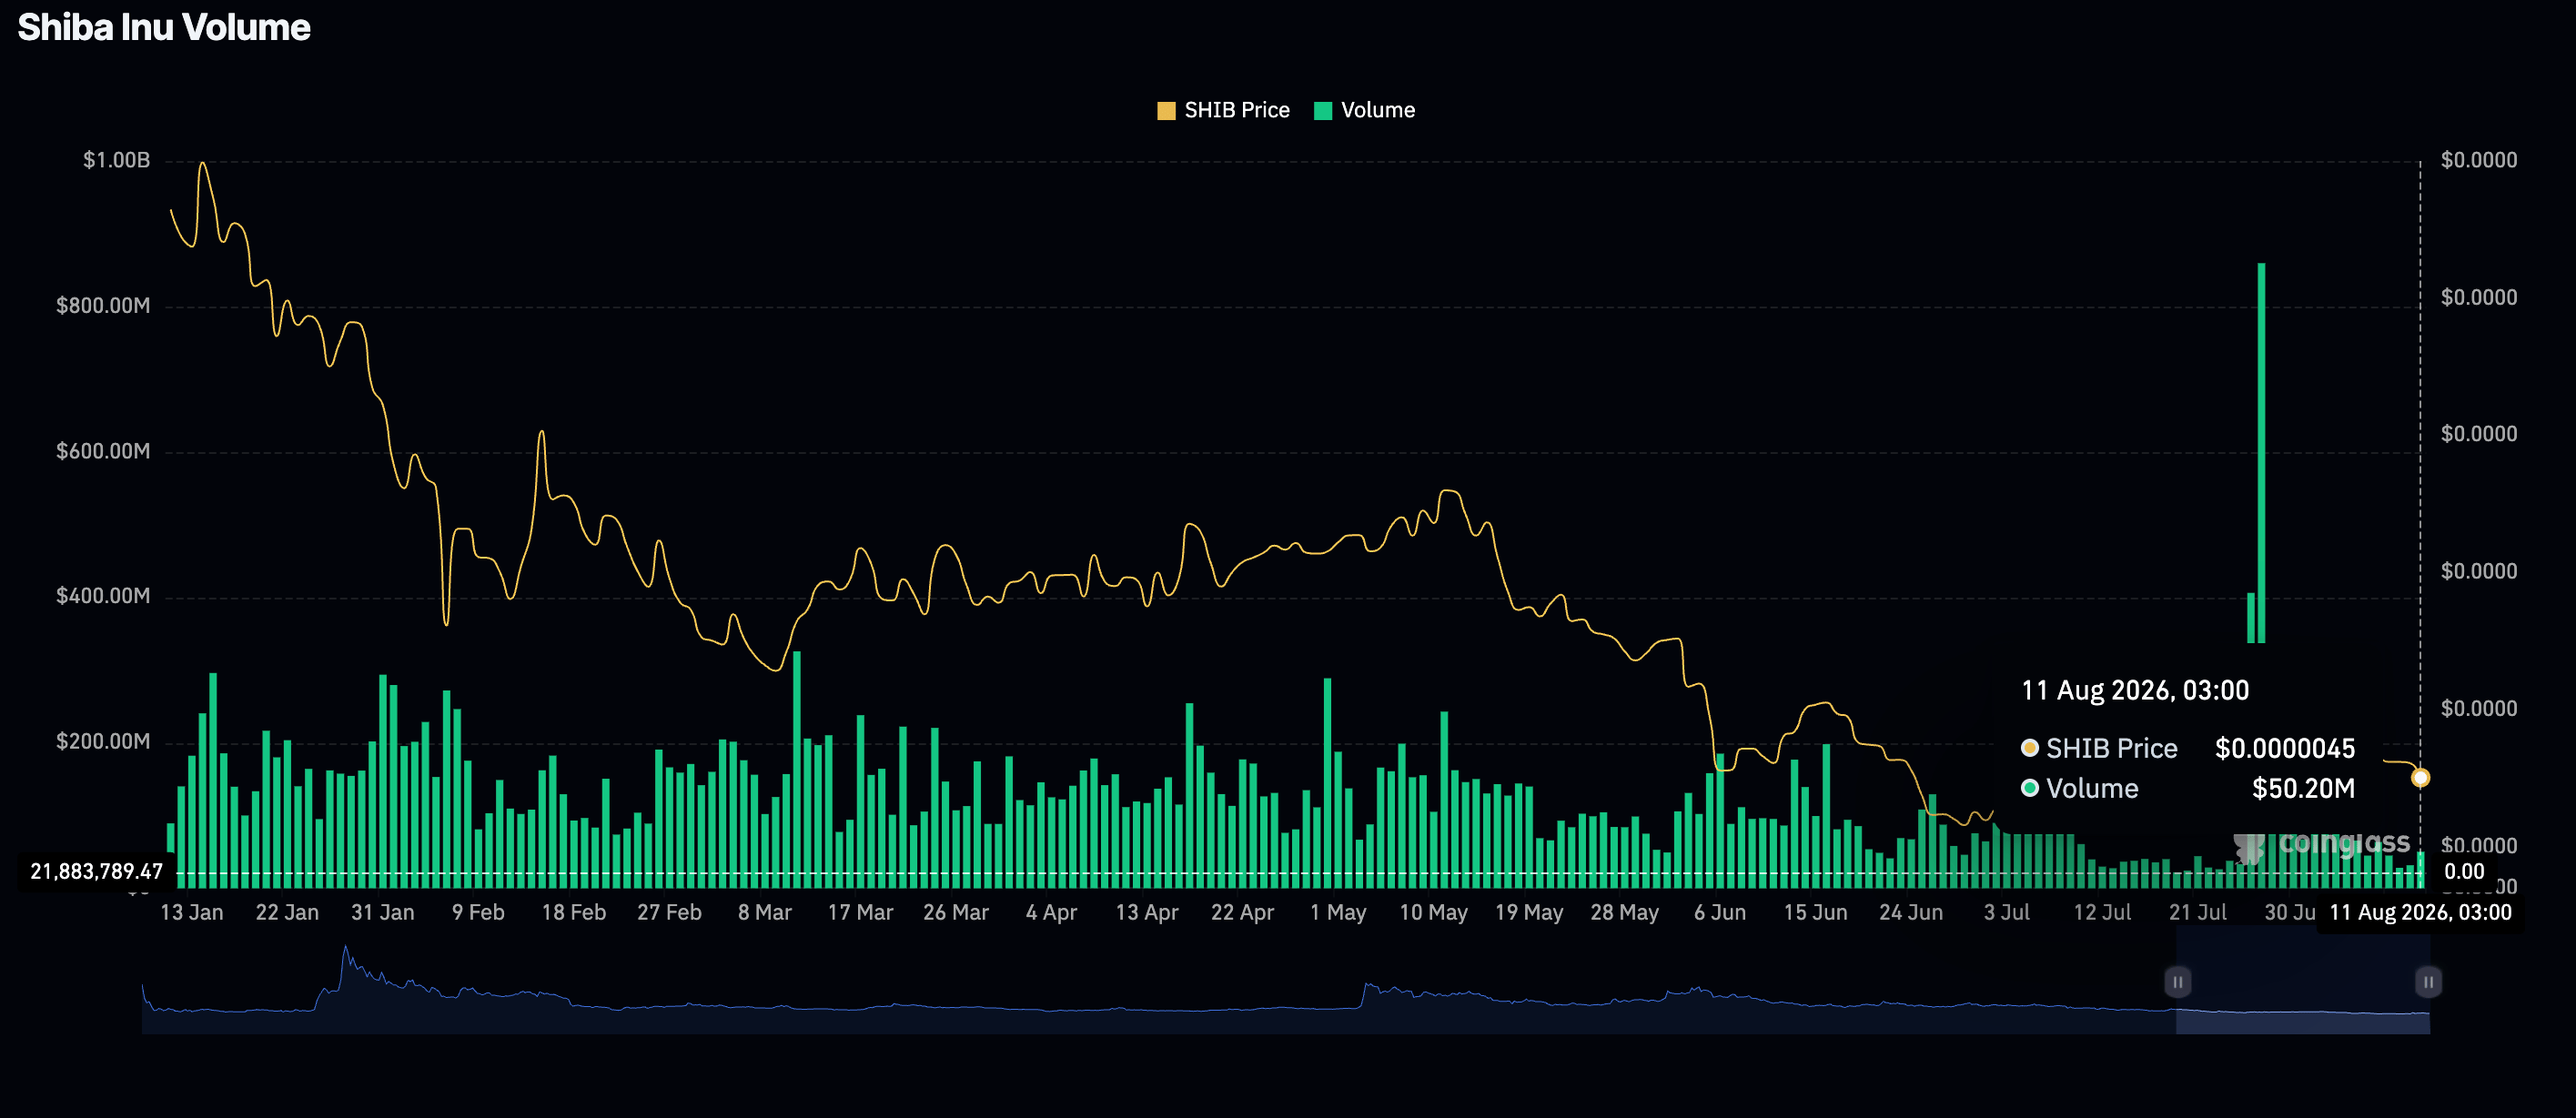
However, trading volume remains significantly low at $50.2 million on Tuesday despite a marginal increase from $31.7 million the previous day. This is against the backdrop of a notable surge in volume to $859.5 million on July 27, the highest level on record since June 2025.
Technical analysis: Shiba Inu downtrend deepens
Shiba Inu maintains a strong bearish bias, trading at $0.00000450. The meme coin holds below key descending moving averages, including the 50-day Exponential Moving Average (EMA), the 100-day and the 200-day EMAs.
Momentum remains weak, underpinned by a declining Relative Strength Index (RSI) at 45 on the daily chart. A continued drop in the RSI will bring Shiba Inu closer to oversold conditions, which may prompt a recovery if the next major support at $0.00000405 holds.
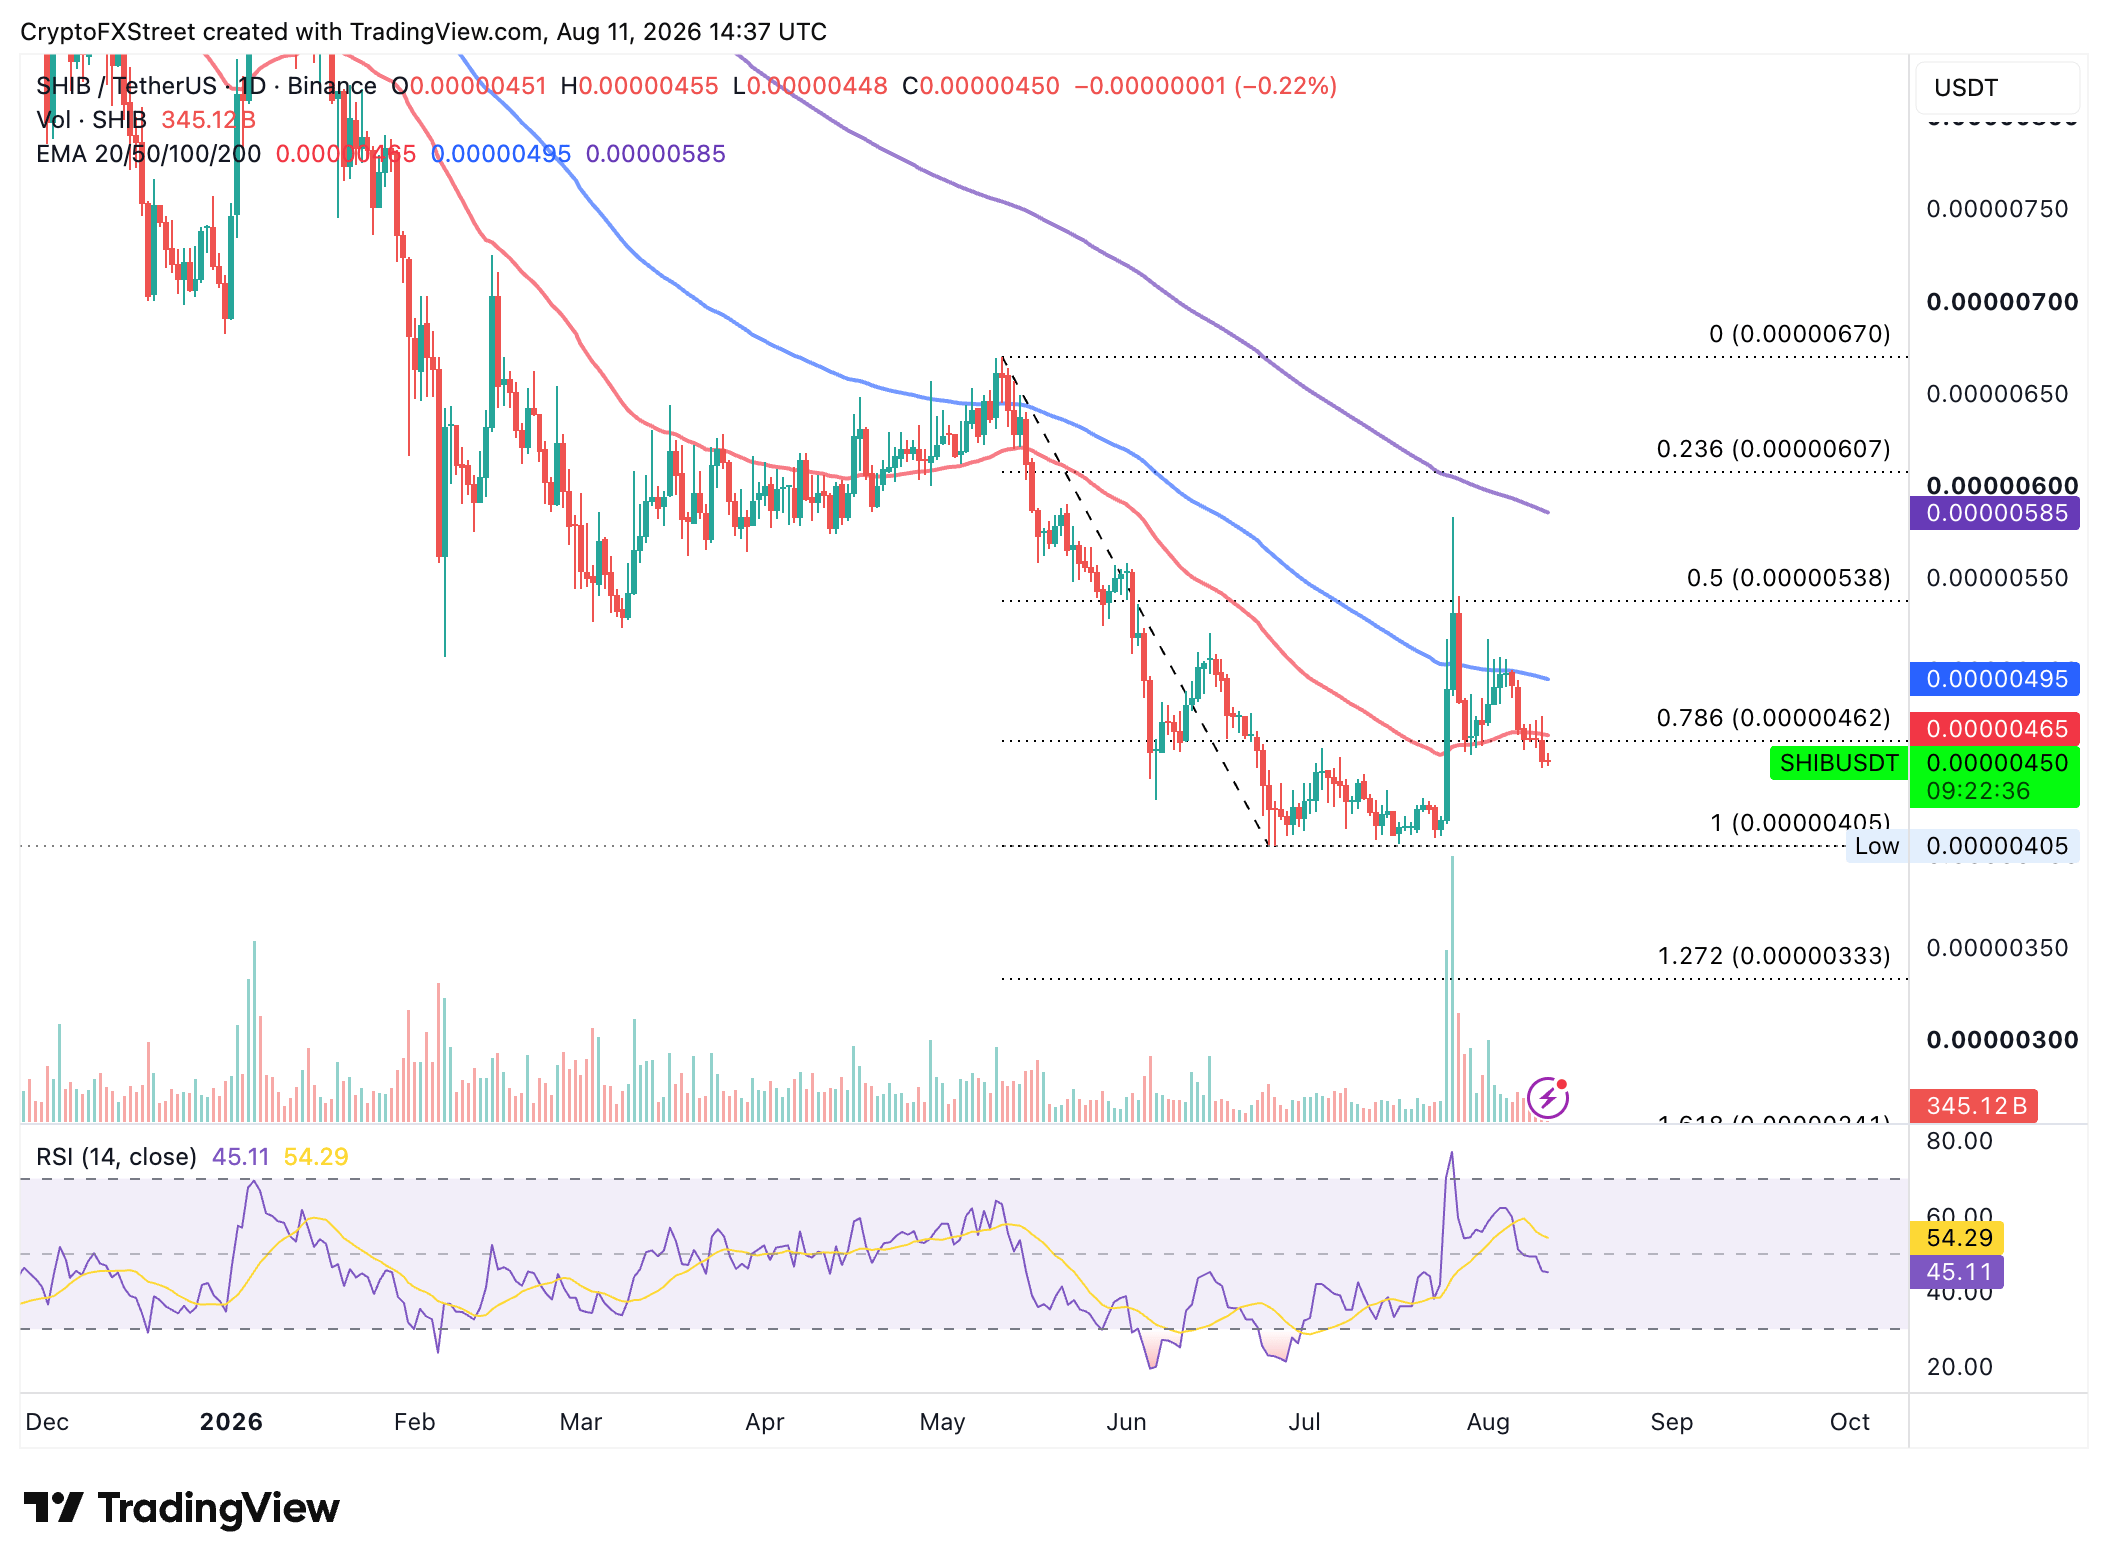
The 78.6% Fibonacci retracement at $0.00000462 highlights the immediate resistance, followed by the 50-day EMA at $0.00000465 and the 100-day EMA at $0.00000495. On the downside, the current pivot level at $0.00000450 offers immediate support, followed by 100% Fibonacci at $0.00000450.
Cryptocurrency prices FAQs
Token launches influence demand and adoption among market participants. Listings on crypto exchanges deepen the liquidity for an asset and add new participants to an asset’s network. This is typically bullish for a digital asset.
A hack is an event in which an attacker captures a large volume of the asset from a DeFi bridge or hot wallet of an exchange or any other crypto platform via exploits, bugs or other methods. The exploiter then transfers these tokens out of the exchange platforms to ultimately sell or swap the assets for other cryptocurrencies or stablecoins. Such events often involve an en masse panic triggering a sell-off in the affected assets.
Macroeconomic events like the US Federal Reserve’s decision on interest rates influence crypto assets mainly through the direct impact they have on the US Dollar. An increase in interest rate typically negatively influences Bitcoin and altcoin prices, and vice versa. If the US Dollar index declines, risk assets and associated leverage for trading gets cheaper, in turn driving crypto prices higher.
Halvings are typically considered bullish events as they slash the block reward in half for miners, constricting the supply of the asset. At consistent demand if the supply reduces, the asset’s price climbs.













