

Chainlink Price Forecast: LINK bulls gain control as on-chain activity rises, ETF inflows return
- Chainlink price extends gains on Thursday after closing above a key resistance zone the previous day.
- US-listed spot ETFs recorded an inflow of roughly $500,000 on Wednesday after no significant moves for nearly two weeks.
- LINK daily active addresses, trading volume and network growth are rising steadily.
Chainlink (LINK) price edges up to around $10 after surging nearly 10% so far this week and closing above key resistance levels. Institutional demand recovers, with spot Exchange Traded Funds (ETFs) recording inflows of over $500K on Wednesday after remaining quiet for two weeks. Strengthening on-chain data also supports this rally, hinting at further upside in LINK.

Institutional demand shows signs of optimism
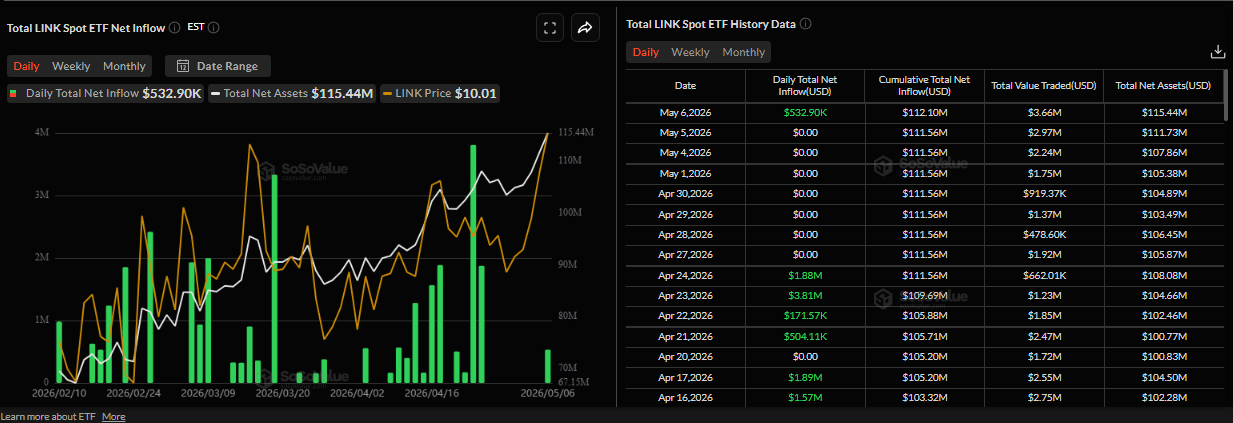
SoSoValue data shows that spot LINK ETFs recorded an inflow of $532,900 on Wednesday, after remaining silent for nearly two weeks. If this inflow trend continues and intensifies this week, LINK could see a price surge.
On Tuesday, global asset managers State Street Investment Management and Galaxy Asset Management announced the launch of the State Street Galaxy Onchain Liquidity Sweep Fund (SWEEP), a tokenized liquidity fund powered by Chainlink.
SWEEP leverages Chainlink’s NAVLink to deliver onchain Net Asset Value (NAV) data and its Cross-Chain Interoperability Protocol (CCIP) enables seamless cross-chain connectivity, highlighting growing institutional adoption of blockchain infrastructure.
On-chain activity supports bullish bias
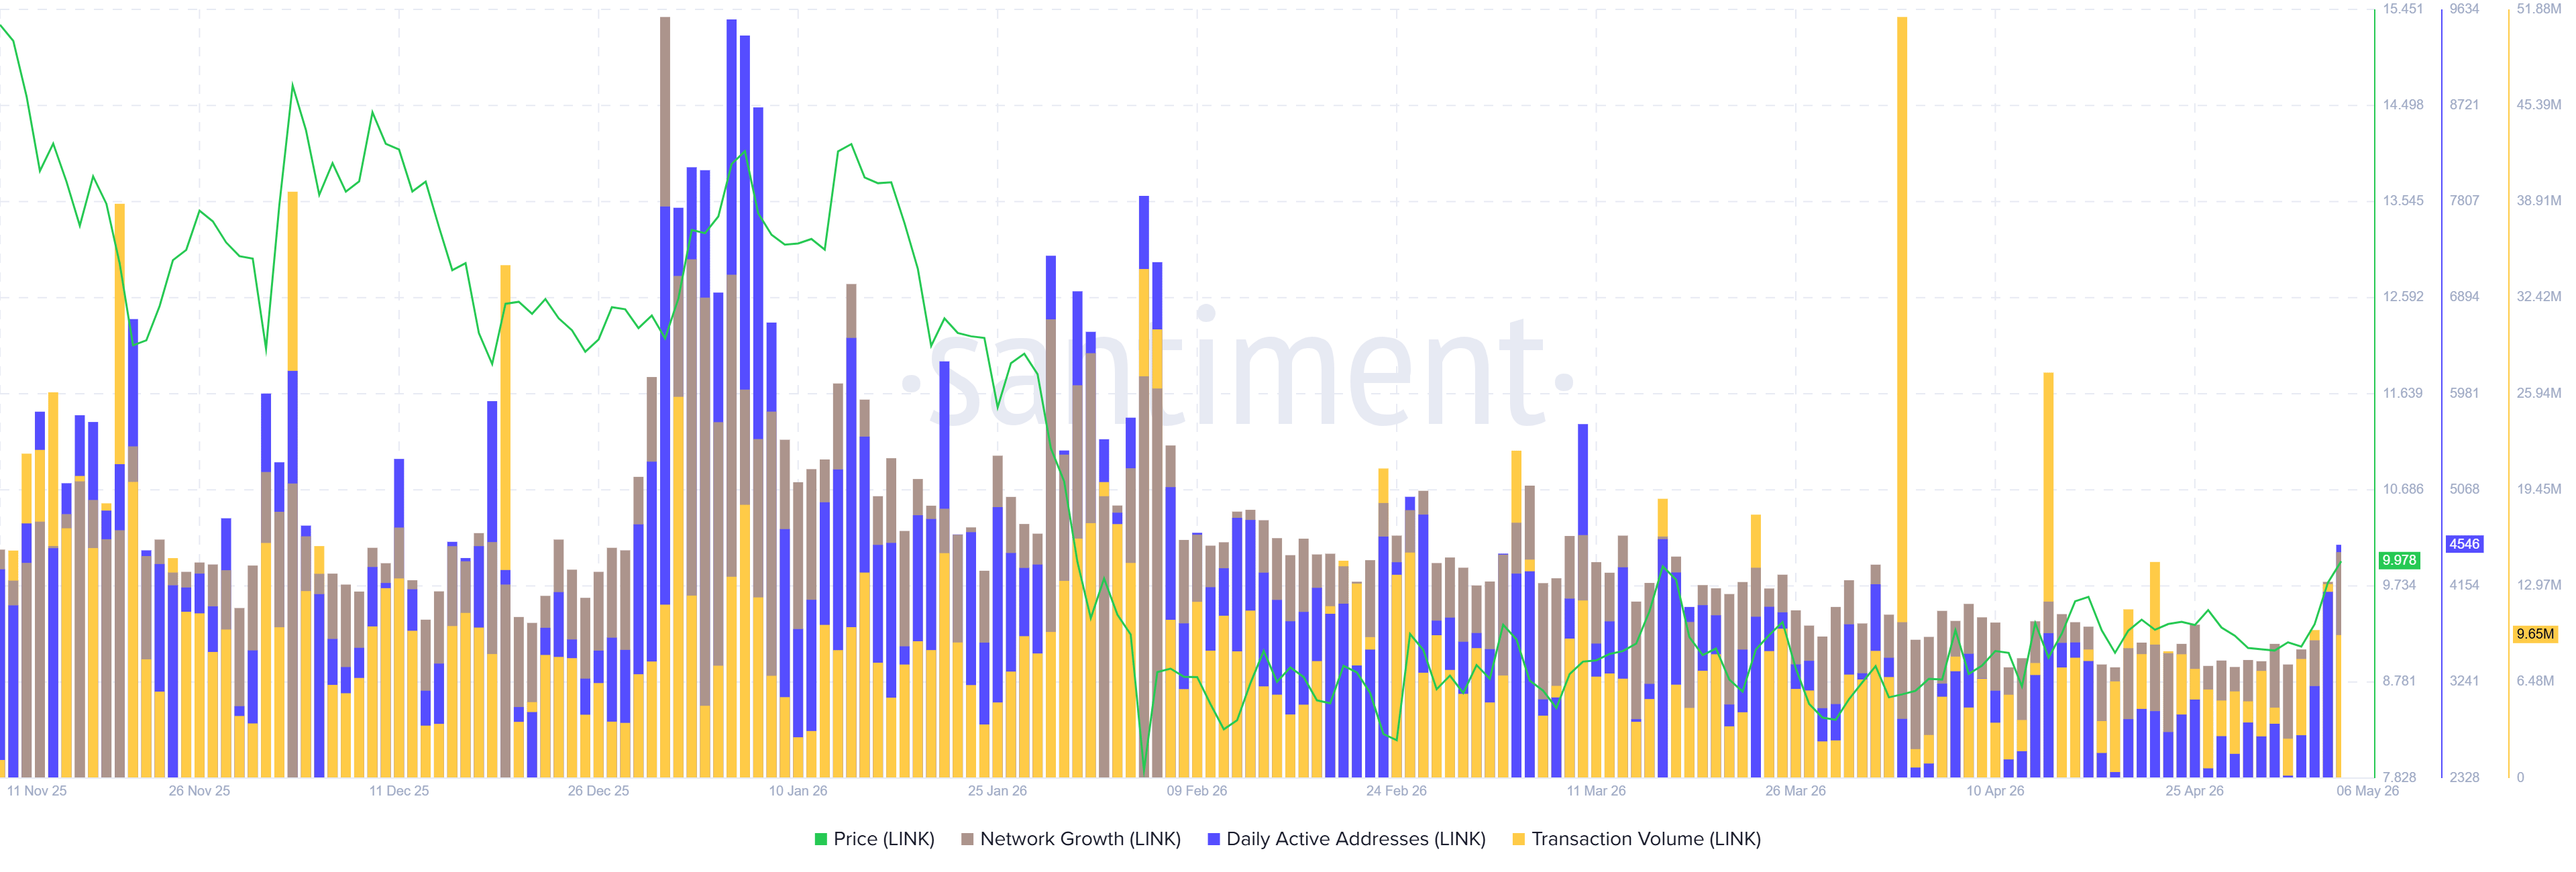
Chainlink’s active daily addresses (blue), transaction volume (yellow) and network growth (brown) have been rising steadily since early May, data from Santiment shows. This surge in key indicators highlights rising user activity and stronger network participation, reinforcing a bullish outlook for LINK’s price.
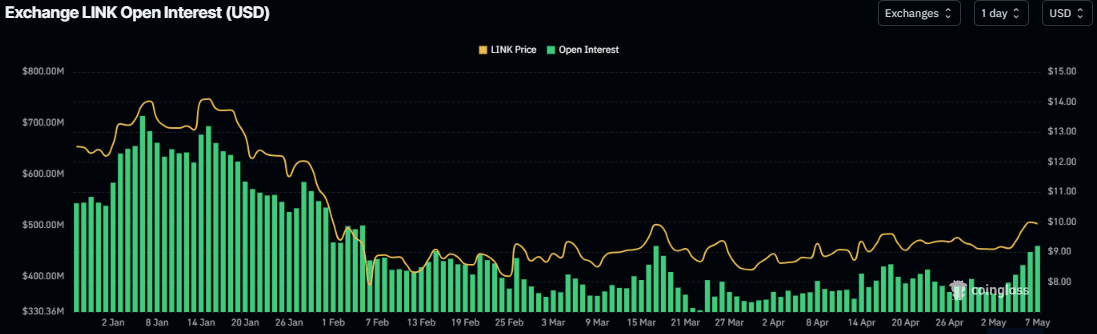
The derivatives side also supports a positive bias. CoinGlass data shows that futures’ Open Interest (OI) at exchanges in LINK surges to $495.74 million on Thursday from $366 million on Sunday. An increasing OI indicates new or additional money entering the market and new buying, which could fuel a rally in LINK’s price.
Chainlink Price Forecast: LINK closes above key resistance zone
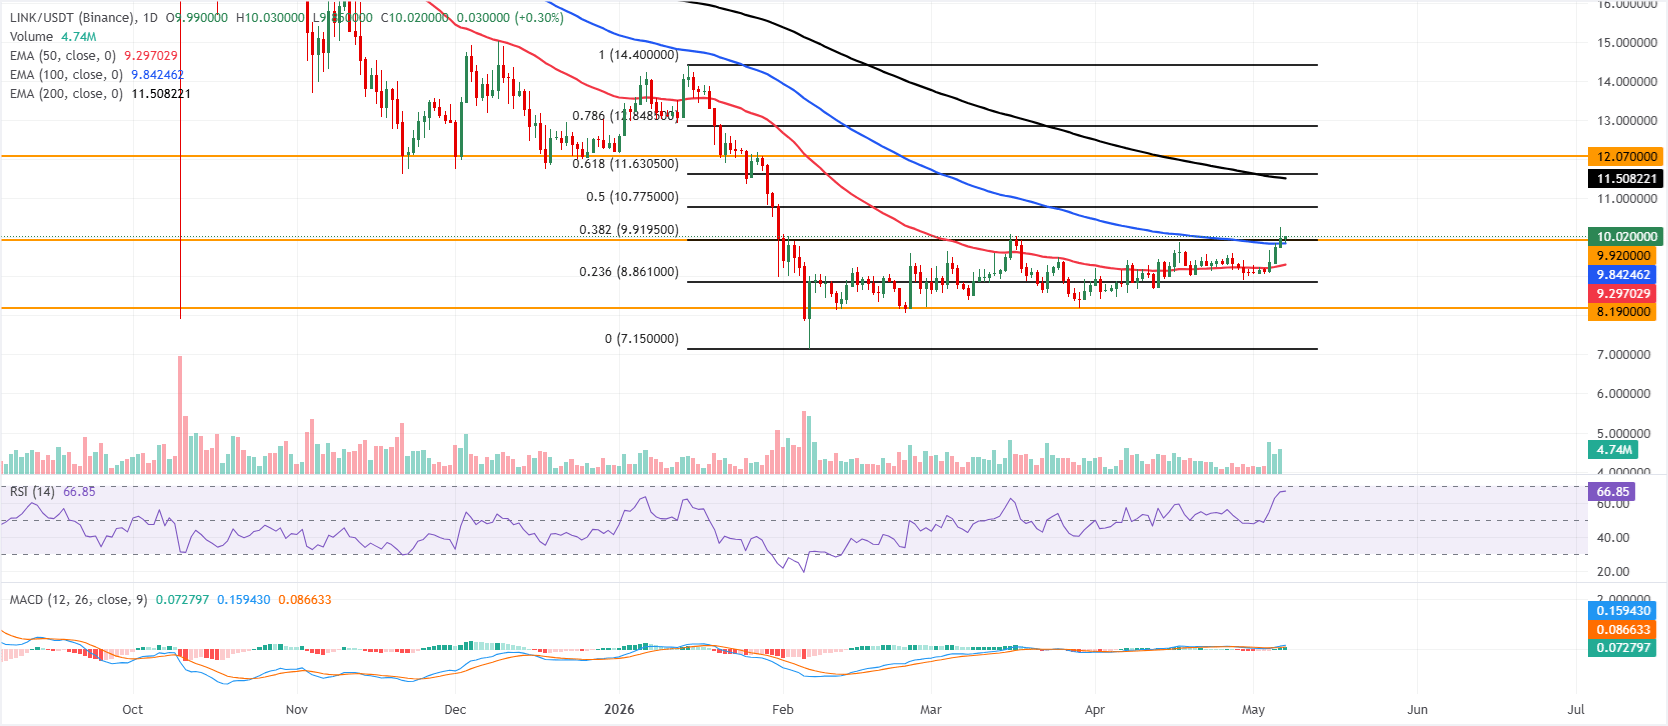
Chainlink price trades at around $10.10 on Thursday, holding a neutral-to-bullish near-term tone. Price has reclaimed the 50-day and 100-day Exponential Moving Averages (EMAs) at $9.29 and $9.84, respectively, while still trading well beneath the 200-day EMA at $11.50, which caps the broader trend.
The Relative Strength Index (RSI) on the daily chart hovers near 66, pointing toward the overbought territory. The Moving Average Convergence Divergence (MACD) on the same chart remains in positive territory, with its line above the signal and a growing positive histogram, suggesting that upside momentum is building but running into medium-term overhead supply.
On the topside, initial resistance is located at the 50% retracement (drawn from January high to the February low) at $10.77, ahead of a heavier band of supply defined by the 200-day EMA at $11.50 and the 61.8% Fibonacci retracement at $11.63, with a stronger cap emerging near the horizontal barrier at $12.07 and the 78.6% Fibonacci level at $12.85.
On the downside, immediate support is seen around the $9.92 area, which aligns with an horizontal floor and the 38.2% Fibonacci retracement, followed by the 100-day EMA at $9.84. A deeper pullback would expose the 50-day EMA at $9.29 and then the 23.6% Fibonacci retracement at $8.86 before the more distant horizontal base at $8.19.
(The technical analysis of this story was written with the help of an AI tool.)













