

การเทรด
สำรวจตลาดที่หลากหลายด้วยราคาที่แข่งขันได้ สภาพคล่องสูง และเครื่องมือการเทรดขั้นสูง
เรียนรู้เพิ่มเติม 
แพลตฟอร์ม
เทรดอย่างไร้รอยต่อกับแพลตฟอร์มอันทรงพลังของ TMGM ที่สร้างขึ้นเพื่อความรวดเร็ว แม่นยำ และประสบการณ์การเทรดที่เหนือกว่า
เรียนรู้เพิ่มเติม แพลตฟอร์มการเทรด
เครื่องมือการเทรด
สถาบัน
เรียนรู้พื้นฐานการเทรดด้วยแหล่งข้อมูลสำหรับผู้เริ่มต้น รวมถึงคู่มือ สัมมนาออนไลน์ และข้อมูลเชิงลึกตลาด
เรียนรู้เพิ่มเติม ข่าว & วิเคราะห์
รับข้อมูลอัปเดตตลาดแบบเรียลไทม์และบทวิเคราะห์จากผู้เชี่ยวชาญเพื่อคว้าโอกาสการเทรดก่อนใคร
เรียนรู้เพิ่มเติม ข่าว & วิเคราะห์
เกี่ยวกับ
เรียนรู้สิ่งที่ทำให้ TMGM โดดเด่น — การดำเนินงานทั่วโลก ความแข็งแกร่งด้านการกำกับดูแล และความมุ่งมั่นสู่การสร้างสรรค์นวัตกรรมในการเทรด
เรียนรู้เพิ่มเติม ทำไมต้องเลือก TMGM
Dogecoin Price Forecast: DOGE stuck in bearish trend after new lows
- Dogecoin remains under pressure on Wednesday, after hitting a new yearly low of $0.055 last week.
- Weakening derivatives metrics and bearish on-chain data cap DOGE’s recovery.
- The technical outlook shows bearish momentum remains dominant, despite the risk of short‑term corrective bounces.
Dogecoin (DOGE) remains under pressure, trading around $0.059 on Wednesday, struggling to recover from last week’s sharp sell-off that pushed the meme coin to a new yearly low of $0.055. Weakening derivatives activity and bearish on-chain metrics continue to weigh on market sentiment. In addition, technical indicators suggest sellers remain firmly in control, leaving DOGE vulnerable to further downside.
Weakening derivatives metrics cap the meme coin
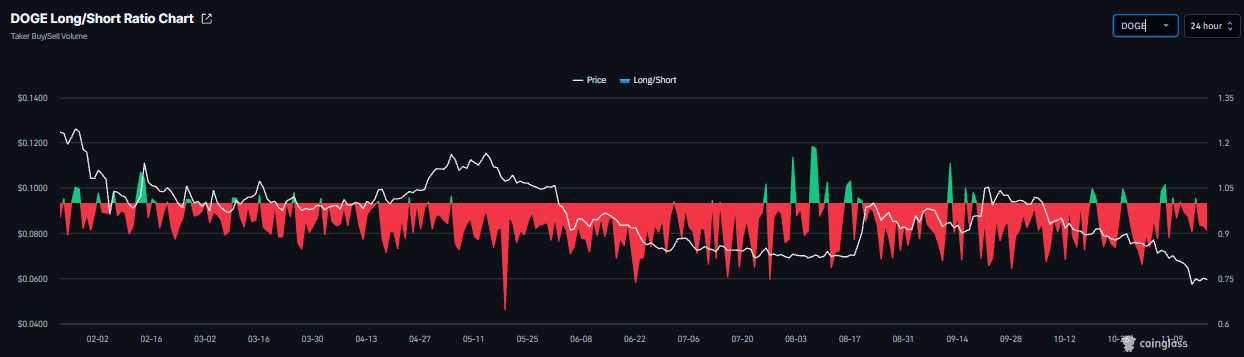
Derivatives data shows a bearish bias for Dogecoin. CoinGlass’ long-to-short ratio for DOGE reads 0.90 on Wednesday, nearing the lowest level over a month. A ratio below one indicates bearish sentiment, as traders bet that asset prices will fall.
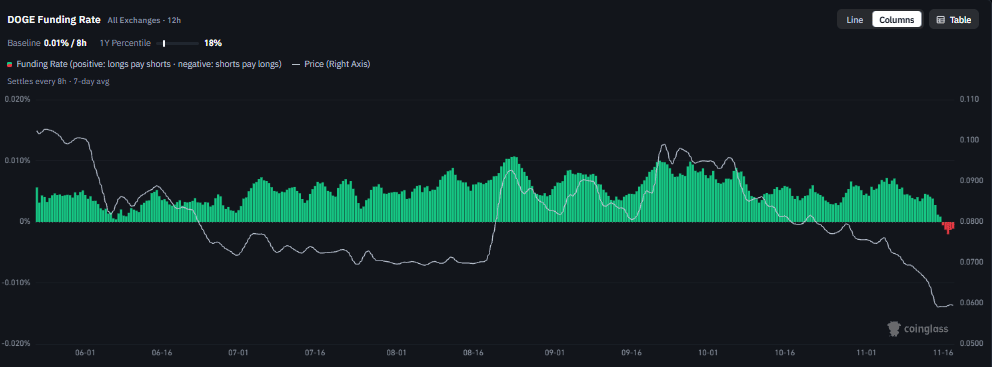
In addition, the meme coin’s funding rate flipped negative on Monday and reads -0.0011% on Wednesday, indicating shorts are paying longs and suggesting a bearish outlook.
On-chain data shows cautious outlook
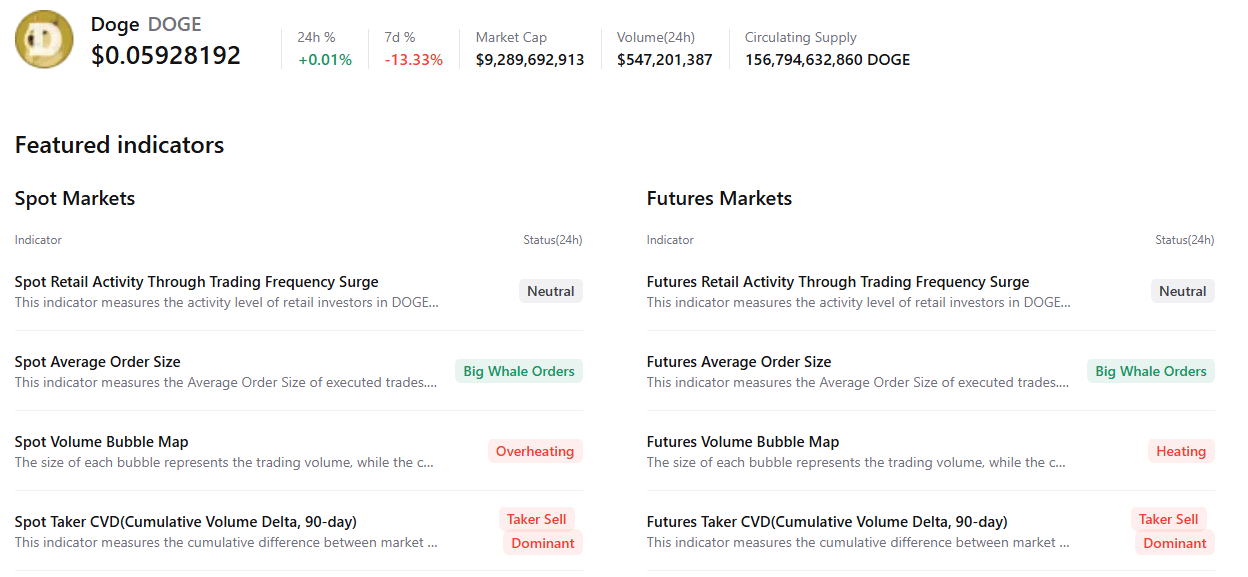
CryptoQuant’s summary data shows a bearish outlook for the dog-themed meme coin. DOGE’s spot and futures markets show large whale orders alongside heating conditions. Both markets also show sell-side dominance. These highlight a bearish, cautious sentiment bias among DOGE meme coin traders.
Dogecoin technical outlook: Bears maintain control despite potential short-term recovery bounces
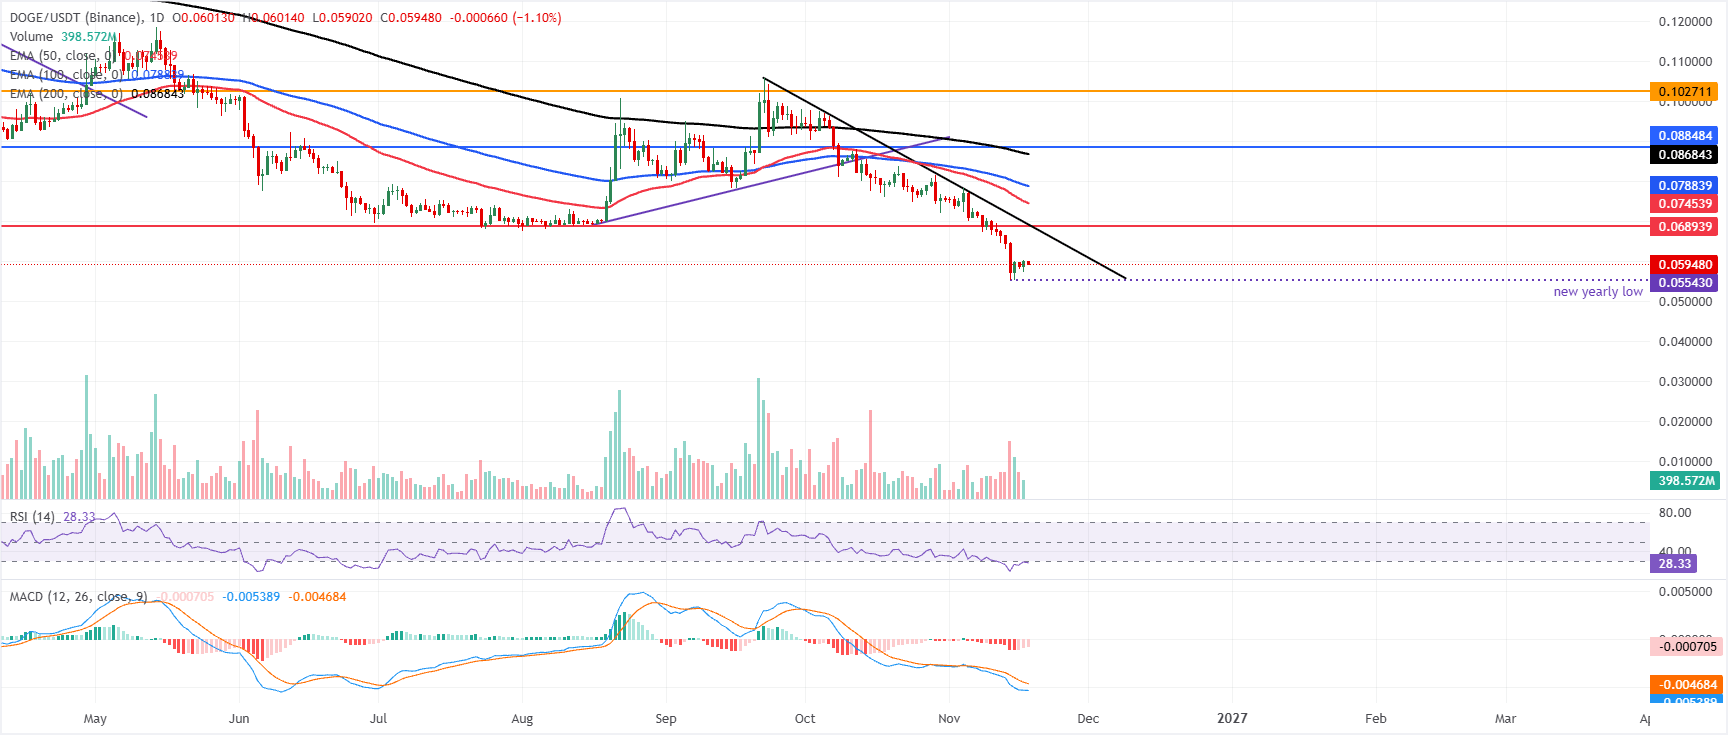
Dogecoin price trades at $0.059 on Wednesday after dropping to a new yearly low of $0.055 last week. DOGE remains entrenched in a bearish near‑term bias, with price holding well below the 50‑day, 100‑day, and 200‑day Exponential Moving Averages (EMAs) at roughly $0.074, $0.078, and $0.086. A series of descending resistance trend lines from prior highs, together with the broken upward support line originating around $0.069, now reinforce overhead supply.
The Relative Strength Index (RSI) at about 28 sits in oversold territory. At the same time, the Moving Average Convergence Divergence (MACD) indicator stays negative, hinting that bearish momentum is still dominant despite the risk of short‑term corrective bounces.
On the topside, initial resistance is seen at the horizontal cap near $0.068, closely aligned with the previously supportive rising trendline around $0.069. Above that, the 50‑day EMA at $0.074 and the 100‑day EMA at $0.078 form a secondary barrier, ahead of denser resistance at the 200‑day EMA around $0.086 and a horizontal level near $0.088. Stronger supply is likely to emerge closer to $0.102, where a horizontal line coincides with the broader descending trend structure. With no clear nearby structural floors below, any fresh lows would leave DOGE vulnerable to further downside extension until new demand emerges.
(The technical analysis of this story was written with the help of an AI tool. Know more.)
บทความยอดนิยม
1ราคาทองคำอินเดียวันนี้: ราคาทองคำปรับตัวลง ตามข้อมูลจาก FXStreet2คาดการณ์ราคา EUR/JPY: ทดสอบแนวรับ 175.00 ใกล้ระดับต่ำสุดของปี3WTI อ่อนตัวลงจากความกังวลอุปทานล้นตลาด แต่ยังยืนเหนือช่วงกลางของระดับ 83.00 ดอลลาร์ ท่ามกลางความกังวลต่อสถานการณ์ตะวันออกกลาง4คาดการณ์ราคา AUD/JPY: อ่อนตัวลงใกล้ 107.00 แนวโน้มเชิงลบยังคงอยู่ขณะราคาอยู่ต่ำกว่าเส้น SMA 100 วัน5คาดการณ์ราคา Pi Network: PI ฟื้นตัวรับความคืบหน้าสำคัญจากงาน Pi Ecosystem Summit6คาดการณ์ราคาโลหะเงิน: XAG/USD ร่วงแตะระดับต่ำสุดในรอบ 13 เดือน ท่ามกลางแนวโน้มที่เฟดจะคงนโยบายการเงินเข้มงวด7ดัชนีดอลลาร์สหรัฐยังไม่สามารถปรับขึ้นต่อเหนือระดับ 103.80 ตลาดจับตารายงานการประชุม FOMC8คาด CPI อังกฤษชี้เงินเฟ้อสูงสุดในรอบ 13 เดือน จากต้นทุนเชื้อเพลิงที่เพิ่มขึ้น9คาดการณ์ราคา 3 คริปโตหลัก: Bitcoin, Ethereum, Ripple – BTC เคลื่อนไหวในกรอบ ขณะที่ ETH และ XRP ชะงัก



เชื่อมต่อกับเรา









ติดต่อเรา
โทร: +61 2 8036 8388
แฟกซ์: +61 2 8036 8388
อีเมล: support@tmgm.com
เว็บไซต์: https://www.tmgmasia.com



ข้อมูลที่ให้ไว้บนเว็บไซต์นี้มีลักษณะเป็นข้อมูลทั่วไปเท่านั้น และไม่ถือเป็นคำแนะนำทางการเงินส่วนบุคคล ก่อนดำเนินการใด ๆ ตามข้อมูลบนเว็บไซต์นี้ คุณควรพิจารณาความเหมาะสมของข้อมูลดังกล่าวให้สอดคล้องกับวัตถุประสงค์ สถานะทางการเงิน และความต้องการของคุณ การลงทุนใน CFD และสัญญา FX Margin มีความเสี่ยงอย่างมีนัยสำคัญ และไม่เหมาะสำหรับนักลงทุนทุกคน คุณอาจสูญเสียเงินมากกว่าเงินฝากเริ่มต้นของคุณ คุณไม่ได้เป็นเจ้าของ หรือมีส่วนได้เสียใด ๆ ในสินทรัพย์อ้างอิง เราแนะนำให้คุณขอคำแนะนำอย่างเป็นอิสระ และตรวจสอบให้แน่ใจว่าคุณเข้าใจความเสี่ยงที่เกี่ยวข้องอย่างถ่องแท้ก่อนทำการซื้อขาย สิ่งสำคัญคือคุณต้องอ่านและพิจารณาเอกสารการเปิดเผยข้อมูลก่อนที่คุณจะได้มาซึ่งผลิตภัณฑ์ใด ๆ ที่ระบุไว้บนเว็บไซต์ ข้อมูลและโฆษณาที่นำเสนอบนเว็บไซต์นี้ไม่ได้มีวัตถุประสงค์เพื่อให้บุคคลใด ๆ ในประเทศหรือเขตอำนาจศาลใด ๆ ใช้งาน หากการใช้งานดังกล่าวขัดต่อกฎหมายและข้อบังคับท้องถิ่น ผลิตภัณฑ์และบริการที่นำเสนอบนเว็บไซต์นี้ไม่ได้มีไว้สำหรับผู้พำนักอาศัยในสหรัฐอเมริกา มาเลเซีย และประเทศไทย
TMGM ได้รับอนุญาตและอยู่ภายใต้การกำกับดูแลในหลายเขตอำนาจศาล
Trademax Australia Limited ซึ่งดำเนินธุรกิจในชื่อ TMGM ได้รับการกำกับดูแลโดย Australian Securities and Investments Commission (ASIC) หมายเลขใบอนุญาต AFSL 436416 และตั้งอยู่ที่ Level 28, One International Tower, 100 Barangaroo Avenue, 2000 Sydney, NSW Australia.
อีเมล: support@tmgm.com.au
Trademax Global Limited ซึ่งดำเนินธุรกิจในชื่อ TMGM ได้รับอนุญาตและอยู่ภายใต้การกำกับดูแลโดย Vanuatu Financial Services Commission (VFSC) หมายเลขทะเบียน 40356 และจดทะเบียนที่ 1276, Kumul Highway, Port Vila, Vanuatu, Republic of Vanuatu.
อีเมล: support@tmgm.com
Trademax Global Markets (SE) Limited, ดำเนินการภายใต้ชื่อ TMGM, ได้รับอนุญาตและอยู่ภายใต้การกำกับดูแลโดย Financial Services Authority (FSA) ของเซเชลส์ ภายใต้เลขที่ใบอนุญาต SD224 บริษัทจดทะเบียนที่ สำนักงานเลขที่ 13, Providence Estate ABIS Centre, เกาะมาเฮ, เซเชลส์
อีเมล: support@tmgm.com
Trademax Global Markets (International) Pty Ltd ซึ่งดำเนินธุรกิจในชื่อ TMGM ได้รับอนุญาตและอยู่ภายใต้การกำกับดูแลโดย Financial Services Commission, Mauritius (FSC) หมายเลขใบอนุญาต GB22201012 และจดทะเบียนที่ 33, Edith Cavell Street C/o IQ EQ Fund Services (Mauritius) Ltd Port Louis, 11324 Mauritius.
อีเมล: support@tmgm.com
ลิขสิทธิ์ © TMGM สงวนลิขสิทธิ์ทั้งหมด