


Doji Candlestick at a Glance
1 A doji has a near flat body, while the wicks show movement and rejection.
2 It shows indecision, but context determines the meaning.
3 Doji types include standard, long legged, dragonfly, gravestone, and four price.
4 A doji is flatter than a spinning top.
5 Confluence comes from the next candle, key levels, volume, RSI, MACD, and trend structure.
6 Context decides whether the signal is bullish, bearish, or neutral.
7 Many doji candles only reflect pause, low liquidity, or noise.
What Is a Doji Candle?
A doji candle is a candlestick pattern used in technical analysis where the opening price and closing price are nearly equal. That creates a very small real body and signals that neither buyers nor sellers finished the session with clear control.
Price may have moved sharply during the session, but the final close returned near the opening level.
That is why the doji matters in price action analysis. It shows a pause in directional conviction, but it does not confirm what happens next on its own.
What Are the Components of a Doji Candlestick?
The main parts of a doji candlestick are the open, close, upper wick, and lower wick. The defining feature is that the open and close are extremely close together.
The real body is either flat or almost invisible. The wicks show how far price traveled above and below the opening level before the session closed.
A long upper wick shows that buyers pushed price higher but failed to hold it. A long lower wick shows that sellers pushed price lower but failed to keep control into the close.
Doji Price Action Analysis Explained
The price action behind Doji reflects that the market reached a temporary balance between buying and selling forces, reflecting market hesitation.
What Are the Main Types of Doji Candlesticks?
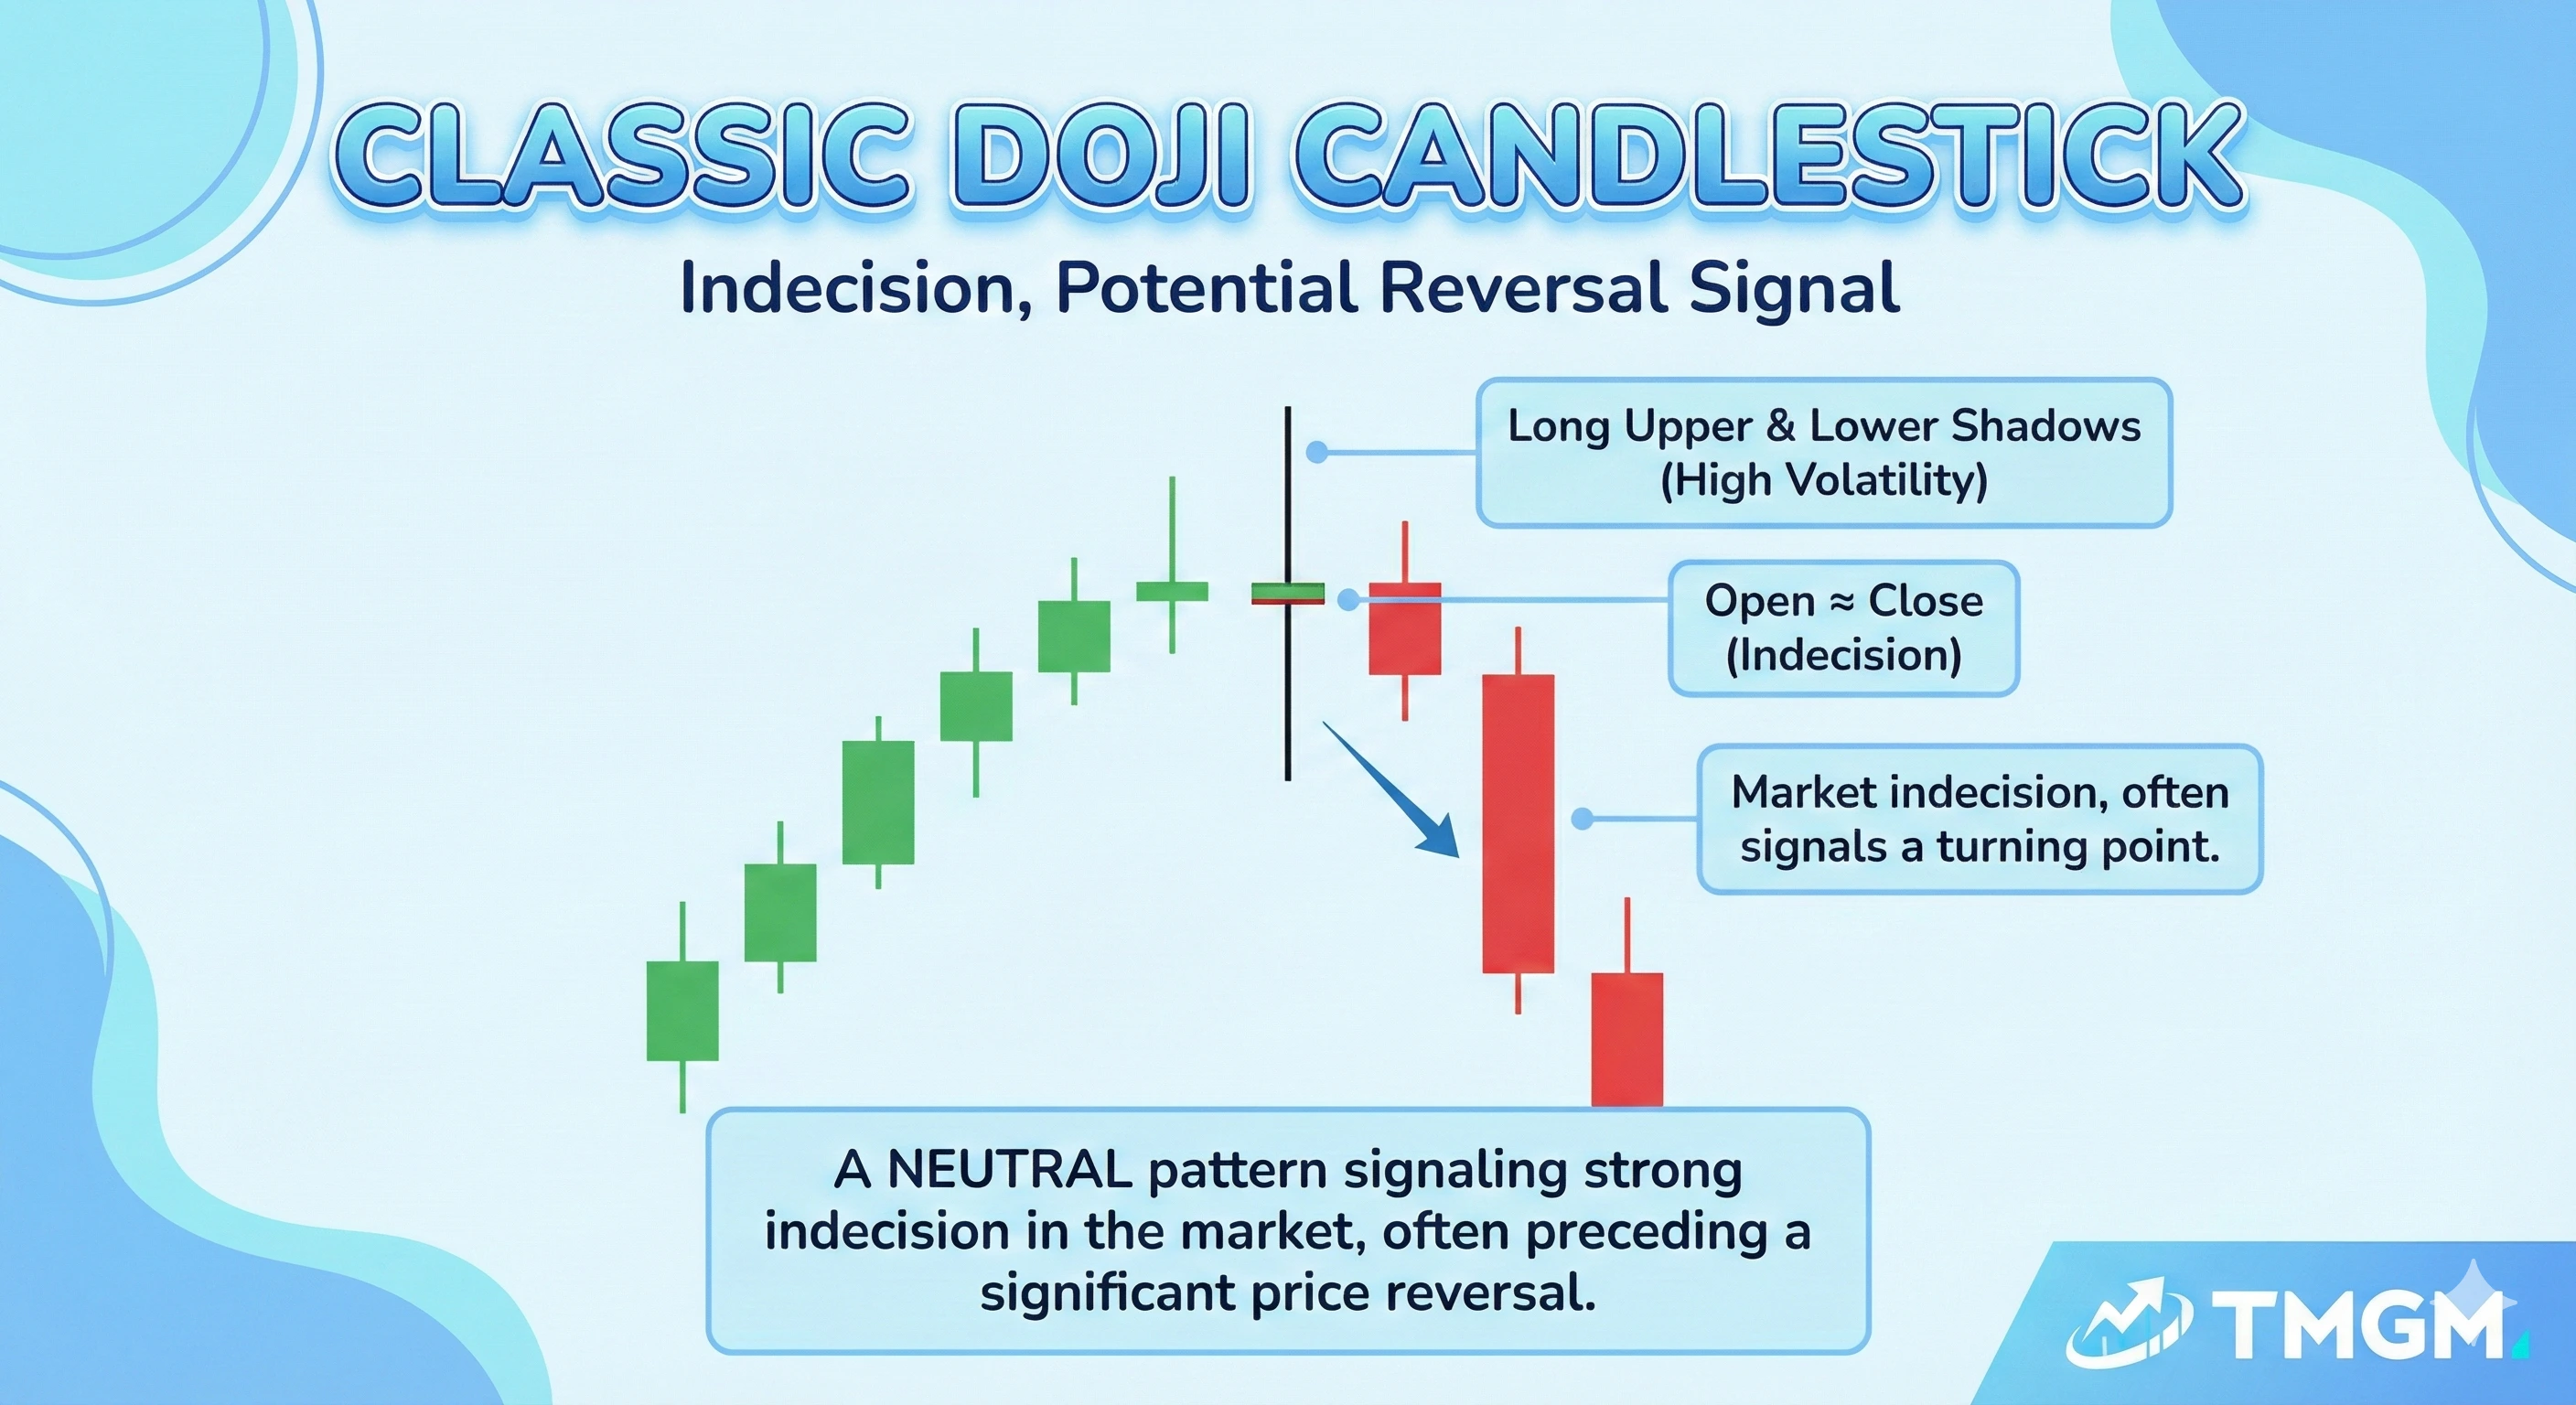
The standard doji has a very small body with upper and lower wicks that are often fairly balanced. It usually reflects general indecision with no strong directional rejection.
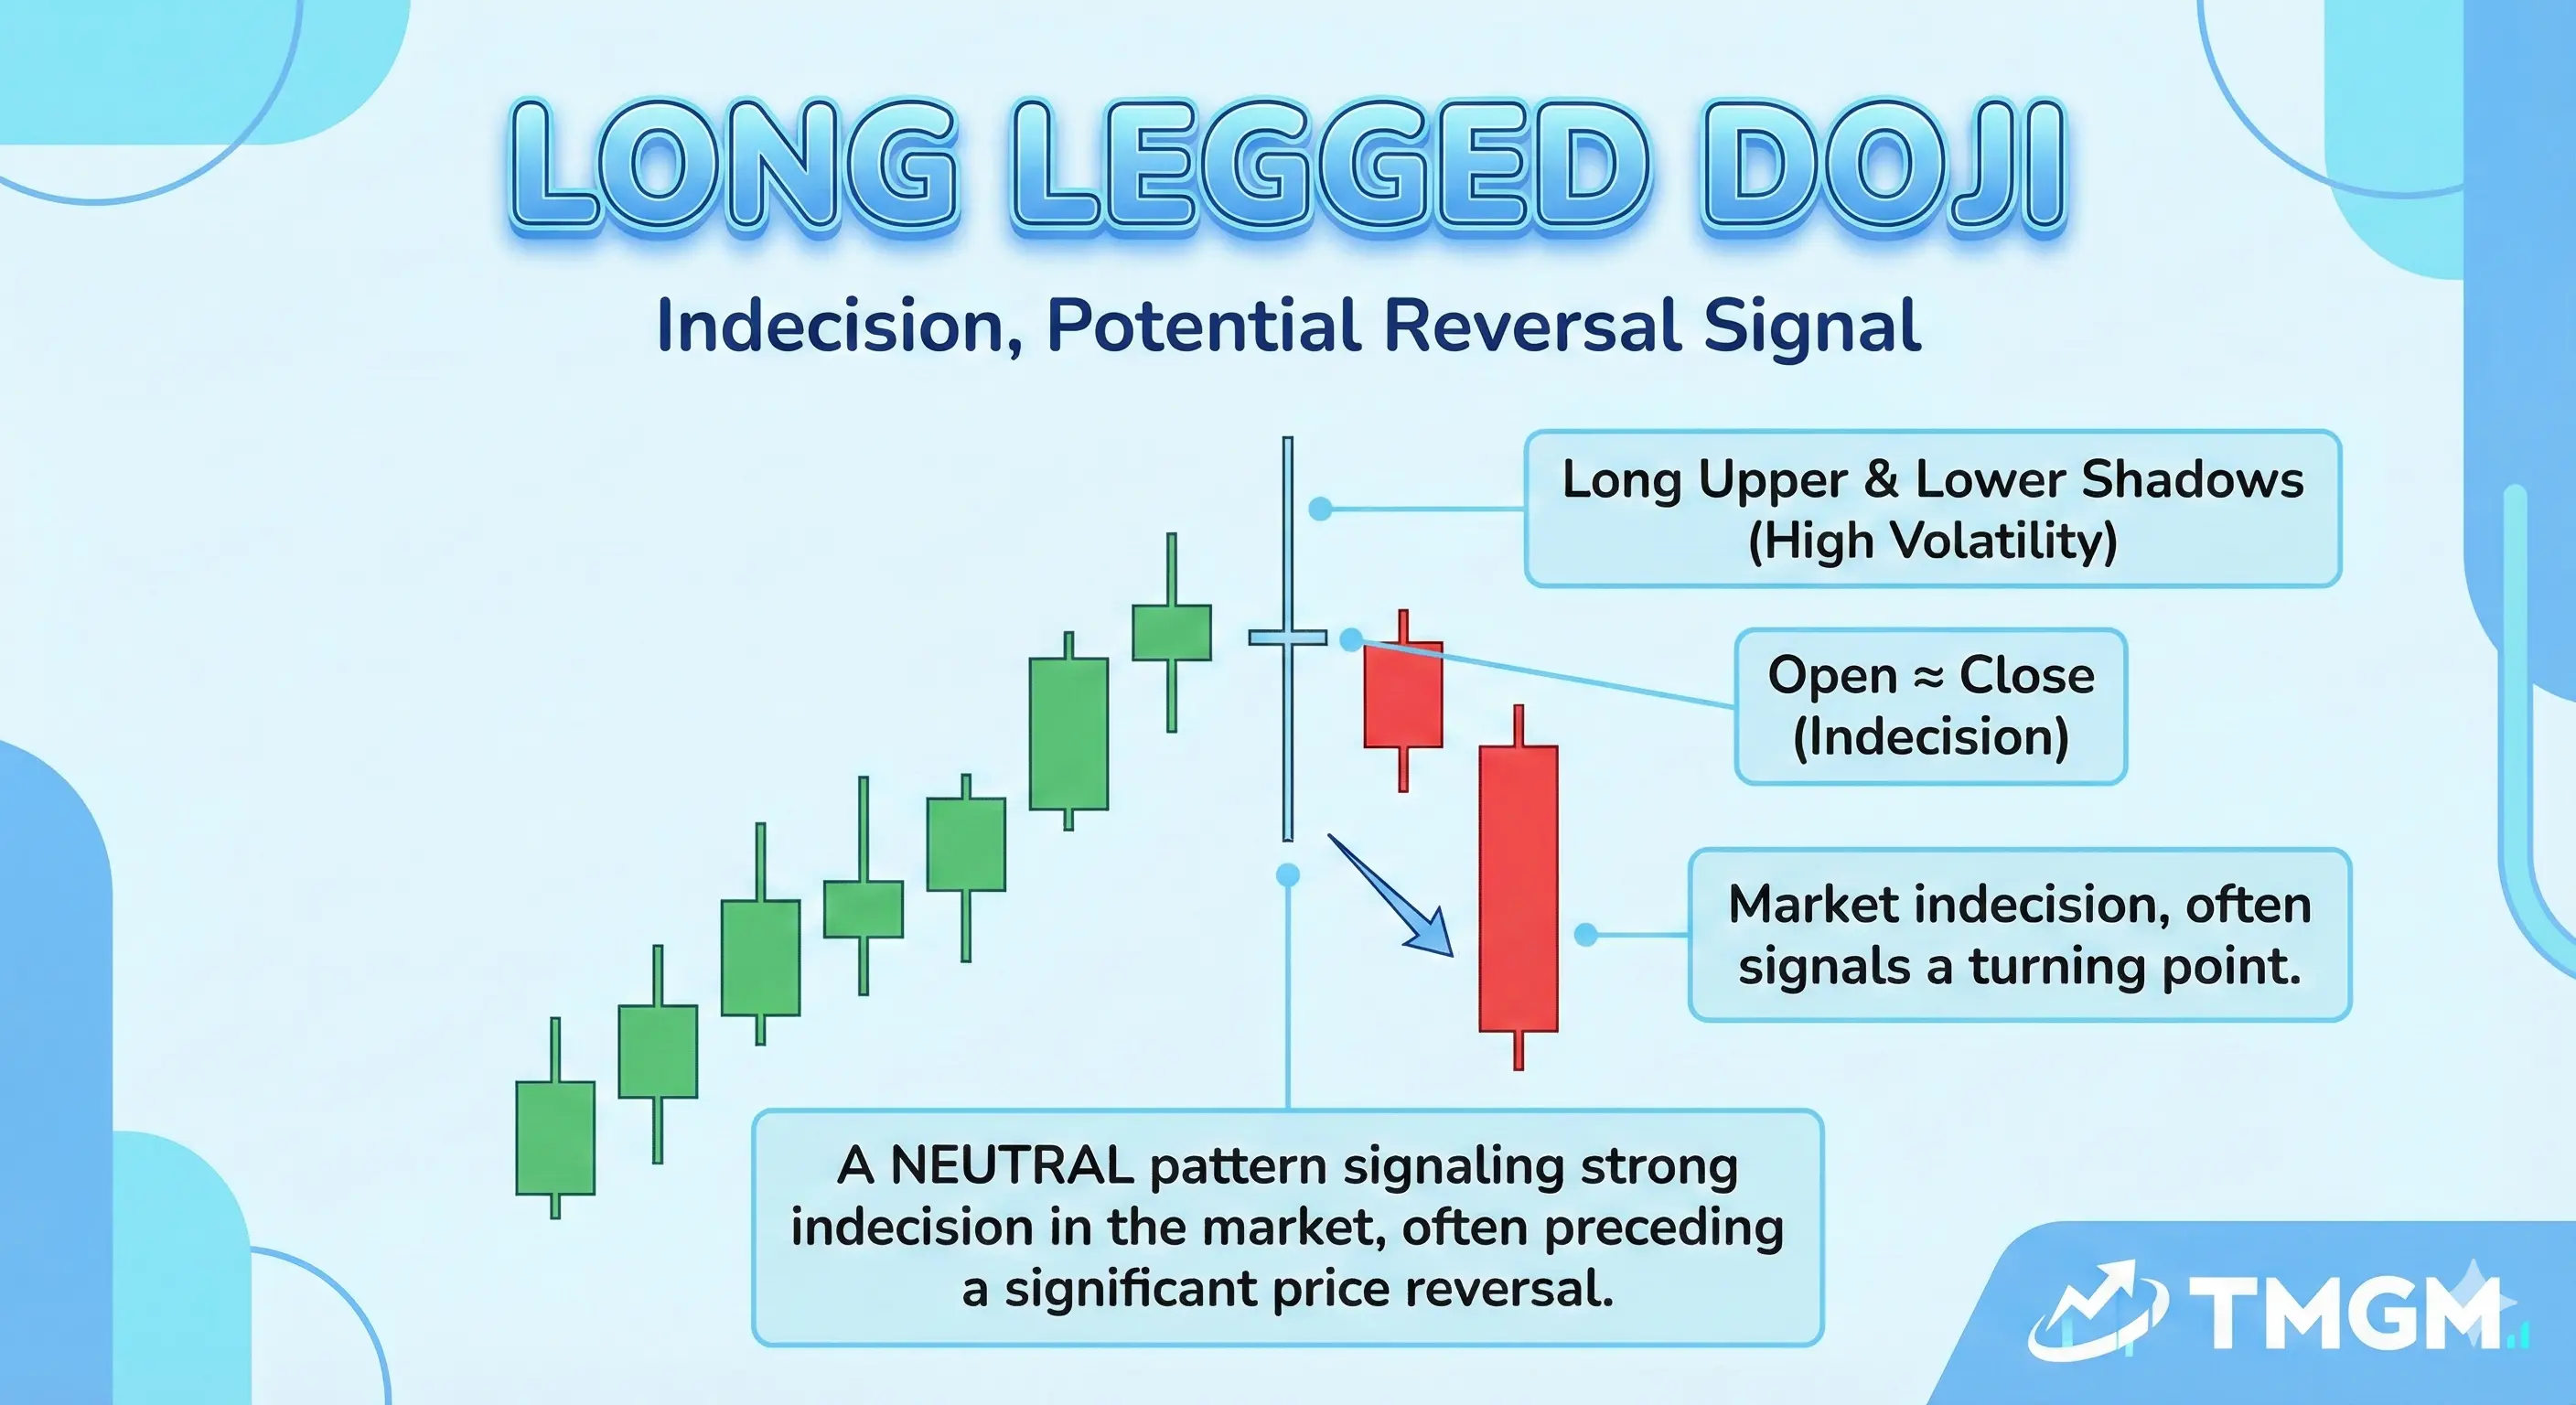
The long legged doji has long upper and lower wicks. This shows more aggressive two way price movement during the session, but still no clear winner by the close.
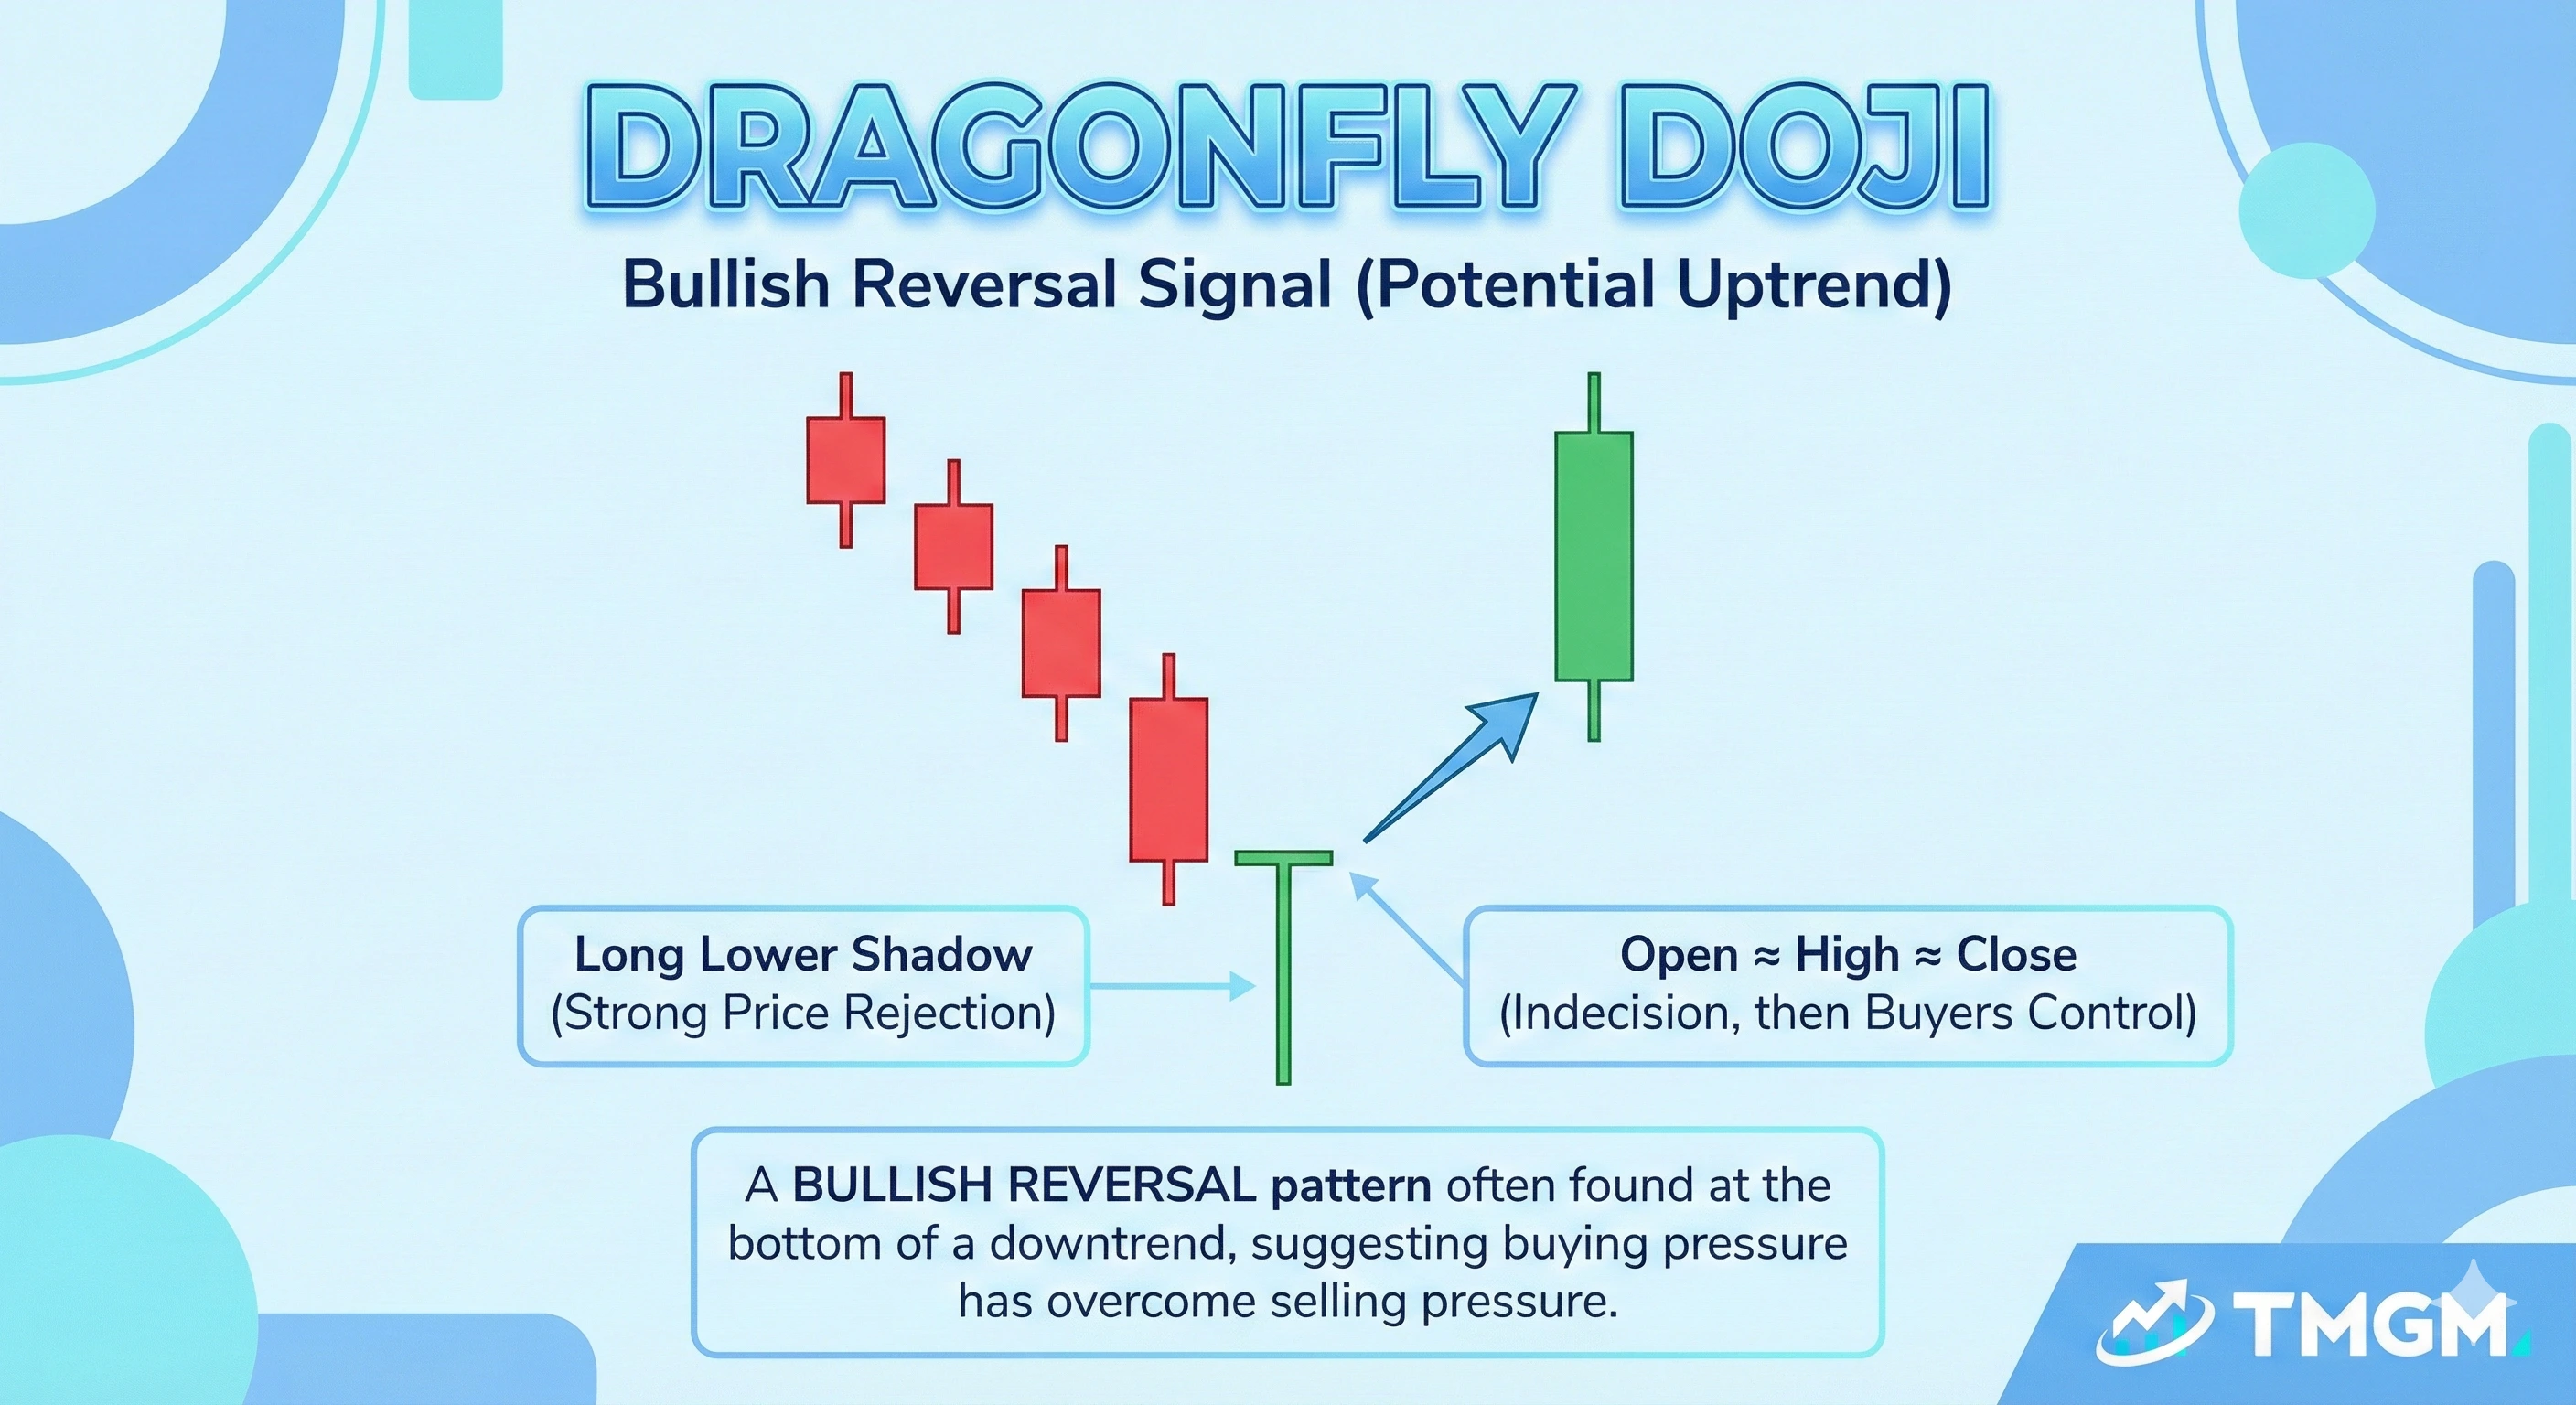
The dragonfly doji has little or no upper wick and a long lower wick. It shows that sellers drove price lower, but buyers recovered the move and pushed the close back near the open.
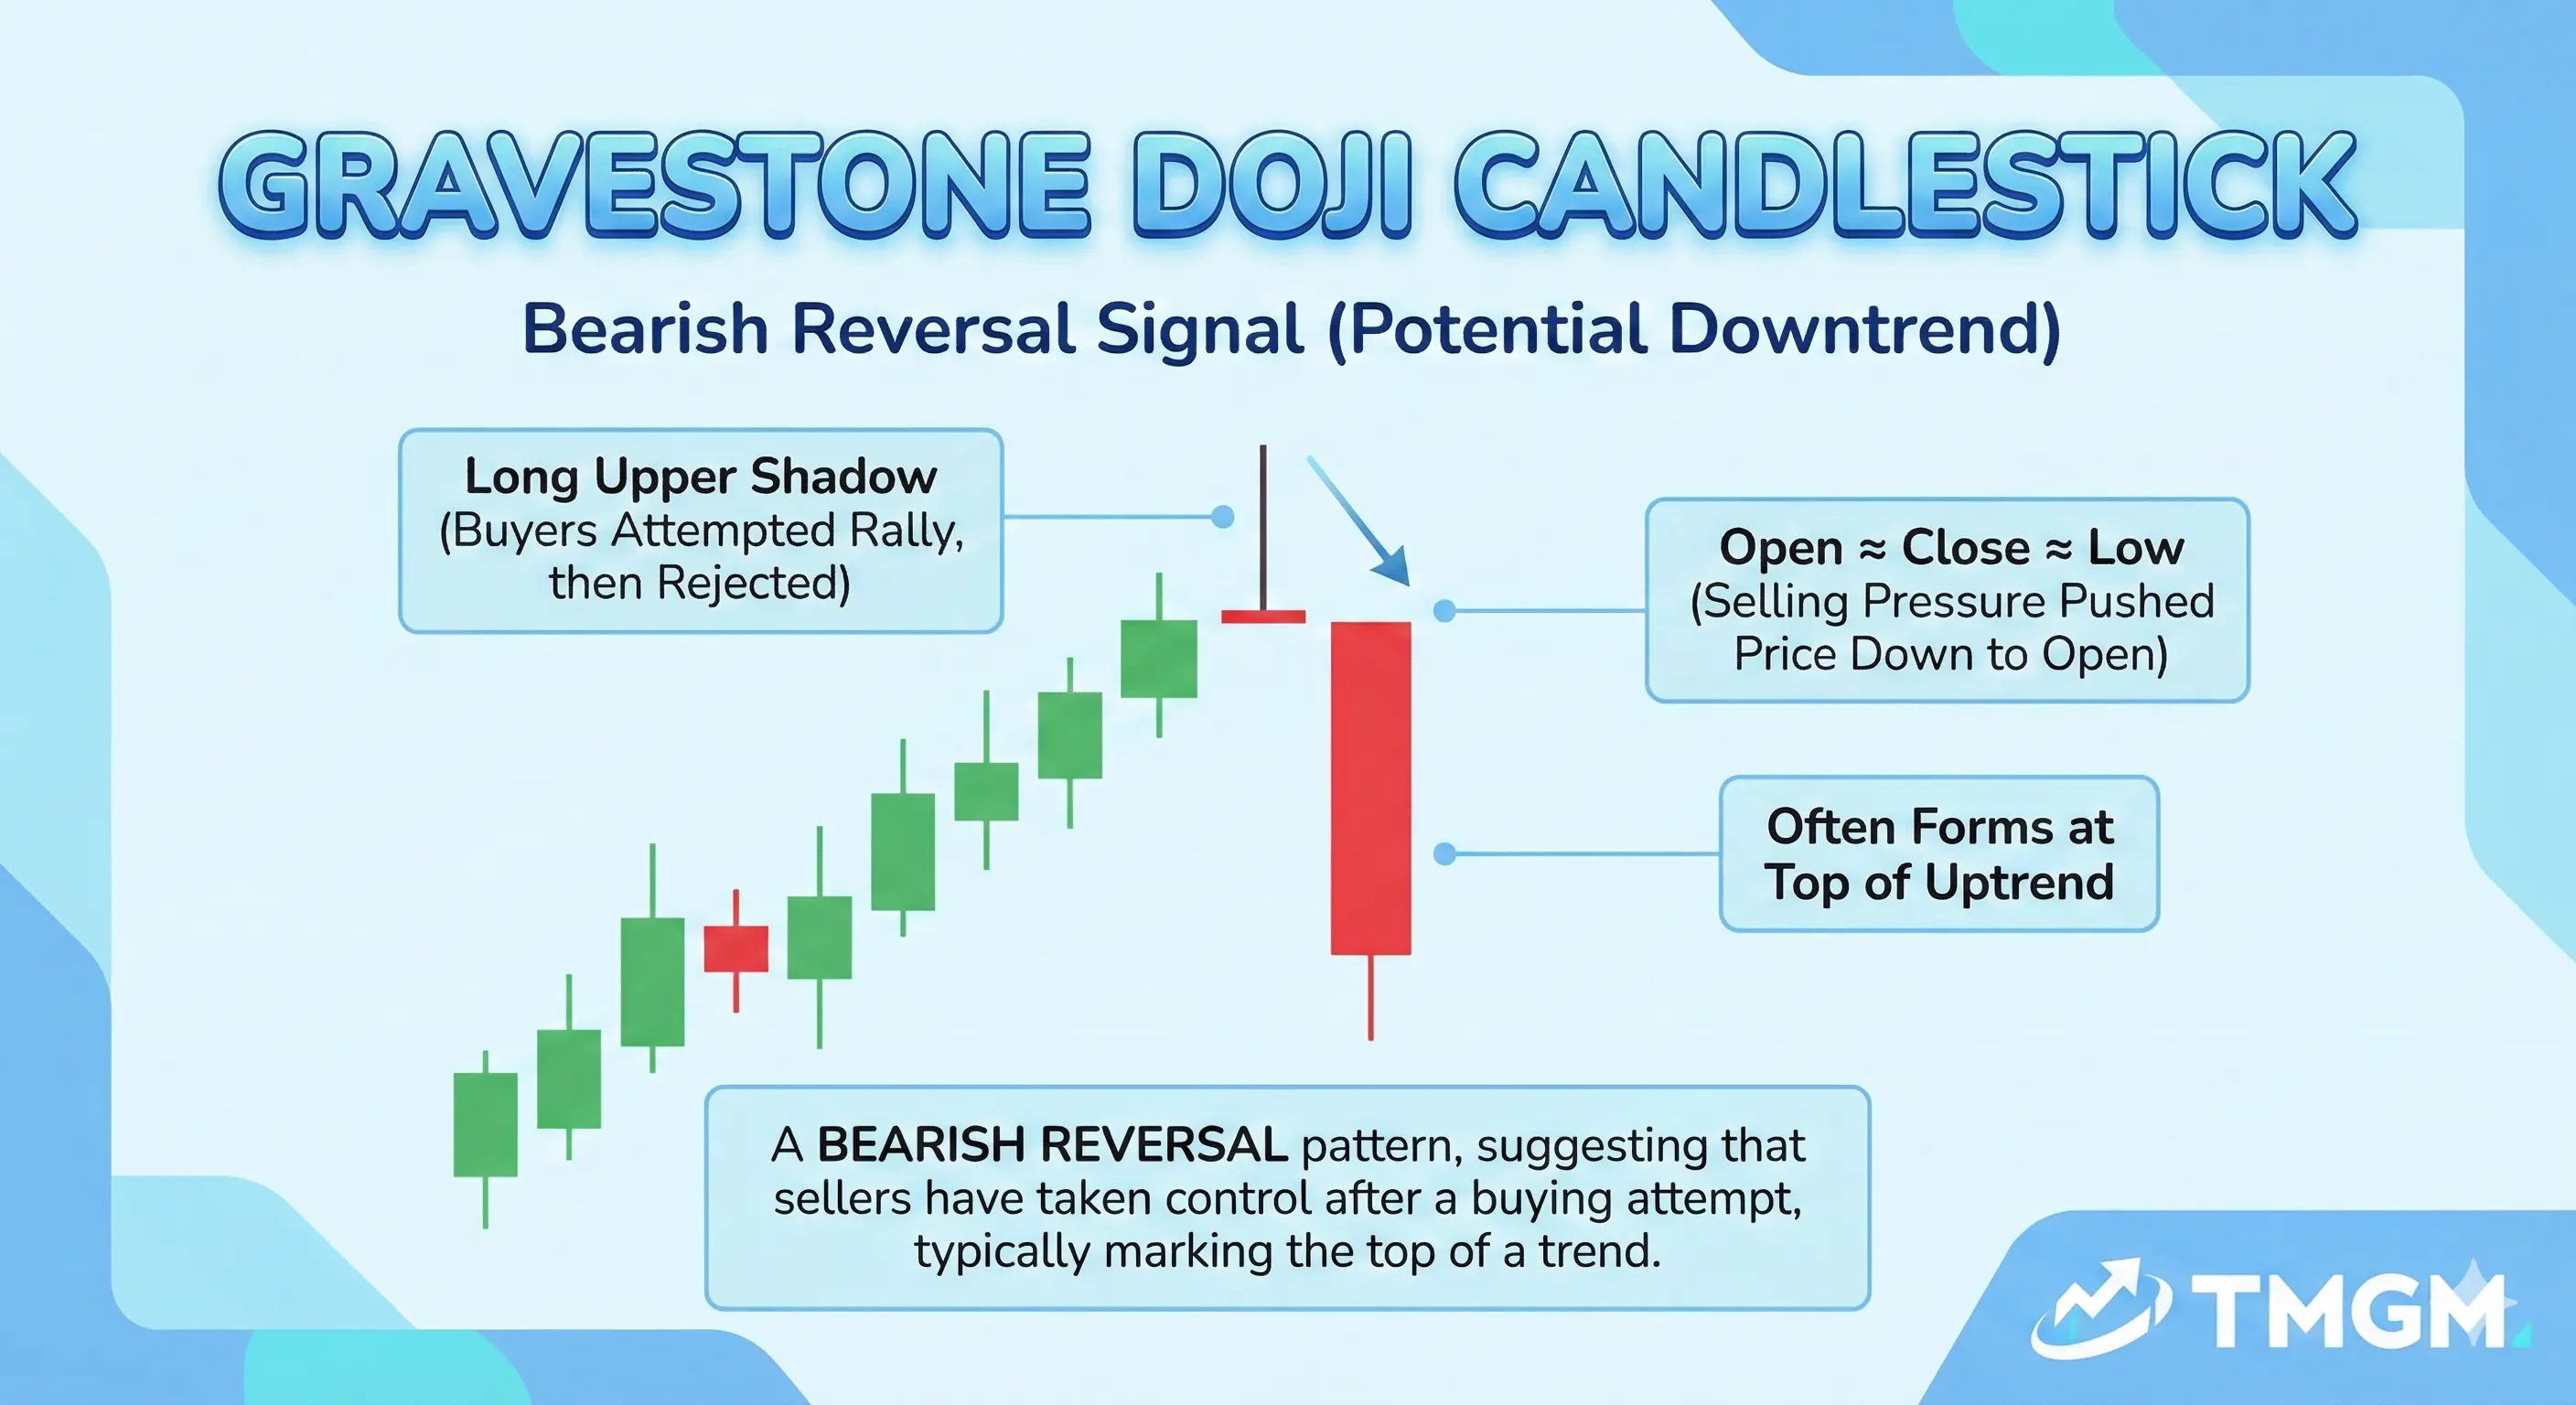
The gravestone doji has little or no lower wick and a long upper wick. It shows that buyers pushed price higher, but sellers erased the move before the close.
Doji Candlestick vs Spinning Top
A doji candlestick and a spinning top both show hesitation, but they are not the same pattern. The key difference is the real body size.
In a doji, the open and close are almost identical. In a spinning top, the body is still small but clearly visible, which means one side retained slightly more control by the close.
This distinction matters because the doji shows a more balanced session. A spinning top still signals indecision, but it is usually less precise as a turning point clue.
When Is a Doji Bullish, Bearish, or Neutral?
A doji is bullish only in the right context. For example, a dragonfly doji after a clear downtrend near support can suggest sellers are losing control.
A doji is bearish when it forms after an extended rally near resistance and the next candle confirms downside pressure. A gravestone doji is a common example of this setup.
A doji is neutral when it appears in the middle of a range, during low conviction trading, or without any meaningful follow through. In those cases, it often reflects pause rather than directional edge.
How Do Traders Use a Doji Candlestick in Trading?
XAUUSD Example
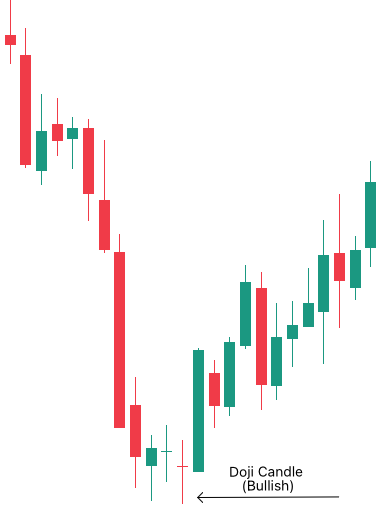
Here is a real life example of price chart data for XAUUSD where a doji candle printed on March 07, 2019. For a beginner, the key is to focus on sequence rather than reacting to the doji immediately.
First, notice that the doji appears after a strong selloff (downtrend) and near the bottom of the move, which makes it more meaningful from a price action perspective.
Second, wait for confirmation instead of entering by the doji itself. In this chart, the next strong bullish candle closes above the doji range, which is the signal that buyers may be starting to regain control.
Third, build the trade around that confirmation. Entry is often considered above the doji high or the confirmation candle, while the stop loss is usually placed below the doji low or the most recent swing low.
This helps beginners understand that the doji highlights a possible turning point, but the confirmation candle is what makes the setup tradable.
Pro Tip: The doji is the warning signal. The next candle is the decision signal.
Which Tools Can Confirm a Doji Signal?
Support and resistance are the most important confirmation tools because they give the candle a meaningful location. A doji at a key level is more useful than a doji in open space.
Volume helps show participation. If a doji forms at a turning point and the next candle breaks with stronger volume, the signal carries more weight.
RSI can help identify momentum exhaustion. A bearish doji near resistance with RSI divergence is often more relevant than the same candle without divergence.
MACD helps traders judge momentum shift rather than candle shape alone. A doji followed by a momentum crossover or histogram weakening can strengthen the case for reversal or slowdown.
Moving averages and Trendlines help define whether the doji forms in line with the broader trend or against it. This matters because countertrend doji setups usually need stronger confirmation.
What Are the Limitations of a Doji Candlestick?
The biggest limitation is that a doji is not predictive by itself. It only shows that the market paused or balanced during one candle period.
Some traders often overread it as a reversal signal when it may only reflect temporary hesitation. This mistake is commonly seen in choppy markets, low liquidity conditions, and lower time frames.
Important
A doji without confirmation is analysis. A doji with confirmation is a setup.
Does a Doji Candlestick Work in Forex, Stocks, and Crypto?
Yes, the doji candlestick pattern appears in Forex, Gold, Crypto, Oil, Shares and so on. The pattern is universal because it reflects the relationship between open, high, low, and close.
What changes across markets is the quality of the signal. In liquid markets with cleaner structure, the doji is usually easier to interpret than in thin or highly erratic markets.
Time frame also matters. A doji on a higher time frame usually carries more analytical weight than a doji on a very low time frame, where noise and spread distortion are more common.
How Should Traders Read a Doji Based on Market Context?
This context based reading is what separates basic pattern recognition from actual trading interpretation.
A doji after a strong uptrend can signal buying pressure is slowing, especially if it forms near resistance. That does not confirm reversal, but it warns that upside momentum may be weakening.
A doji after a strong downtrend can signal that selling pressure is fading, especially near support. This is where traders often watch for bullish confirmation on the next candle.
A doji at resistance has a different meaning from a doji at support. At resistance, it may reflect failed buying continuation. At support, it may reflect seller exhaustion.
A doji inside a range is usually less important because indecision is already expected in range conditions. In that setting, the candle often adds little unless it forms exactly at a key boundary.
A doji near a breakout level can be especially useful. It may show either breakout hesitation before continuation or a failed breakout that reverses back into the prior range.
Pro Tip: A doji at a major level can matter a lot, while a doji in the middle of random consolidation may mean very little.
Doji Candlestick FAQ
Is a doji candlestick a reversal signal?
A doji candlestick can appear before a reversal, but it is not a reversal signal on its own. Traders usually need confirmation from the next candle and the surrounding chart context.
Which doji candlestick is the strongest?
There is no single strongest doji in every situation. A dragonfly doji near support after a decline and a gravestone doji near resistance after a rally are both strong only when location and confirmation support the setup.
Is a doji better on higher time frames?
Yes, a doji is usually more reliable on higher time frames because there is less random noise and the candle reflects more meaningful order flow. Lower time frame doji candles form more often, but many carry less signal quality.


