


Hammer Candlestick Pattern at a Glance
1 A hammer candlestick has a small body near the top of the candle and a long lower wick that shows rejection of lower prices.
2 The main types of hammer candlestick include the classic hammer, the inverted hammer candlestick pattern, and the hanging man candlestick.
3 A bullish hammer candlestick usually appears after a downtrend, while a bearish hammer candlestick usually refers to the same shape after an uptrend.
4 A red hammer candlestick can still be valid, and a green hammer candlestick is not automatically stronger unless the context supports it.
5 The hammer candlestick pattern matters because it can signal a shift in price action, but confirmation from the next candle is still required.
6 Some traders use the term reverse hammer candlestick for the inverted hammer candlestick, although the standard term is usually inverted hammer.
What Is Hammer Candlestick Pattern
A hammer candlestick pattern is a reversal formation that usually appears after a sustained decline. It signals that price moved sharply lower during the session, but buyers absorbed the selling pressure and pushed the close back near the top of the candle.
This pattern is called a hammer candlestick because of its shape. The long lower wick looks like the handle, while the small body near the top looks like the head. In practical terms, it shows that the market tested lower prices and rejected them before the candle closed.
The pattern becomes more meaningful when it appears after a clear downtrend, near a support zone, or after an extended selloff. On its own, it is an early clue. With confirmation, it can become a trade setup.
Note
The hammer candlestick is used across forex, gold, crypto, oil, and shares because it reflects price behavior rather than a market specific rule, although it works best in liquid conditions.
Components of Hammer Candlestick Pattern
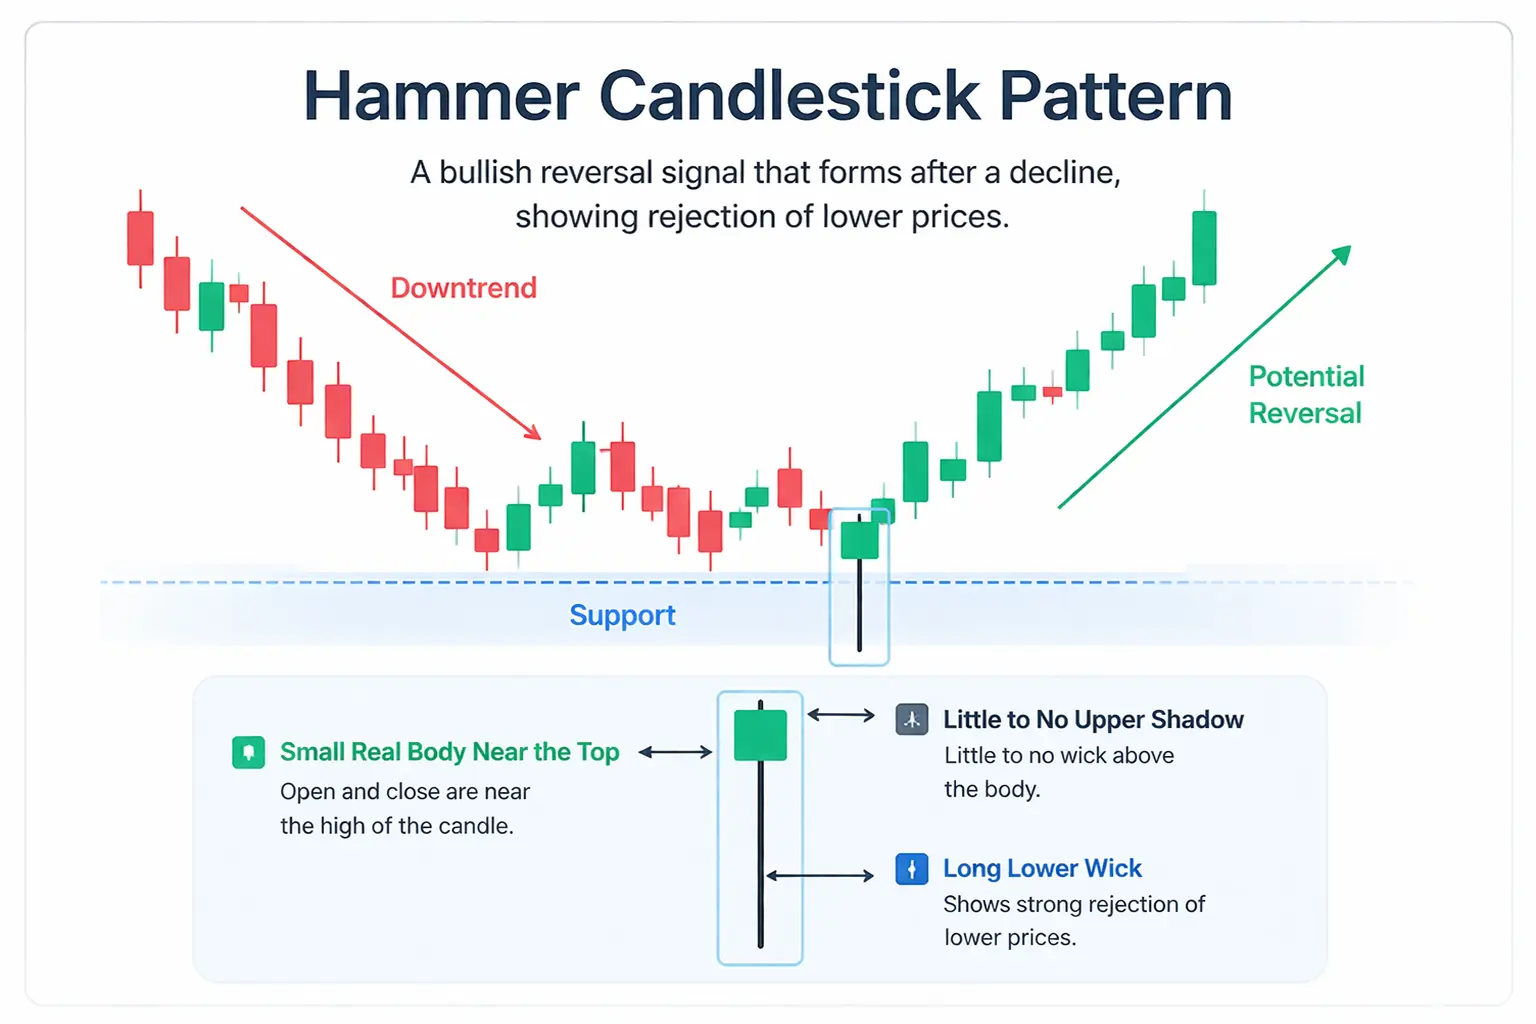
The hammer candlestick pattern is built from a small number of visual components:
Small real body near the top
The open and close sit close together near the upper part of the candle.Long lower wick
The lower shadow should be much longer than the body. This shows strong rejection of lower prices.Little to no upper shadow
A clean hammer usually has very little wick above the body.Appears after a decline
The pattern has more value when it forms after sustained selling pressure.Needs confirmation
The candle shape alone is not enough. Traders usually want the next candle to confirm the reversal.
Body color matters less than structure. A green candle may look stronger, but the shape and the trend context matter more than color alone.
Is Hammer Candlestick Bullish or Bearish?
A hammer candlestick is not automatically bullish or bearish just because of its shape. Context decides the meaning.
Bullish hammer candlestick
A bullish hammer candlestick usually forms after a downtrend. It suggests that sellers drove price lower, but buyers stepped in strongly enough to recover most of the drop before the close. If the next candle confirms the move higher, the setup can signal a bullish reversal.
Bearish hammer candlestick
A bearish hammer candlestick usually refers to the same basic shape when it appears after an uptrend. In that context, traders more often call it a hanging man candlestick. The shape is similar, but the message changes because it forms after a rally rather than after a decline.
Red hammer candlestick and green hammer candlestick
A red hammer candlestick does not automatically make the setup bearish. It can still be valid if it forms after a decline and the next candle confirms bullish follow through.
A green hammer candlestick often looks stronger because the close finishes above the open, but it is still not enough on its own. Traders should avoid judging the pattern by color alone.
In short, the hammer can be bullish or bearish depending on where it appears in the trend and whether the next candle confirms the move.
Hammer Candlestick Price Action Explained
The price action behind the hammer candlestick is simple. Sellers control the session early and push prices sharply lower. Then buyers step in, absorb the selling pressure, and force the market back toward the opening level before the candle closes.
That is why the long lower wick matters. It shows that the market tried to continue lower and failed. This failed downside move is often the first sign that bearish momentum is fading.
For traders, the important message is not just the wick itself. It is what the wick represents: rejection, absorption, and a possible shift in control. The hammer does not confirm a reversal by itself, but it shows that the prior move is no longer as one sided as before.
Trading Significance of Hammer Candlestick
The hammer candlestick pattern is important because it can highlight a possible turning point after a decline. It becomes more useful when it forms near support or after extended selling pressure.
Traders who practice technical analysis especially value it because it creates a clear invalidation level at the wick low and a clear confirmation idea through the next candle. On its own, it is a warning. With context and confirmation, it can become a practical reversal setup.
How to Trade Hammer Candlestick Pattern
The hammer candlestick pattern is best used as a trend reversal signal, not as a standalone entry trigger. Its role is to show that the existing trend may be losing control and that price is starting to reverse against the prior trend.
In a bullish hammer candlestick setup, it forms after a clear decline, signaling a reversal into a bullish trend. The strategy is to look for it near support, a prior swing low, or an area where price has already reacted before. In that context, the long lower wick suggests that sellers pushed price down but failed to hold it there. This can be an early sign that bearish momentum is fading.
In a bearish setup, traders apply the same reversal logic to the hanging man candlestick after an uptrend. The candle shape may look similar, but the meaning changes because it appears after a rally. In this case, the rejection inside the candle can warn that buyers are losing control.
The main idea is simple. A hammer based setup works best when it appears at the end of a directional move, forms at an important level, and is followed by confirmation from the next candle. Without that context, the pattern is just a candle shape. With the right context, it becomes a trend reversal signal that traders can build a strategy around.
How to Trade Hammer Candlestick Pattern with Examples
XAUUSD bullish example
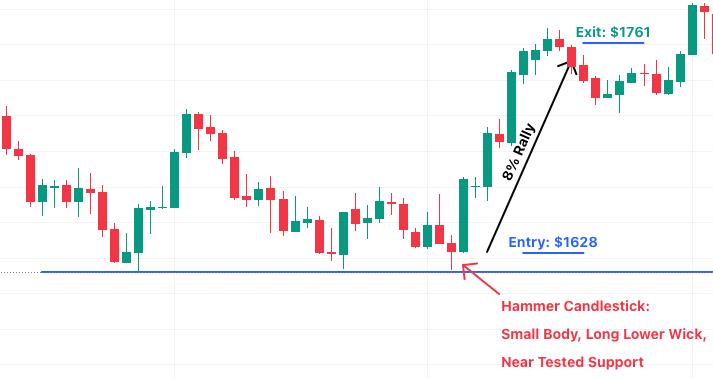
This example shows how a hammer candlestick can support a bullish reversal after a decline.
Identify:
A classic hammer candlestick forms after a downtrend and appears near a tested support level. The candle has a small real body near the top and a long lower wick, showing that sellers pushed price sharply lower but buyers stepped in and drove the close back up. The next bullish candle then helps confirm that reversal pressure is building.
Entry:
A common entry is above the high of the hammer or after the next bullish candle confirms the move higher. A more conservative approach is to wait for a small pullback or retest after confirmation.
Stop loss:
Stop loss is usually placed below the low of the hammer wick, because a break below that level weakens the bullish reversal idea.
Take profit:
Take profit can be set at the next resistance zone or based on a minimum 2:1 risk to reward ratio. In stronger moves, traders may also scale out at the first target and leave part of the position open for further upside.
Types of Hammer Candlestick and Main Variations
The main types of hammer candlestick that traders compare are the classic hammer candlestick, the inverted hammer candlestick pattern, and the hanging man candlestick.
Classic hammer candlestick
This is the standard bullish version. It appears after a downtrend and has a small body near the top with a long lower wick. It suggests rejection of lower prices and possible reversal strength.
Inverted hammer candlestick
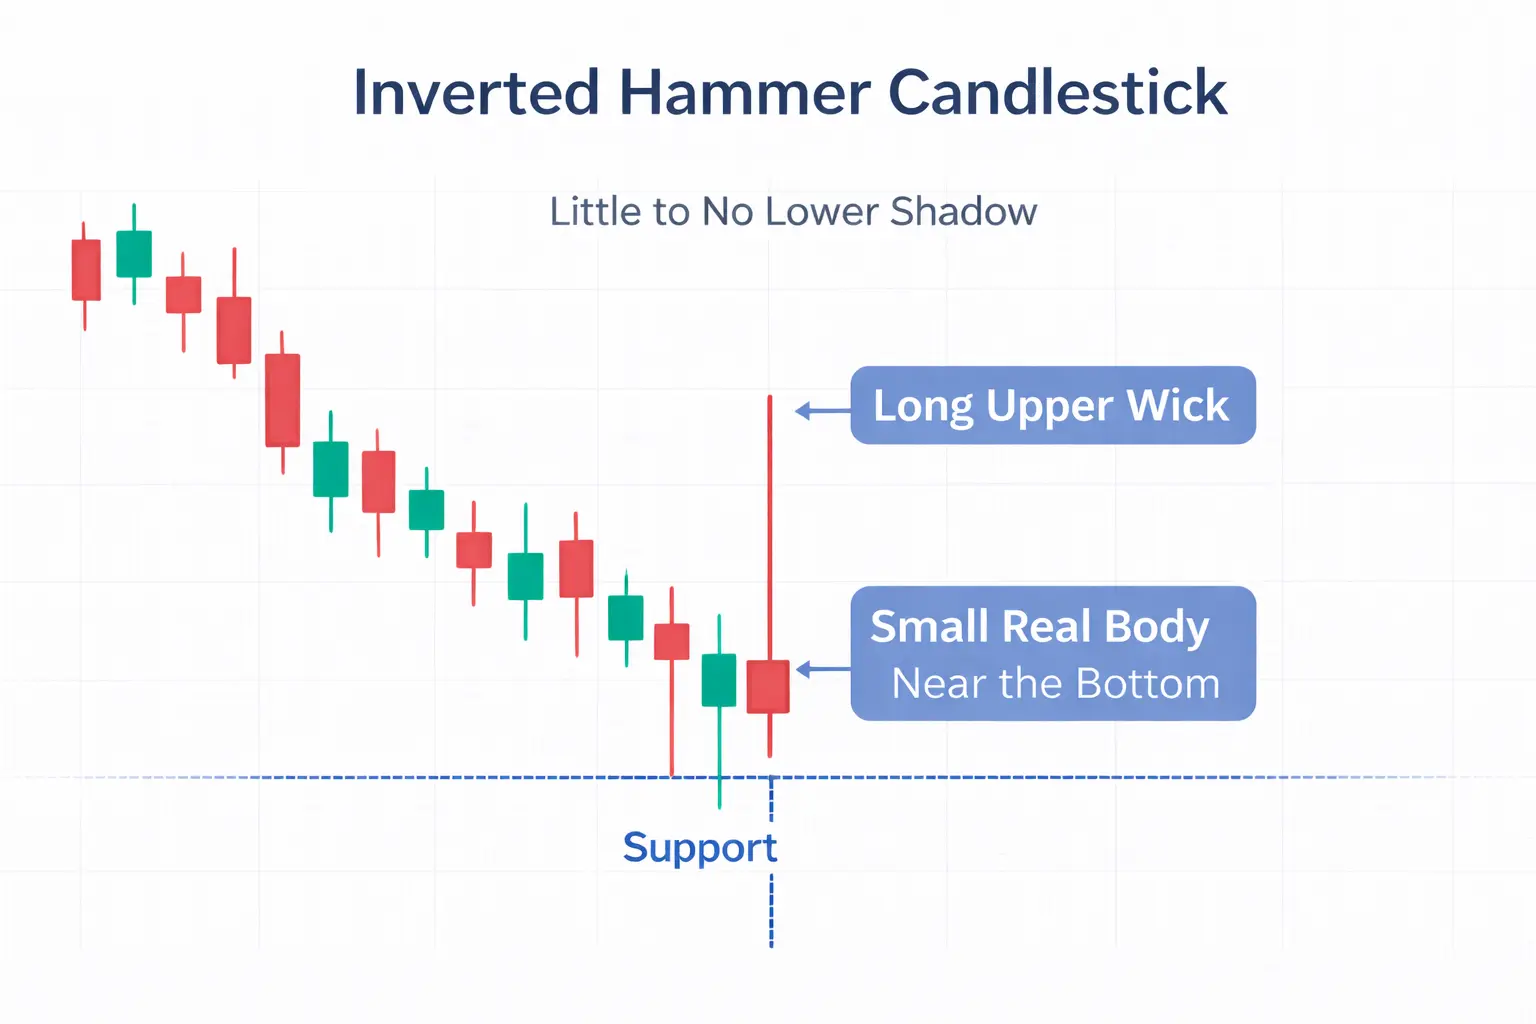
The inverted hammer candlestick also appears after a downtrend, but its shape is different. It has a small body near the lower part of the candle and a long upper wick. This shows that buyers were able to push price higher during the session, even if the close faded back.
The inverted hammer candlestick pattern is still treated as a bullish reversal warning, but it needs confirmation because the candle itself does not prove that buyers fully took control.
Some traders use the term reverse hammer candlestick for the same formation. In most trading usage, reverse hammer candlestick and inverted hammer candlestick refer to the same pattern.
Hanging man candlestick
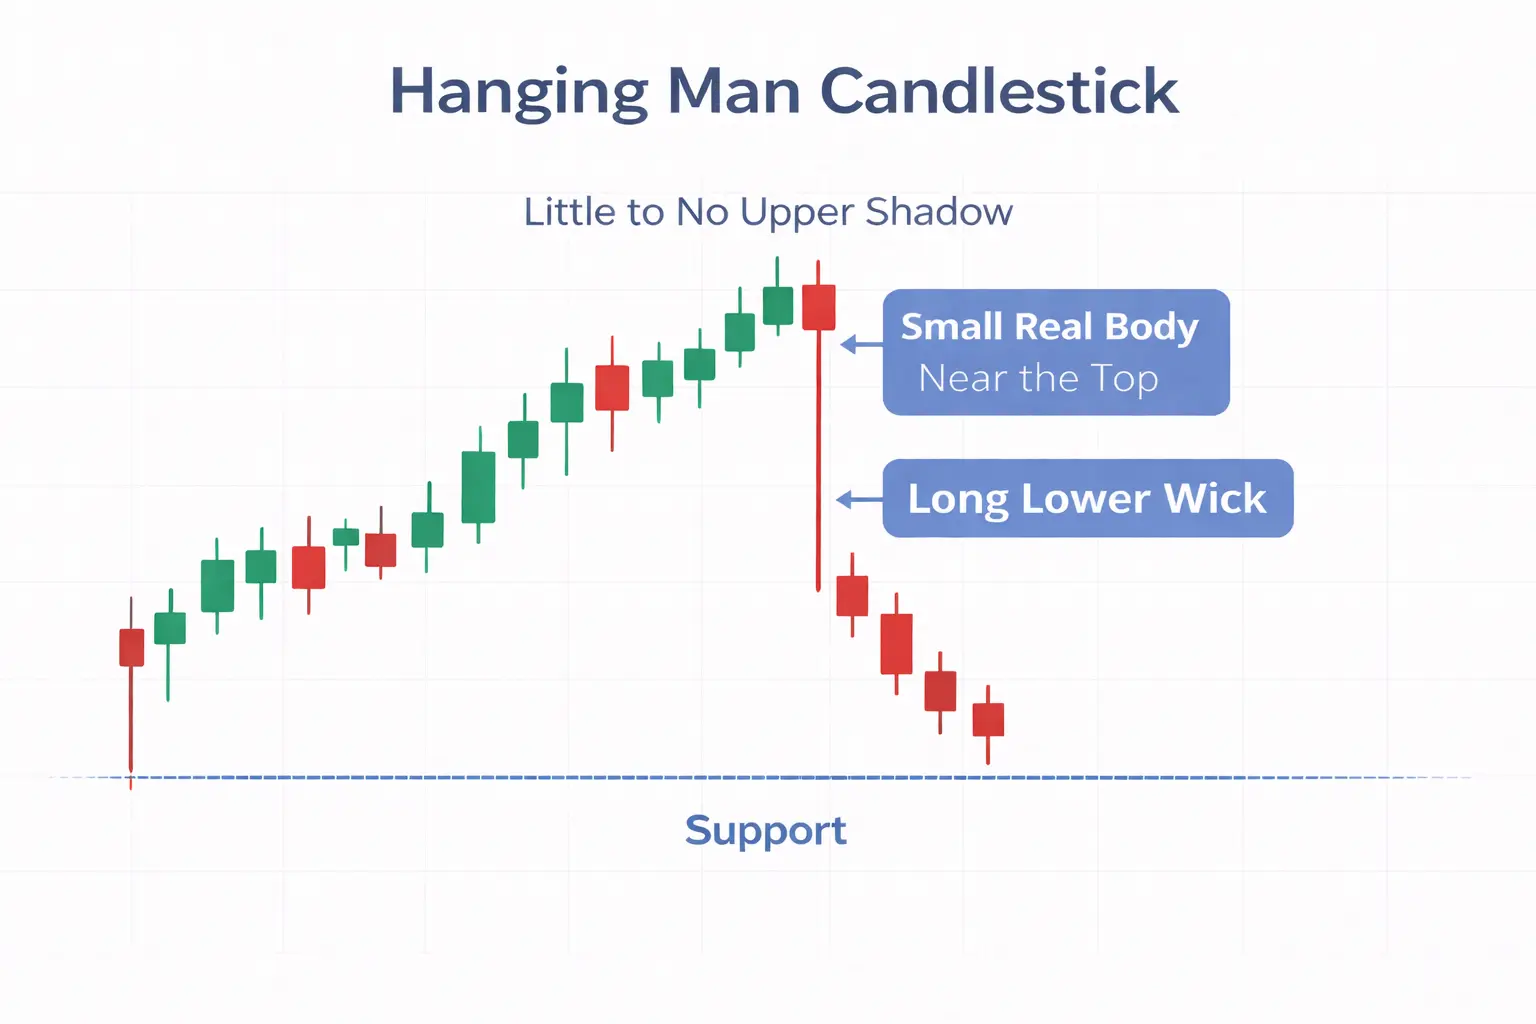
The hanging man candlestick has a shape similar to the classic hammer, but it appears after an uptrend. Because of that context, traders interpret it as a bearish warning rather than a bullish reversal setup.
FAQ
Is a hammer candlestick always bullish?
No. A hammer candlestick is often bullish after a downtrend, but the same shape after an uptrend is usually treated as a hanging man candlestick, which has bearish implications.
Is reverse hammer candlestick different from inverted hammer candlestick?
In most trading usage, reverse hammer candlestick and inverted hammer candlestick refer to the same candle structure. The standard textbook term is usually inverted hammer candlestick.
Does a red hammer candlestick mean the trade is bearish?
No. A red hammer candlestick does not automatically mean bearish, just as a green hammer candlestick does not automatically guarantee a bullish move. Context, trend location, and confirmation decide how the candle should be interpreted.


