


Triple Top and Triple Bottom at a Glance
1 A triple top is a bearish reversal pattern that forms after an uptrend and confirms when price breaks below the neckline.
2 A triple bottom is a bullish reversal pattern that forms after a downtrend and confirms when price breaks above the neckline.
3 The pattern is not valid just because price tests a level three times. Confirmation comes from the neckline break.
4 Volume expansion, momentum divergence, and a clean retest can strengthen the setup.
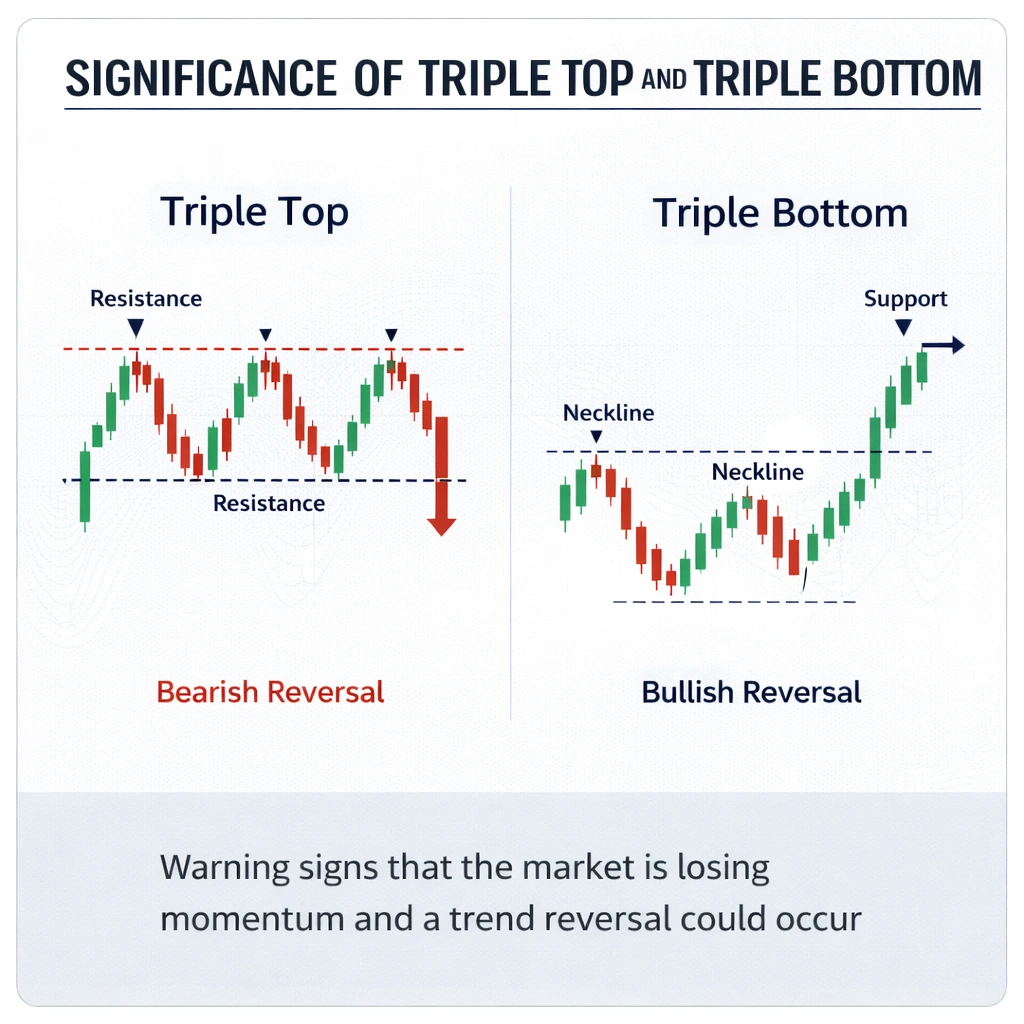
5 Triple top and triple bottom patterns matter because they show a shift in control from buyers to sellers or from sellers to buyers.
What Are Triple Top and Triple Bottom Patterns?
Triple top and triple bottom patterns are classical reversal structures in technical analysis. They form when price reaches the same horizontal level three times, fails to break through it, and then reverses through the neckline. This repeated failure shows that the current trend is losing strength and that control may be shifting to the opposite side of the market.
Triple Top Chart Pattern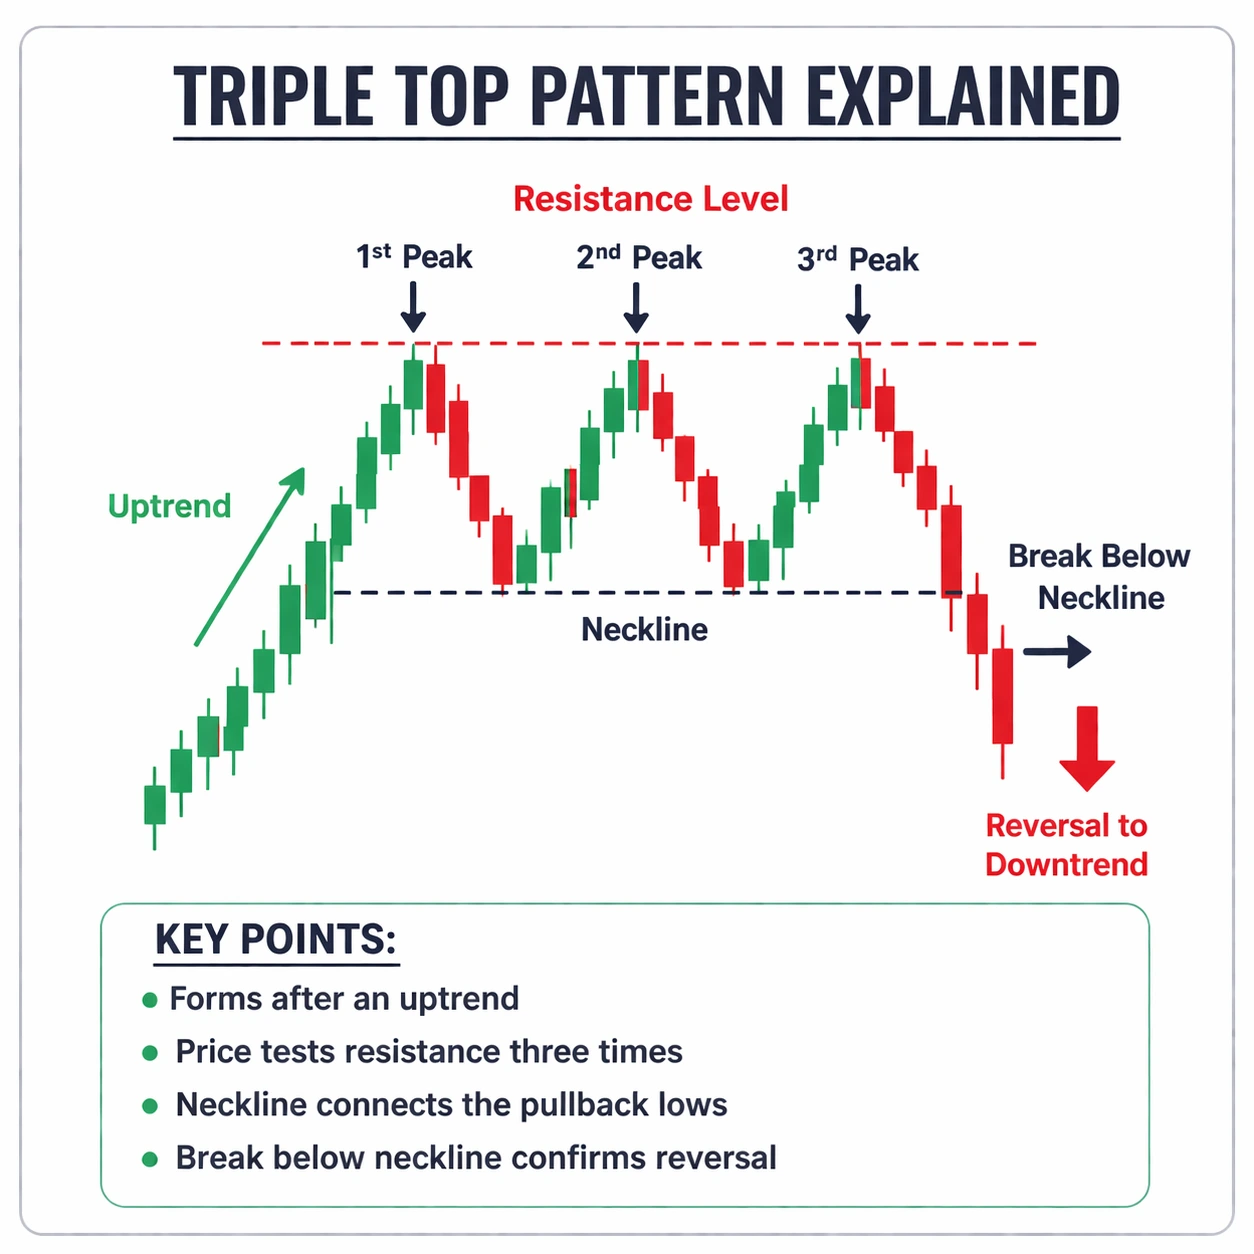 A triple top forms after an uptrend. Price reaches a resistance area three times, fails to move higher on each attempt, and then breaks below the support level between the peaks. This confirms bearish reversal pressure.
Triple Bottom Chart Pattern
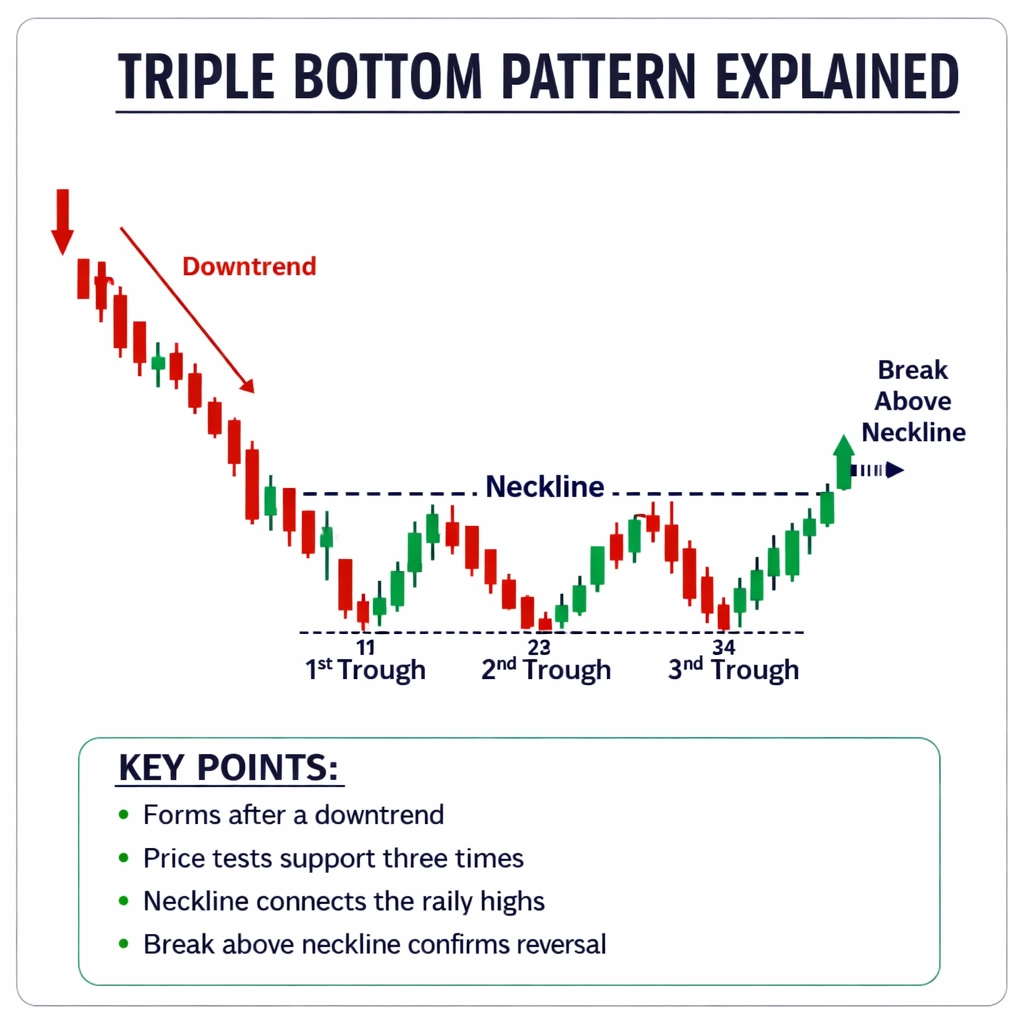
A triple bottom forms after a downtrend. Price reaches a support area three times, fails to move lower on each attempt, and then breaks above the resistance level between the troughs. This confirms bullish reversal pressure.
Both patterns are widely used in Forex, Gold, Crypto, Oil, Shares and Indices because they turn market behaviour into a visible structure that traders can evaluate.
How Do Triple Top and Triple Bottom Patterns Work?
Triple top and triple bottom patterns work by showing repeated failure at an important price level, followed by a break in the opposite direction.
In a triple top, price rises into the same resistance area three times but fails to move higher. Each rejection shows that buying pressure is weakening. When price later breaks below the neckline, it suggests sellers have taken control and the uptrend may reverse.
In a triple bottom, price falls into the same support area three times but fails to move lower. Each bounce shows that selling pressure is fading. When price then breaks above the neckline, it suggests buyers have taken control and the downtrend may reverse.
In simple terms, the pattern shows a market that can no longer continue in the same direction. The neckline break is what turns that weakness into a confirmed reversal.
Identifying Triple Top and Triple Bottom Patterns
 A trader should understand the pattern as a structure made up of several core parts.
Prior trend
The pattern needs a clear trend before it forms. A triple top without an uptrend or a triple bottom without a downtrend is weaker because there is no dominant move to reverse.
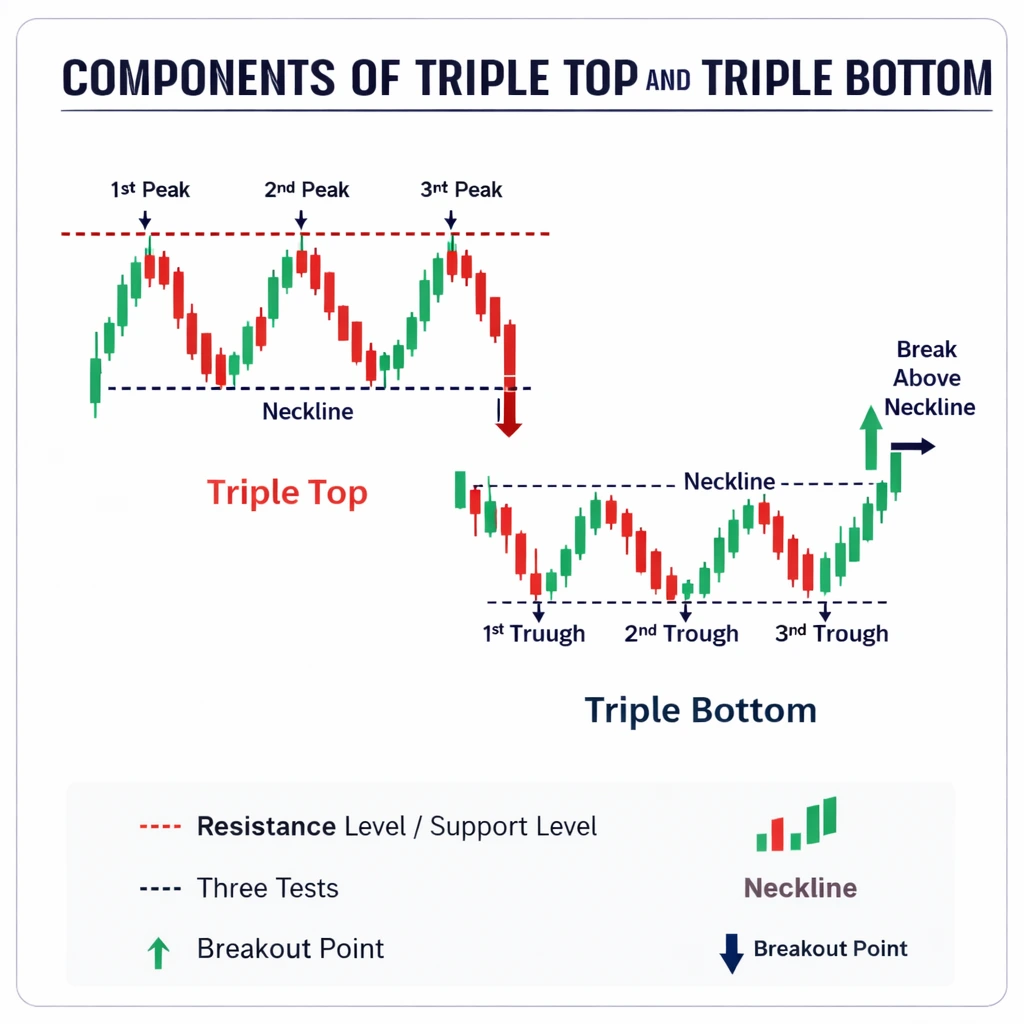
Three Equal Peaks
The three peaks in a triple top or the three troughs in a triple bottom should form near the same price zone. Exact equality is not required, but the level should be consistent enough to show repeated rejection.
Neckline
The neckline connects the two swing points between the three tests. It acts as the key confirmation level. In a triple top, it is a support. In a triple bottom, it is a resistance.
Breakout point
The breakout point is where price closes beyond the neckline. This is the trigger that turns the structure into a tradable pattern.
Volume behaviour
Volume often fades during the repeated tests and expands on the breakout. This can help confirm that the old trend is weakening and that the reversal is attracting participation.
Timeframe context
Triple top and triple bottom patterns are usually more reliable on the Daily and Weekly charts because each test reflects stronger market participation than the same setup on a very low timeframe.
Why Do Triple Top and Triple Bottom Patterns Matter in Trading?
These patterns matter because they help traders read price action in a structured way.
In a triple top, buyers push into resistance three times but fail to continue higher. This repeated failure shows that demand is being absorbed. When price finally breaks below the neckline, sellers show that they are no longer just defending the level. They are taking control.
In a triple bottom, sellers push into support three times but fail to continue lower. This repeated failure shows that selling pressure is being absorbed. When price breaks above the neckline, buyers show that they have taken control.
This is the trading significance of the pattern:
It shows trend exhaustion
The original trend is still trying to continue, but it no longer has the same strength.
It reveals a shift in control
The breakout through the neckline shows that the opposite side has gained enough strength to change direction.
It creates clear trade structure
The pattern gives traders a visible entry level, a logical stop loss level, and a measured way to estimate take profit.
It reflects price action clearly
Repeated rejection at the same level shows hesitation. The breakout shows commitment. Together, these signals explain why the pattern is watched closely in technical analysis.
How to Trade Triple Top and Triple Bottom Patterns
Identify the Pattern
Look for a clear trend, three tests of the same level, and a neckline that is easy to define. The structure should look balanced and deliberate, not random. If the peaks or troughs are too uneven, or if the neckline is unclear, the pattern is weak.
A valid pattern usually shows:
A prior uptrend or downtrend
Three clear tests of a horizontal level
Visible pullbacks between the tests
A breakout through the neckline
Better context on higher timeframes
Entry
For a triple top, the standard entry is a sell after a confirmed close below the neckline. For a triple bottom, the standard entry is a buy after a confirmed close above the neckline.
A more conservative method is to wait for a retest. In a triple top, former support should act as resistance after the breakdown. In a triple bottom, former resistance should act as support after the breakout.
Stop Loss
For a triple top, the stop loss usually sits above the highest of the three peaks. For a triple bottom, the stop loss usually sits below the lowest of the three troughs.
Some traders also use a volatility buffer such as ATR so the stop is not placed too tightly around an obvious level.
Take Profit
The most common take profit method is the measured move. Measure the vertical distance from the peaks or troughs to the neckline, then project that same distance from the breakout point.
For a triple top, the target is projected downward from the neckline break.
For a triple bottom, the target is projected upward from the neckline break.
The target should justify the risk. If the setup cannot offer a reasonable reward relative to the stop distance, the trade may not be worth taking.
Important
The third peak or third trough is not the entry signal. The trade setup becomes valid only after a confirmed neckline break.
What Signals Confirm a Triple Top or Triple Bottom?
Three tests alone do not confirm the reversal. Traders usually look for additional evidence before treating the pattern as high quality.
A full candle close beyond the neckline
A wick through the neckline is not enough. The close matters because it shows commitment.
Volume expansion on the breakout
Stronger volume on the breakout suggests broader participation and reduces the chance that the move is only a brief spike.
Momentum divergence
In a triple top, price may print similar highs while RSI makes lower highs. In a triple bottom, price may print similar lows while RSI makes higher lows. This supports weakening momentum in the original trend.
MACD alignment
A MACD crossover in the direction of the breakout can strengthen the signal, especially when it happens near the neckline break.
A clean retest of the neckline
In a triple top, the neckline should hold as resistance after the breakdown. In a triple bottom, the neckline should hold as support after the breakout. A clean retest often improves entry quality.
Higher timeframe support
A pattern that aligns with the broader Daily or Weekly structure is usually stronger than one that goes against the larger trend.
Advantages and Limitations of Triple Top and Triple Bottom Patterns
Advantages
The pattern is easy to understand once the trader knows the structure.
The neckline gives a clear confirmation level.
Entry, stop loss, and take profit levels are usually objective.
The pattern can be applied across multiple markets.
The measured move provides a simple framework for target planning.
Limitations
The pattern can take time to form on higher timeframes.
False breakouts are common in choppy market conditions.
Many traders mislabel weak consolidation as a triple top or triple bottom.
Volume analysis is less precise in decentralised Forex markets than in centralised markets.
A failed retest can quickly turn a good looking setup into a trap.
FAQ
What is the difference between a triple top and a triple bottom?
A triple top is a bearish reversal pattern that forms after an uptrend and confirms below the neckline. A triple bottom is a bullish reversal pattern that forms after a downtrend and confirms above the neckline.
When does a triple top or triple bottom become valid?
The pattern becomes valid only when price closes beyond the neckline. Before that, it is still an unconfirmed structure.
Are triple top and triple bottom patterns reliable?
They can be reliable when they form after a clear trend, show balanced structure, and break the neckline with confirmation. They are less reliable when the market is ranging or when the breakout lacks conviction.


