

Trading
Explore a wide range of markets with competitive pricing, deep liquidity, and advanced trading tools.
Learn More 
Platform
Trade seamlessly with TMGM's powerful platform, built for speed, precision, and a superior trading experience.
Learn More Trading Platform
Academy
Learn the fundamentals of trading with beginner-friendly resources, including guides, webinars, and market insights.
Learn More News & Analysis
Get real-time market updates and expert analysis to stay ahead of trading opportunities
Learn More News & Analysis
About
Learn what sets TMGM apart — our global presence, regulatory strength, and commitment to innovation in trading.
Learn More Why Choose TMGM
Sponsorship
Democrats win House and Senate in US midterms: Why might crypto still find positives?
Political uncertainty dominated the week’s market backdrop following Tuesday’s US midterm elections, in which a decisive blue wave handed Democrats control of both the House and the Senate.
The outcome underscored US voters’ dissatisfaction with elevated prices and economic conditions. Democratic candidates benefited from that sentiment even in constituencies that traditionally favour Republicans.
The change in the US political landscape has set off pronounced price fluctuations throughout the cryptocurrency market. Investors assessed what a Democrat-controlled Congress might mean, fuelling extreme volatility and liquidations across risk assets this week.
How has volatility fuelled the liquidation wave?
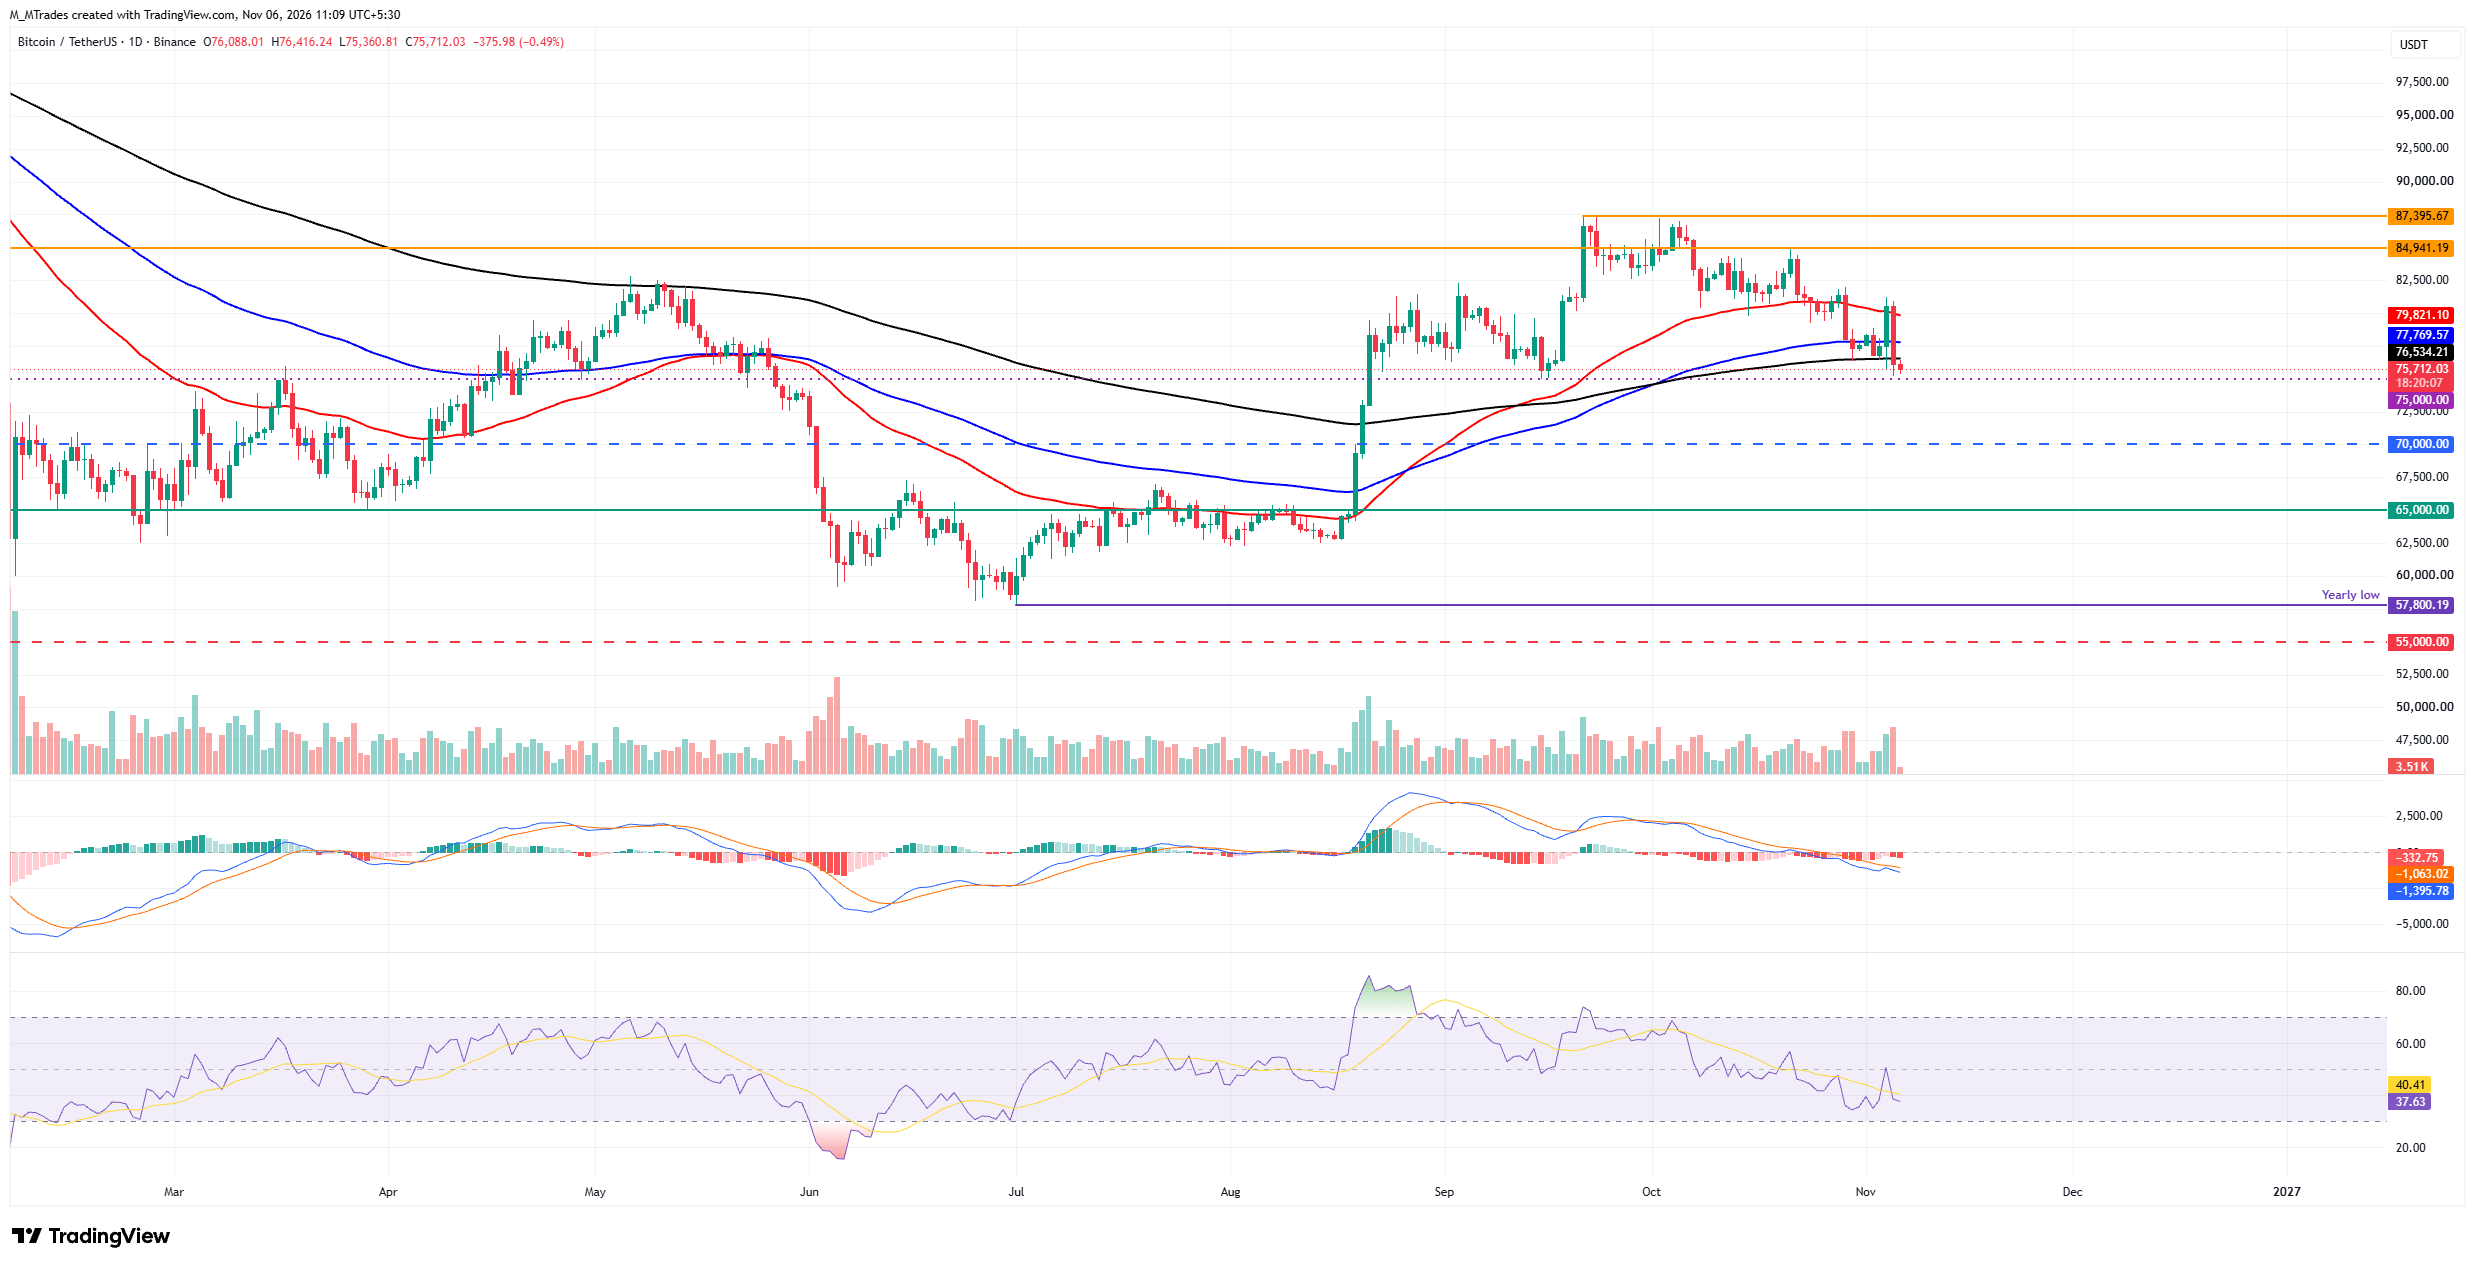
Major political developments can provoke exceptionally volatile market reactions. As election results began emerging in Wednesday’s early Asian session, Bitcoin (BTC) briefly slid towards the mid-$75,000s. Greater clarity subsequently helped it recover to close above $80,500, recording a gain of nearly 4% for the day.
Yet this price level proved unsustainable as selling pressure returned on Thursday, with investors concerned that Democratic control of both chambers of the US Congress could bring stricter cryptocurrency and Artificial Intelligence (AI) regulations. A steep decline in US technology shares on Thursday wiped out BTC’s recent advance. The Crypto King lost 5.49%, ending below support at the 200-day Exponential Moving Average (EMA), around $76,534.
Technical momentum is deteriorating as well. At around 37, the daily Relative Strength Index (RSI) is heading lower towards oversold territory, signalling a strong bearish trend. Reinforcing that negative outlook for BTC, the Moving Average Convergence Divergence (MACD) remains below zero while its red histogram bars continue to grow.
Friday has brought further losses for BTC, which is trading below $75,800 at the time of writing.
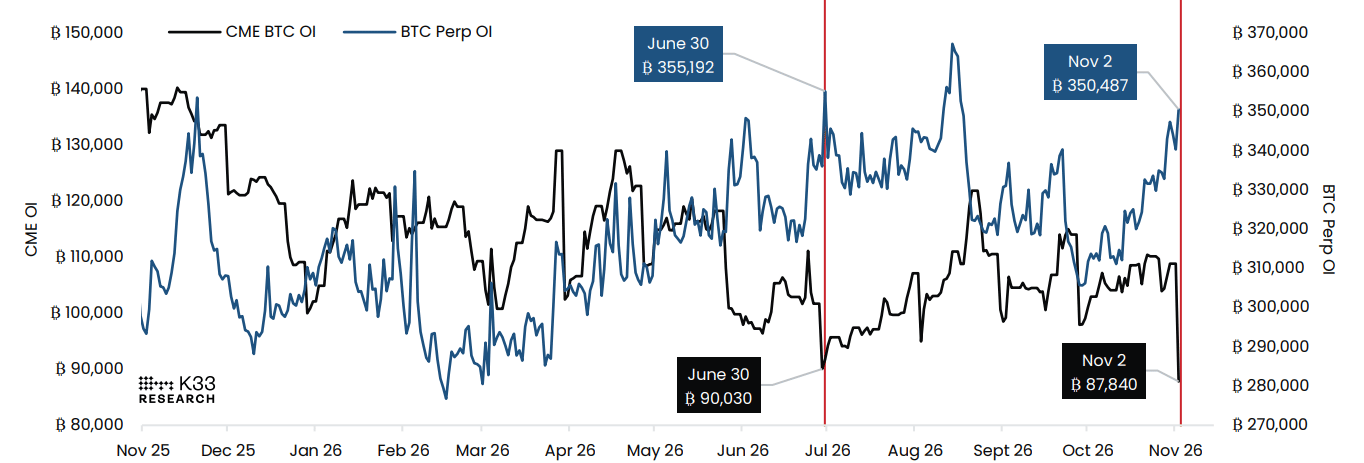
A sharp post-midterm swing in either direction had been anticipated, considering the gap between positioning in Bitcoin’s Chicago Mercantile Exchange (CME) futures and perpetual (perp) futures, alongside three-month implied volatility trading close to historical lows.
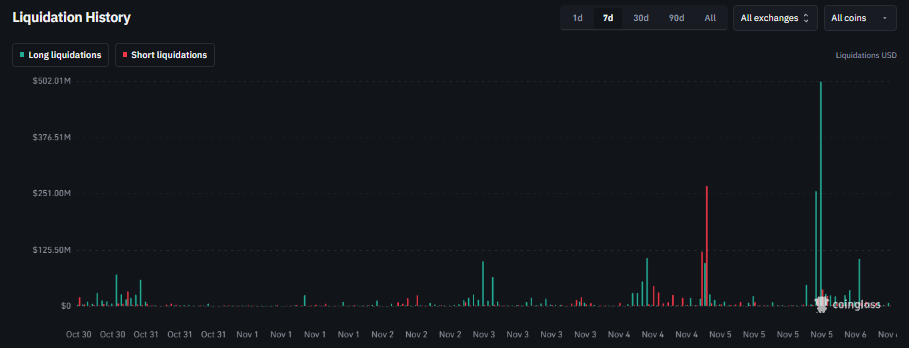
The crypto market recorded more than $2.25 billion in position liquidations during the US midterm elections. As the chart below illustrates, Wednesday’s recovery primarily liquidated shorts, whereas Thursday’s sell-off wiped out long positions. The liquidations point to a pronounced change in sentiment, underlining both uncertainty and the extent of leveraged positioning across the sector.
Could political gridlock support crypto?
Cryptocurrencies could, in fact, benefit from a policy stalemate in Washington. When Congress and the White House share power across political divides, risk assets face fewer sudden shocks from major policy surprises.
At the same time, Democratic control of the House and Senate presents a significant warning for the crypto sector. It could hold up or postpone key legislation affecting the industry, including the CLARITY Act.
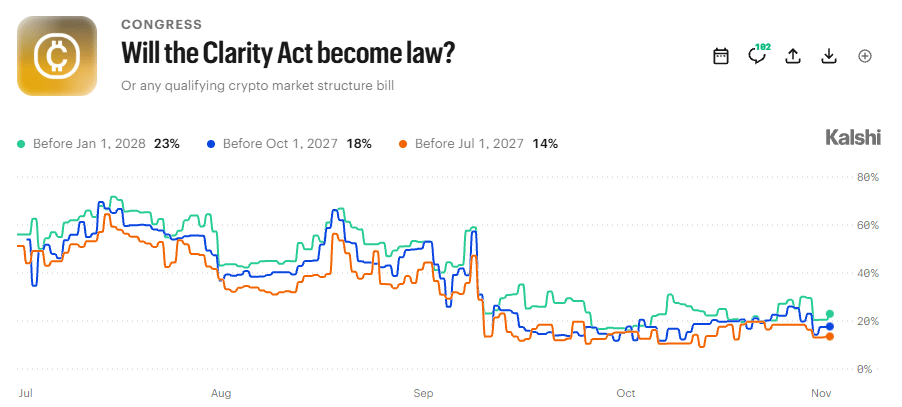
A more difficult route for industry-friendly legislation is already reflected in prediction markets such as Kalshi. The probability of the CLARITY Act passing before 1 July 2027 has declined to 14%, compared with 19% before the US midterm elections on 1 November.
Expectations have deteriorated across longer time frames too. During the same period, the probability of the CLARITY Act passing before 1 October 2027 fell from 27% to 18%, while the odds of passage before 1 January 2028 declined from 29% to 23%.
Does the Binance hack still pose a risk?
Beyond the election news, last week’s hack of Binance continues to linger in the background. Security worries persist even though midterm election coverage has dominated attention.
Binance has so far borne the entire financial impact and has restored 98% of affected users’ balances using its corporate treasury, SAFU fund and other internal resources.
Nevertheless, approximately $3 billion in stolen assets is still controlled by the attackers. Most of these holdings are in BTC and ETH, which are not easily frozen. Any renewed movement of these funds could trigger another bout of FUD (fear, uncertainty, and doubt) in the market.
Which factors could shape the crypto market now?
For the industry, the Democratic victory has increased uncertainty. Investors are weighing how a Democrat-controlled Congress could influence crypto and AI regulations when the new Congress assembles on 3 January 2027.
Even with Washington’s changed political landscape, crypto prices are likely to be influenced more by interest rate decisions, developments in the Middle East’s geopolitical situation, broader market liquidity and demand for Exchange Traded Funds (ETFs).
Understanding cryptocurrency metrics: FAQs
Each cryptocurrency’s developer or creator sets the total number of tokens that may be minted or issued. The algorithm underpinning its blockchain technology determines how many of these assets can be minted through mining, staking or other mechanisms. Circulating supply can also shrink, whether through token burning or the accidental transfer of assets to addresses on incompatible blockchains.
Multiplying an asset’s circulating supply by its current market value gives its market capitalisation.
For a given asset, trading volume measures the total number of tokens bought, sold or exchanged during a specified trading period, such as 24 hours. By combining volumes across centralised and decentralised exchanges, this metric helps assess market sentiment. A rise in trading volume often signals demand for an asset, as more participants buy and sell the cryptocurrency.
To encourage traders to take positions and keep perpetual contract prices aligned with spot markets, exchanges use funding rates. Through periodic payments, this mechanism helps futures prices and index prices converge regularly. A positive funding rate indicates that the perpetual contract trades above the mark price, so bullish traders holding long positions pay those holding short positions. Conversely, when the funding rate is negative, perpetual prices sit below the mark price and traders holding short positions pay those holding long positions.
POPULAR ARTICLES
1Pi Network Price Forecast: How is the market sell-off after US midterm elections weighing on PI?2Crypto Today: Reversal of post-midterm elections rally deepens losses in Bitcoin, Ethereum and XRP3How does a Democratic Congress affect Bitcoin and crypto
regulation?4Democrats win House and Senate in US midterms: Why might crypto still find positives?5Eurozone Retail Sales (YoY) below expectations (0.6%) in September: Actual (0.4%)6Eurozone Retail Sales (MoM) registered at -0.7%, below expectations (-0.1%) in September7ECB's Lane: Wage negotiations set to be shaped by energy inflation8Fed's Williams: Now Is an Appropriate Time to Gather More Information9Czech Koruna: CZK remains under pressure as CNB tightening stays limited - Commerzbank


Get Started!
Sign up and access the Global Markets in less than 3 minutes

Connect With Us









Contacts
Phone: +61 2 8036 8388
Fax: +61 2 8036 8388
Email: support@tmgm.com



The information provided on this website is of a general nature only and does not constitute personal financial advice. Before acting on any information on this website, you should consider the suitability of the information in relation to your objectives, financial situation and needs. Investing in CFDs and FX Margin Contracts carries significant risks and is not suitable for all investors. You may lose more than your initial deposit. You do not own, or have, any interest in the underlying asset. We recommend that you seek independent advice and ensure you fully understand the risks involved before trading. It is important that you read and consider the disclosure document before you acquire any product listed on the website. The information and advertisements offered on this website are not intended for use by any person in any country or jurisdiction where such use would be contrary to local laws and regulations. The Products and Services offered on this website are not intended for residents of the United States, Malaysia and Thailand.
TMGM is authorized and regulated in various jurisdictions.
Trademax Australia Limited, trading as TMGM, is regulated by the Australian Securities and Investments Commission (ASIC), AFSL no. 436416 and is located at Level 28, One International Tower, 100 Barangaroo Avenue, 2000 Sydney, NSW Australia.
Email: support@tmgm.com.au
Trademax Global Limited, trading as TMGM, is authorized and regulated by the Vanuatu Financial Services Commission (VFSC), registration number 40356 and registered at 1276, Kumul Highway, Port Vila, Vanuatu, Republic of Vanuatu.
Email: support@tmgm.com
Trademax Global Markets (SE) Limited, trading as TMGM, is authorized and regulated by the Financial Services Authority (FSA) of Seychelles, with license number SD224. The company is registered at Office No 13, Providence Estate ABIS Centre, Mahe, Seychelles.
Email: support@tmgm.com
Trademax Global Markets (International) Pty Ltd, trading as TMGM, is authorized and regulated by the Financial Services Commission, Mauritius (FSC) with license no. GB22201012, and registered at 33, Edith Cavell Street C/o IQ EQ Fund Services (Mauritius) Ltd Port Louis, 11324 Mauritius.
Email: support@tmgm.com
Copyright © TMGM. All rights reserved