

New Zealand GDP in the barrel with the Kiwi at July lows
- NZD/USD slides to its lowest since early July with New Zealand GDP just around the bend.
- Second-quarter growth is forecast at 0.1%, down from 0.8% in the first quarter.
New Zealand reports second-quarter growth later on Wednesday, or early on Thursday depending on where you are relative to the international date line, and the forecast is 0.1% for the quarter, down from 0.8% in the first three months of the year.

The annual figure is forecast to go the other way, to 2.3% from 1.5%, because the quarters it is measured against were weaker than the ones replacing them. So the same release will show growth stalling and growth picking up by most of a point, and both readings will be correct.

The growth figure reaches NZD/USD through the Reserve Bank of New Zealand (RBNZ), which took the Official Cash Rate (OCR) to 2.75% on September 2 with inflation at 4.1% and called the economy recovering. This is the first hard number behind that. The Fed raised its own rate to 3.75%-4.00% on Wednesday and pointed to another increase, which already leaves US rates more than a point above New Zealand's.
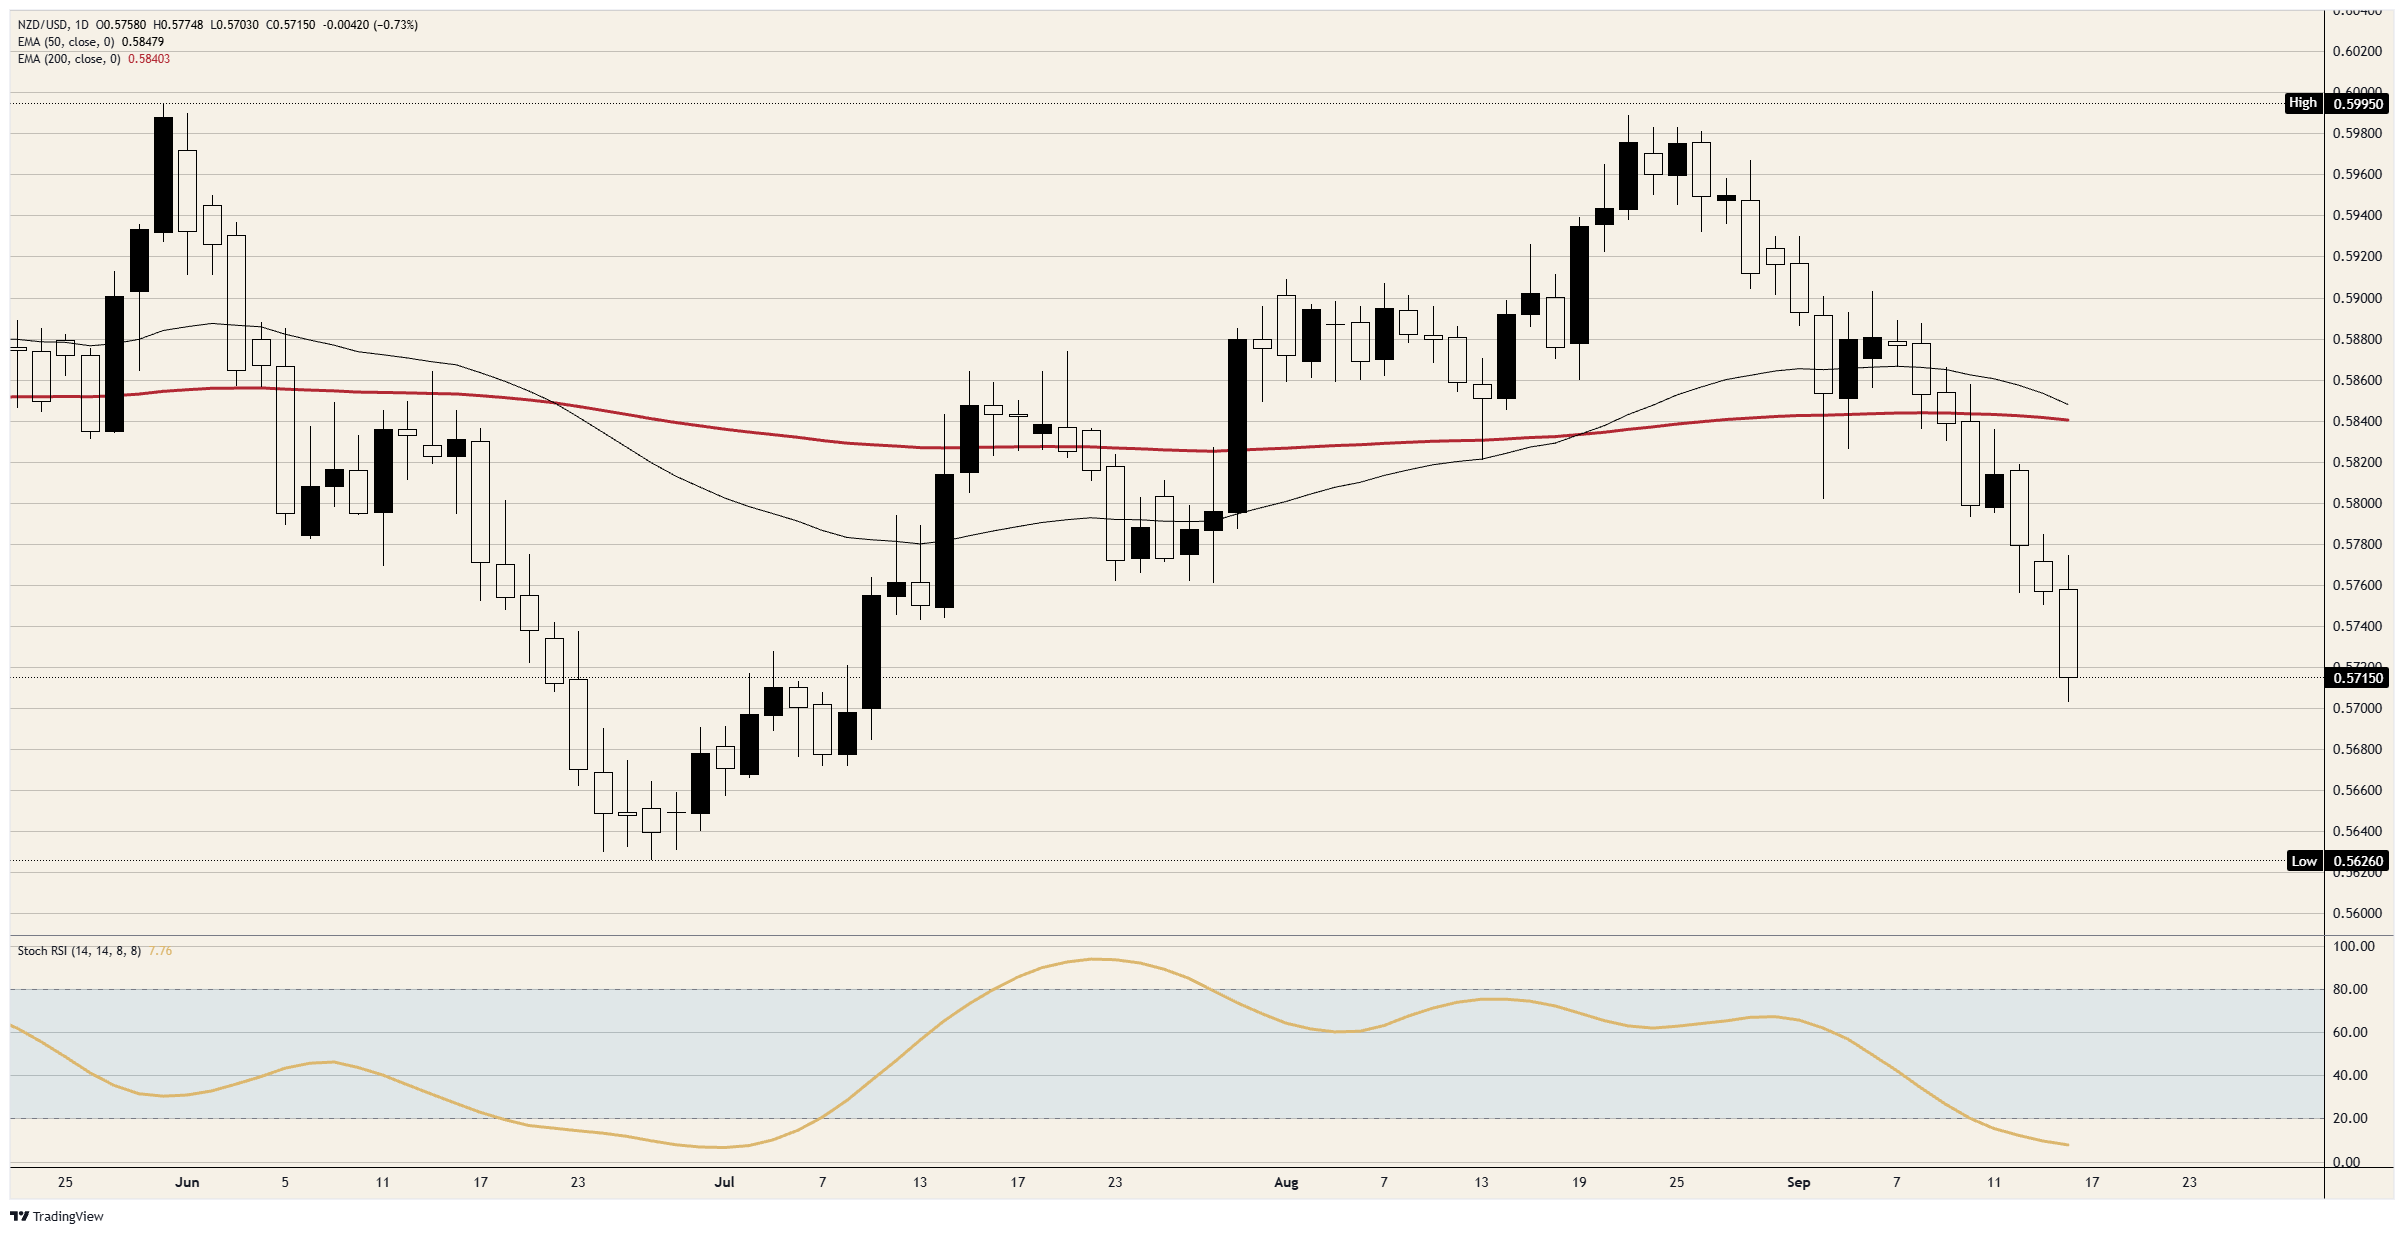
NZD/USD trades just above 0.5700, its lowest since early July, with the session high short of 0.5800. The slide runs from the late-August high just under 0.6000 and has been a series of lower highs since. The pair sits below both its 50-day and 200-day Exponential Moving Averages (EMA), which have converged near 0.5850 and which it has not traded above since early September.
The daily Stochastic Relative Strength Index (Stoch RSI), a momentum gauge, is at the bottom of its band, where it last sat during the June sell-off that took the pair to just above 0.5600.
NZD/USD daily chart
GDP FAQs
A country’s Gross Domestic Product (GDP) measures the rate of growth of its economy over a given period of time, usually a quarter. The most reliable figures are those that compare GDP to the previous quarter e.g Q2 of 2023 vs Q1 of 2023, or to the same period in the previous year, e.g Q2 of 2023 vs Q2 of 2022. Annualized quarterly GDP figures extrapolate the growth rate of the quarter as if it were constant for the rest of the year. These can be misleading, however, if temporary shocks impact growth in one quarter but are unlikely to last all year – such as happened in the first quarter of 2020 at the outbreak of the covid pandemic, when growth plummeted.
A higher GDP result is generally positive for a nation’s currency as it reflects a growing economy, which is more likely to produce goods and services that can be exported, as well as attracting higher foreign investment. By the same token, when GDP falls it is usually negative for the currency. When an economy grows people tend to spend more, which leads to inflation. The country’s central bank then has to put up interest rates to combat the inflation with the side effect of attracting more capital inflows from global investors, thus helping the local currency appreciate.
When an economy grows and GDP is rising, people tend to spend more which leads to inflation. The country’s central bank then has to put up interest rates to combat the inflation. Higher interest rates are negative for Gold because they increase the opportunity-cost of holding Gold versus placing the money in a cash deposit account. Therefore, a higher GDP growth rate is usually a bearish factor for Gold price.














