

Trading
Explore a wide range of markets with competitive pricing, deep liquidity, and advanced trading tools.
Learn More 
Platform
Trade seamlessly with TMGM's powerful platform, built for speed, precision, and a superior trading experience.
Learn More Trading Platform
Academy
Learn the fundamentals of trading with beginner-friendly resources, including guides, webinars, and market insights.
Learn More News & Analysis
Get real-time market updates and expert analysis to stay ahead of trading opportunities
Learn More News & Analysis
About
Learn what sets TMGM apart — our global presence, regulatory strength, and commitment to innovation in trading.
Learn More Why Choose TMGM
Sponsorship
Ripple Price Forecast: Why Is XRP Gaining Momentum Despite Investor Capital Outflows?
- Trading above the crucial $1.00 mark, XRP advances more than 2% on Wednesday.
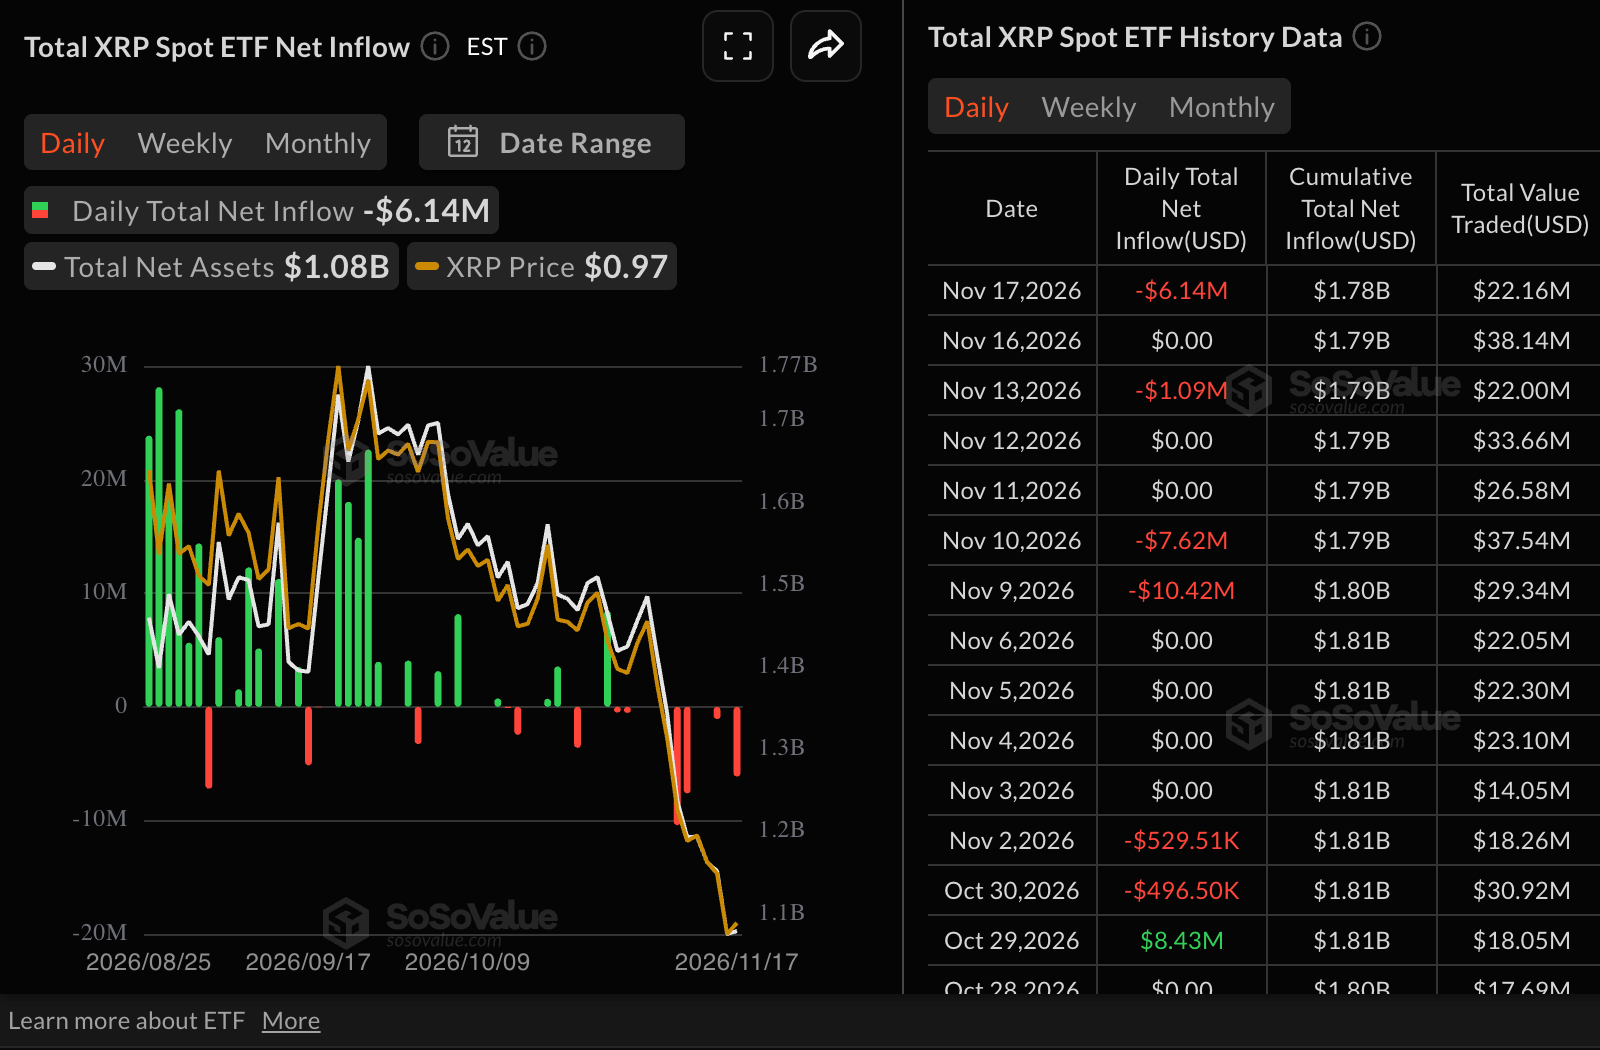
- Institutional investors pull back as US-listed XRP spot ETFs register outflows of $6 million on Tuesday.
- With momentum indicators backing a near-term rebound, XRP bulls seek a lasting break above $1.00.
Defying bearish sentiment across the wider crypto market, Ripple (XRP) advances towards $1.00 on Wednesday. The remittance token has gained over 2% on the day, following a steep sell-off that tested levels around $0.89, last seen in November 2024.

If XRP closes the day above $1.00, it could strengthen the case for the upside as the path of least resistance, increasing the likelihood of a sustained rebound towards the next crucial resistance level of $1.20.
Are rising XRP ETF outflows signalling weaker investor confidence?
Institutional demand remains subdued, with XRP spot Exchange-Traded Funds (ETFs) posting outflows of roughly $6 million on Tuesday. This followed quiet activity on the previous day and modest withdrawals of $1.1 million last Friday. Although the US-listed ETFs have been actively traded for one year, cumulative inflows total $1.78 billion, pointing to sluggish institutional adoption. Net assets under management of $1.08 billion further underscore the muted investor interest.
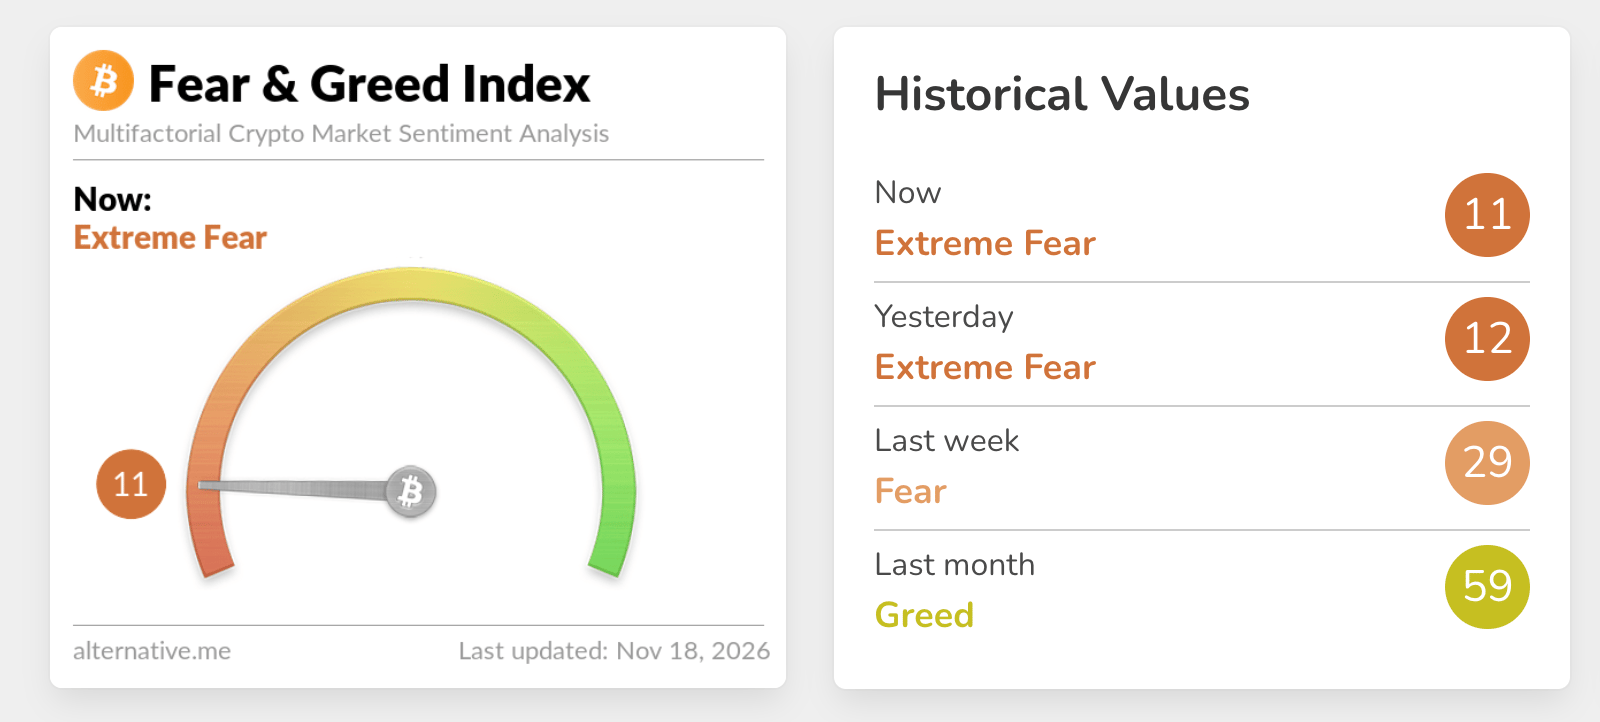
A further decline has taken the Fear & Greed Index to 11, leaving it in Extreme Fear territory after a marginal fall from the previous day’s reading of 12 in the same range. The readings point to a marked deterioration in risk appetite, putting demand for risk assets under pressure.
In a recent report, CryptoQuant said: “Demand is shrinking fast. Total demand growth is contracting at its fastest pace since July 1, led by spot buyers,”
Technical analysis: Can XRP sustain its gathering recovery momentum?
Despite trading near $1.00, XRP retains a bearish near-term structure. The pair is well below its 50-day, 100-day and 200-day Exponential Moving Averages (EMAs), at $1.21, $1.26 and $1.34, respectively. Together, these averages limit potential gains and highlight the prevailing downside bias.
Overhead pressure is also evident in the Parabolic SAR, which stands above the spot price at $1.02. Although the Relative Strength Index (RSI) has recovered from oversold levels to 33, it continues to signal weak demand. Meanwhile, a negative Moving Average Convergence Divergence (MACD) suggests that bearish momentum is subsiding only slowly.
The first upside hurdle is the Parabolic SAR near $1.02. Beyond it, a more significant set of dynamic resistance levels comprises the 50-day EMA at $1.21, the 100-day EMA at $1.26 and the longer-term 200-day EMA at $1.34. The broader downtrend is likely to remain intact unless buyers regain these EMAs and sustain prices above them. Indicators including the RSI and MACD suggest that attempts at a recovery may struggle to build lasting momentum.
(The technical analysis of this story was written with the help of an AI tool. Know more.)
Bitcoin, altcoins and stablecoins: Key questions answered
Ranked as the largest cryptocurrency by market capitalisation, Bitcoin is a virtual currency created to function as money. No single person, group or entity can control this payment method, removing the need for a third party to take part in financial transactions.
The term altcoin covers cryptocurrencies other than Bitcoin. However, some also exclude Ethereum, as these two cryptocurrencies are the ones from which forks originate. Under that interpretation, Litecoin would be the first altcoin: it was forked from the Bitcoin protocol and is therefore considered an “improved” version of it.
Designed to maintain a steady price, stablecoins are cryptocurrencies backed by reserves of the assets they represent. Each stablecoin is pegged to a commodity or financial instrument, such as the US Dollar (USD), while an algorithm or demand regulates its supply. Their primary purpose is to offer investors a route into and out of cryptocurrency trading and investment. Because cryptocurrencies are generally volatile, stablecoins also give investors a way to store value.
Measured as Bitcoin’s market capitalisation divided by the combined market capitalisation of all cryptocurrencies, Bitcoin dominance offers a clear indication of investor interest in Bitcoin. BTC dominance is typically high ahead of and during a bull run, when investors turn to relatively stable cryptocurrencies with large market capitalisations, such as Bitcoin. Conversely, declining BTC dominance generally signals that investors are shifting capital and/or profits into altcoins in pursuit of higher returns, often setting off a surge in altcoin rallies.
POPULAR ARTICLES
1Ripple Price Forecast: Why Is XRP Gaining Momentum Despite Investor Capital Outflows?2Brazilian Real: Can BRL withstand pressure from politics and commodities? - ING3Swedish Krona: How does currency performance shape the Riksbank’s path? – BNY4Can Australian Dollar sustain support near 0.6710 against US Dollar as outlook worsens?5Hungarian Forint: Why Is the MNB’s Dovish Stance Weighing on HUF Against the Euro? – Commerzbank6Pound Sterling Price News and Forecast: Why is GBP falling further as UK consumer inflation growth slows?7Why is the Swiss Franc sinking on monetary policy divergence as Fed minutes take centre stage?8British Pound: Is the inflation spike viewed as contained? – MUFG9Rising Fed rate hike bets send gold tumbling to its lowest in over a year


Get Started!
Sign up and access the Global Markets in less than 3 minutes

Connect With Us









Contacts
Phone: +61 2 8036 8388
Fax: +61 2 8036 8388
Email: support@tmgm.com



The information provided on this website is of a general nature only and does not constitute personal financial advice. Before acting on any information on this website, you should consider the suitability of the information in relation to your objectives, financial situation and needs. Investing in CFDs and FX Margin Contracts carries significant risks and is not suitable for all investors. You may lose more than your initial deposit. You do not own, or have, any interest in the underlying asset. We recommend that you seek independent advice and ensure you fully understand the risks involved before trading. It is important that you read and consider the disclosure document before you acquire any product listed on the website. The information and advertisements offered on this website are not intended for use by any person in any country or jurisdiction where such use would be contrary to local laws and regulations. The Products and Services offered on this website are not intended for residents of the United States, Malaysia and Thailand.
TMGM is authorized and regulated in various jurisdictions.
Trademax Australia Limited, trading as TMGM, is regulated by the Australian Securities and Investments Commission (ASIC), AFSL no. 436416 and is located at Level 28, One International Tower, 100 Barangaroo Avenue, 2000 Sydney, NSW Australia.
Email: support@tmgm.com.au
Trademax Global Limited, trading as TMGM, is authorized and regulated by the Vanuatu Financial Services Commission (VFSC), registration number 40356 and registered at 1276, Kumul Highway, Port Vila, Vanuatu, Republic of Vanuatu.
Email: support@tmgm.com
Trademax Global Markets (SE) Limited, trading as TMGM, is authorized and regulated by the Financial Services Authority (FSA) of Seychelles, with license number SD224. The company is registered at Office No 13, Providence Estate ABIS Centre, Mahe, Seychelles.
Email: support@tmgm.com
Trademax Global Markets (International) Pty Ltd, trading as TMGM, is authorized and regulated by the Financial Services Commission, Mauritius (FSC) with license no. GB22201012, and registered at 33, Edith Cavell Street C/o IQ EQ Fund Services (Mauritius) Ltd Port Louis, 11324 Mauritius.
Email: support@tmgm.com
Copyright © TMGM. All rights reserved