

Trading
Explore a wide range of markets with competitive pricing, deep liquidity, and advanced trading tools.
Learn More 
Platform
Trade seamlessly with TMGM's powerful platform, built for speed, precision, and a superior trading experience.
Learn More Trading Platform
Academy
Learn the fundamentals of trading with beginner-friendly resources, including guides, webinars, and market insights.
Learn More News & Analysis
Get real-time market updates and expert analysis to stay ahead of trading opportunities
Learn More News & Analysis
About
Learn what sets TMGM apart — our global presence, regulatory strength, and commitment to innovation in trading.
Learn More Why Choose TMGM
Sponsorship
Solana Price Forecast: Why do persistent ETF outflows prolong downside risk for SOL?
- Selling pressure keeps Solana below $90 on Monday after an 8% fall last week breached a key support level and marked its fifth successive weekly loss.
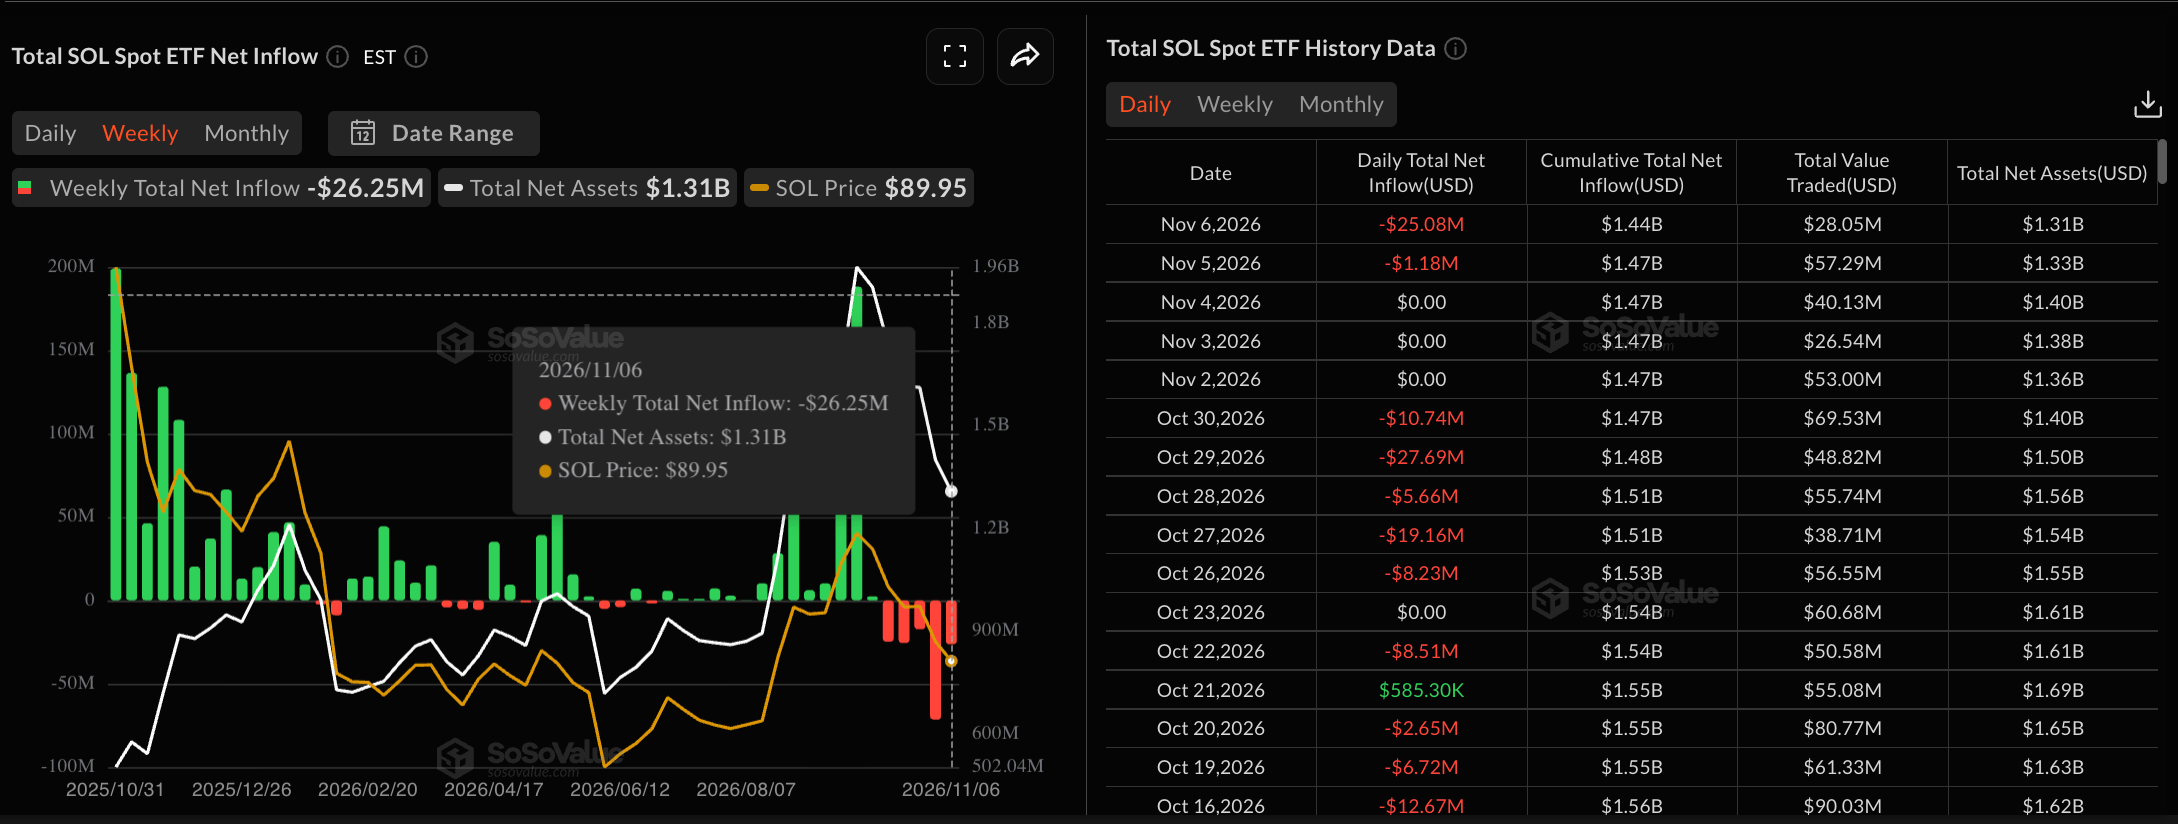
- Selling pressure on SOL-focused ETFs extended into a fifth consecutive week, with outflows exceeding $26 million last week.
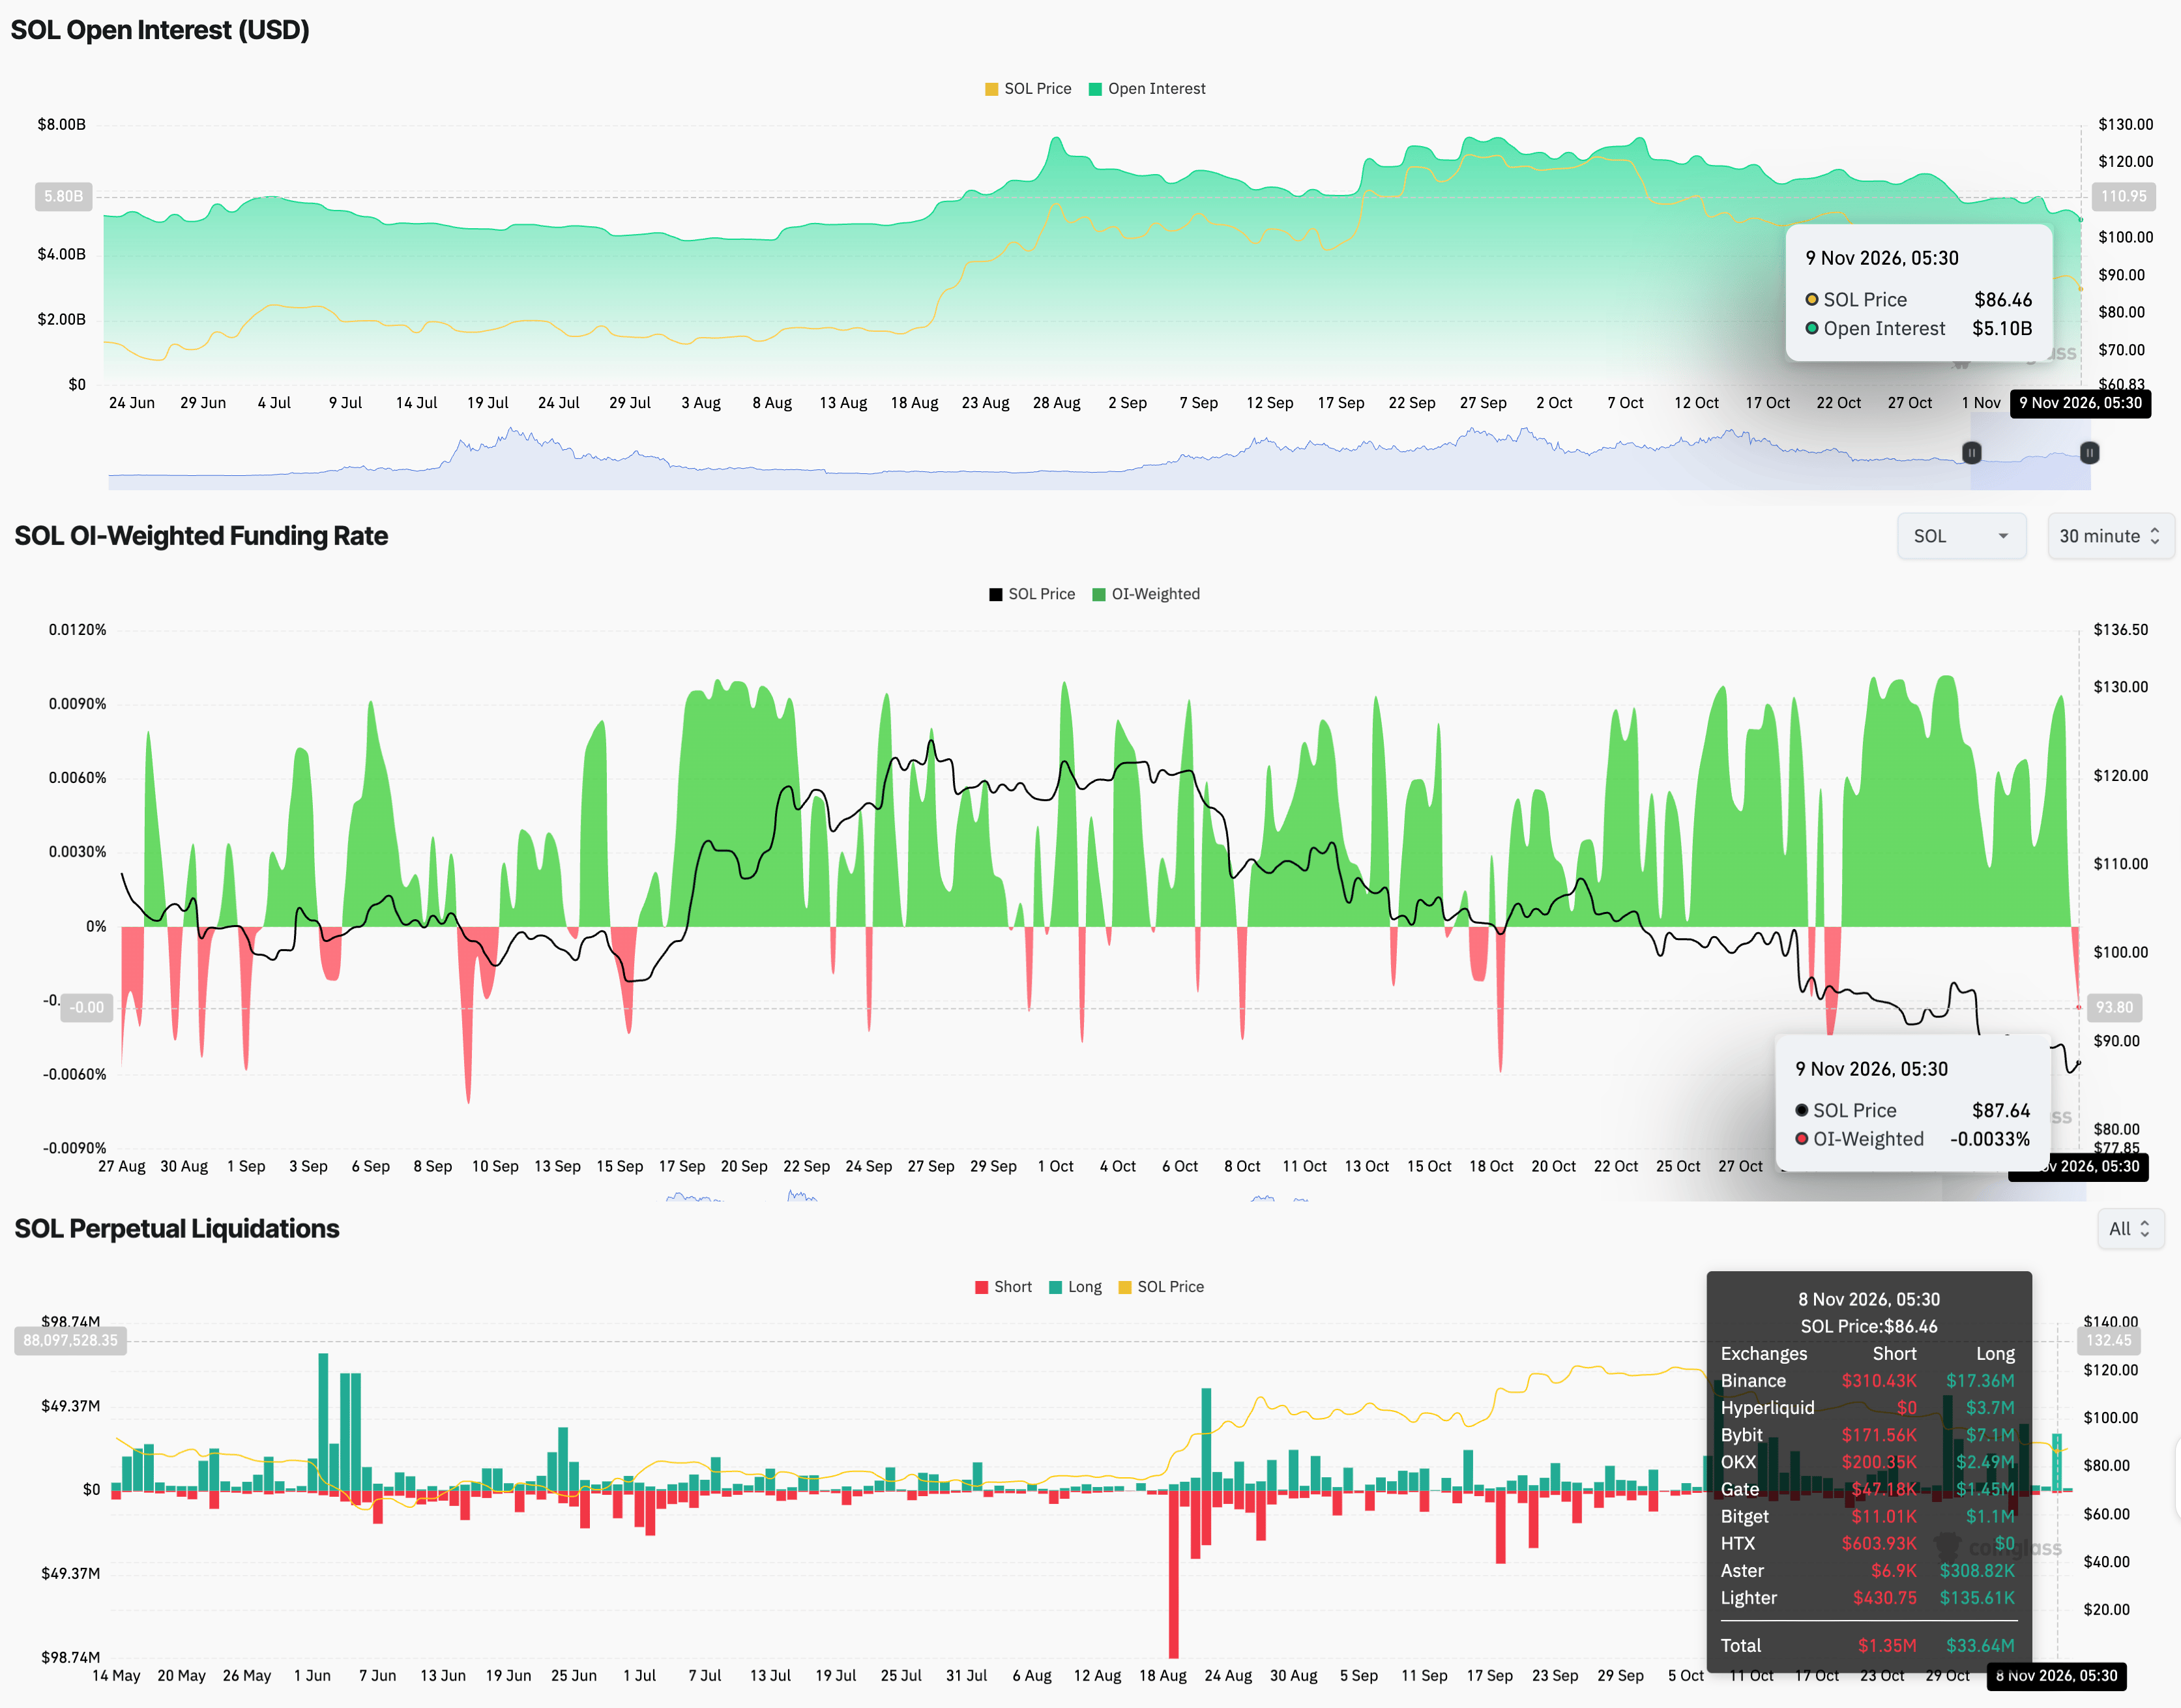
- Retail interest appears to be fading as SOL futures Open Interest and funding rates retreat.
Persistent selling keeps Solana (SOL) below $90 on Monday, although the token is edging higher after losing over 3% and slipping beneath a long-term support trendline the previous day. The decline over the past five weeks has coincided with five consecutive weeks of outflows totalling over $150 million from Solana-focused Exchange-Traded Funds (ETFs). Retail participation is also weakening: sustained position unwinding has pushed Open Interest to a two-month low, while a negative funding rate reinforces the continuing bias towards selling.

With selling pressure continuing, the technical picture points to a risk of Solana falling towards $77.
Do ETF outflows and falling Open Interest signal more SOL weakness?
ETF redemptions and shrinking Open Interest (OI) are among several bearish indicators pointing to further downside risk for Solana. SoSoValue data shows nearly $170 million flowed out of Solana ETFs over the past five weeks. This includes $26.25 million last week and the largest weekly withdrawal of $71.47 million in the previous month. Against a backdrop of wider market uncertainty, these substantial redemptions indicate weakening institutional demand for Solana.
Meanwhile, SOL futures OI stands at $5.10 billion on Monday, according to CoinGlass, its lowest level since August 19. Positions have been steadily unwound from the October 8 peak of $7.62 billion. The reduction in positions has accompanied falling spot prices and ETF withdrawals, suggesting that ETF outflows are the principal driver of the continuing correction. A return to weekly ETF inflows could signal a possible trend reversal for traders awaiting a SOL rebound.
A funding rate of -0.0033%, however, points to a near-term preference for selling, with traders prepared to pay a premium to take short positions. Sunday's $33.64 million in long liquidations also exceeded short liquidations of $1.35 million, underscoring the greater selling pressure.
Technical outlook: Can SOL hold above $80?
At the time of writing on Monday, Solana is quoted at $87.60, with the steady downtrend dating back to early October still intact. Last week's 8% fall extended October's 19% decline, taking SOL beneath both the 200-day Exponential Moving Average (EMA) at $99.26 and a long-term rising trendline near $90.41 that links the June 6 and August 1 lows. Meanwhile, the falling 50-day EMA at $100.35 is at risk of moving below the 200-day EMA. Such a crossover, commonly known as a death cross, would confirm a bearish trend reversal.
Daily momentum indicators continue to show weakness. The Relative Strength Index (RSI) is close to oversold territory at 29, while the Moving Average Convergence Divergence (MACD) remains negative. Together, they suggest that selling pressure has yet to run its course despite the stretched conditions.
The nearest downside support lies just below the current price, at the horizontal level of $87.46, followed by a more significant demand zone around $77.60. A sustained breach of that zone would bring $67.50 and $60.13 into focus as deeper support levels, where the base of the broader uptrend from earlier months converges.
For any recovery, the first resistance lies near $90.41 at the broken trendline, with the horizontal barrier at $95.82 next.
(An AI tool assisted in preparing the technical analysis for this story. Learn more.)
POPULAR ARTICLES
1EUR/USD Price Forecast: Bearish bias persists below 100-day SMA despite gains above 1.11502Solana Price Forecast: Why do persistent ETF outflows prolong downside risk for SOL?3Bitcoin Price Forecast: Can BTC withstand pressure as weekly ETF outflows reach $1.28 billion?4Taiwan’s Taiex leads Asian stock market recovery after AI-led sell-off5How is the Fed’s hawkish outlook lifting USD/CHF and weighing on the Swiss Franc?6Japan Leading Economic Index below expectations (116.7) in September: Actual (116.4)7Japan Coincident Index: 119.5 (September) vs 118.88EUR/JPY Price Forecast: Why does a downside bias persist below the 100-day SMA despite gains holding above 176.50?9India Gold price today: FXStreet data shows Gold moving higher


Get Started!
Sign up and access the Global Markets in less than 3 minutes

Connect With Us









Contacts
Phone: +61 2 8036 8388
Fax: +61 2 8036 8388
Email: support@tmgm.com



The information provided on this website is of a general nature only and does not constitute personal financial advice. Before acting on any information on this website, you should consider the suitability of the information in relation to your objectives, financial situation and needs. Investing in CFDs and FX Margin Contracts carries significant risks and is not suitable for all investors. You may lose more than your initial deposit. You do not own, or have, any interest in the underlying asset. We recommend that you seek independent advice and ensure you fully understand the risks involved before trading. It is important that you read and consider the disclosure document before you acquire any product listed on the website. The information and advertisements offered on this website are not intended for use by any person in any country or jurisdiction where such use would be contrary to local laws and regulations. The Products and Services offered on this website are not intended for residents of the United States, Malaysia and Thailand.
TMGM is authorized and regulated in various jurisdictions.
Trademax Australia Limited, trading as TMGM, is regulated by the Australian Securities and Investments Commission (ASIC), AFSL no. 436416 and is located at Level 28, One International Tower, 100 Barangaroo Avenue, 2000 Sydney, NSW Australia.
Email: support@tmgm.com.au
Trademax Global Limited, trading as TMGM, is authorized and regulated by the Vanuatu Financial Services Commission (VFSC), registration number 40356 and registered at 1276, Kumul Highway, Port Vila, Vanuatu, Republic of Vanuatu.
Email: support@tmgm.com
Trademax Global Markets (SE) Limited, trading as TMGM, is authorized and regulated by the Financial Services Authority (FSA) of Seychelles, with license number SD224. The company is registered at Office No 13, Providence Estate ABIS Centre, Mahe, Seychelles.
Email: support@tmgm.com
Trademax Global Markets (International) Pty Ltd, trading as TMGM, is authorized and regulated by the Financial Services Commission, Mauritius (FSC) with license no. GB22201012, and registered at 33, Edith Cavell Street C/o IQ EQ Fund Services (Mauritius) Ltd Port Louis, 11324 Mauritius.
Email: support@tmgm.com
Copyright © TMGM. All rights reserved