

Trading
Explore a wide range of markets with competitive pricing, deep liquidity, and advanced trading tools.
Learn More 
Platform
Trade seamlessly with TMGM's powerful platform, built for speed, precision, and a superior trading experience.
Learn More Trading Platform
Academy
Learn the fundamentals of trading with beginner-friendly resources, including guides, webinars, and market insights.
Learn More News & Analysis
Get real-time market updates and expert analysis to stay ahead of trading opportunities
Learn More News & Analysis
About
Learn what sets TMGM apart — our global presence, regulatory strength, and commitment to innovation in trading.
Learn More Why Choose TMGM
Sponsorship
US Dollar Index Price Forecast: Is This the Lull Before the Next Bullish Move?
- The US Dollar remains on the back foot as markets await October’s US CPI release.
- Fresh military strikes on Iran are highly unlikely, US President Trump indicates.
- The decline in oil prices continues to weigh on the US Dollar.
Selling pressure persists across the US Dollar (USD) against its peers as hopes of a United States (US)-Iran agreement drive oil prices lower.
With the previous day’s losses intact, the US Dollar Index (DXY) hovers near 101.67 during Tuesday’s European session. The index measures the Greenback against six major currencies. At the same time, WTI Oil has slipped to a fresh 10-week low of around $84.20.

A softer stance from Washington over the weekend has lifted investor optimism, MUFG analysts said in a note. They pointed to President Donald Trump’s remarks to CNN that it is “highly unlikely” he will have to authorise further military strikes on Iran, provided talks continue to make progress.
Even so, the quality of any agreement remains decisive, MUFG warned, noting that US President Trump also said “it depends on whether or not they sign a very strong agreement,” a qualification the bank considers essential to sustaining the recent decline in geopolitical risk premia.
As oil prices retreat, currencies of energy-exporting economies such as the US become less attractive.
Attention on the domestic calendar is centred on October’s US Consumer Price Index (CPI) figures, due at 13:30 GMT.
Could softer core CPI ease the Fed’s concerns over inflation spillovers?
Energy-price spillovers remain a key concern ahead of this week’s US inflation release. According to MUFG/BTMU analysts, both the Fed and market participants will scrutinise the data “closely for evidence of spillover effects from higher energy prices.” They observe that “recent core CPI readings have surprised to the upside over the last couple of months,” describing the consequence as “putting pressure on the Fed to tighten policy.” The near-term risk could nevertheless be easing, MUFG/BTMU suggest, given that “consensus expectations are looking for a softer core CPI print of 0.2%M/M in October,” leaving some room for inflation momentum to slow while policymakers continue to monitor the pass-through from energy costs.
US Dollar Index Technical Analysis: Is Another Bullish Move Ahead?
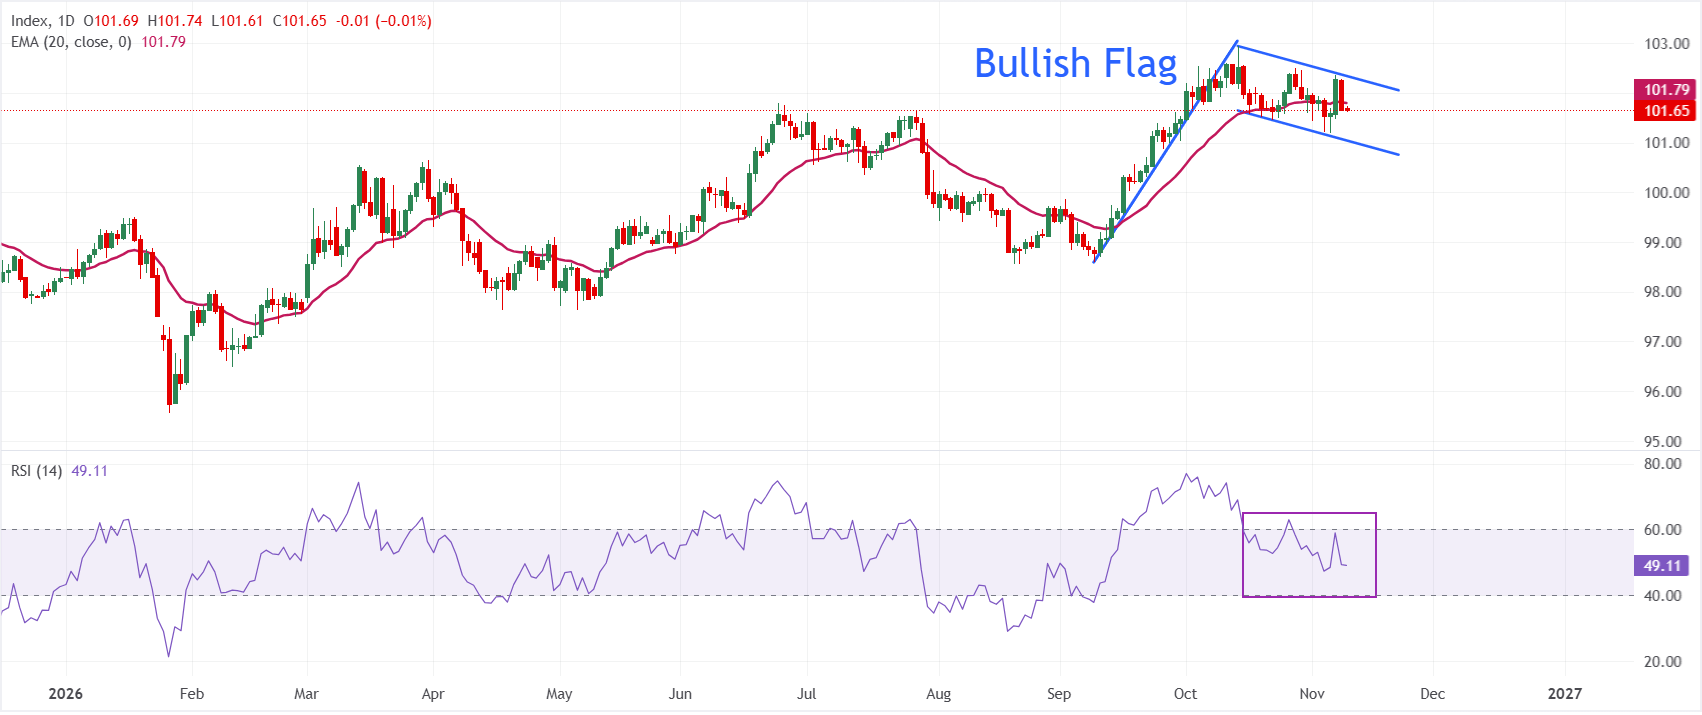
A neutral bias prevails on the daily chart, with Dollar Index Spot at 101.65, close to its 20-period exponential moving average (EMA) of 101.79.
At around 49, the Relative Strength Index (RSI) signals neutral momentum, offering little counterweight to the prevailing structural pressure.
A Bullish Flag chart pattern has formed, suggesting that the current neutral phase could precede another upward move, in keeping with the pattern’s historical behaviour.
For an advance, the first resistance lies at the 20-EMA near 101.79. Beyond that is the reclaimed trend-line area around 102.20, where sellers may attempt to preserve the broader corrective structure. If the index breaks above that structure, a return to its yearly high near 103.00 would become more likely.
(The technical analysis of this story was written with the help of an AI tool. Know more.)
US Dollar: Key Questions Answered
As the official currency of the United States of America, the US Dollar (USD) also serves as the ‘de facto’ currency in a significant number of other countries, circulating alongside their local banknotes. No currency is traded more widely: figures from 2022 show that it accounts for over 88% of global foreign exchange turnover, equivalent to average daily transactions of $6.6 trillion. The British Pound was displaced by the USD as the world’s reserve currency after the Second World War. Gold backed the US Dollar for most of its history, until the Gold Standard ended with the Bretton Woods Agreement in 1971.
Monetary policy set by the Federal Reserve (Fed) is the single biggest influence on the US Dollar’s value. Price stability, achieved by controlling inflation, and full employment form the Fed’s two mandates. Adjusting interest rates is its main means of pursuing both objectives. To support the USD, the Fed raises rates when prices climb too rapidly and inflation exceeds its 2% target. Conversely, inflation below 2% or an excessively high Unemployment Rate may prompt the Fed to cut interest rates, putting pressure on the Greenback.
When conditions become extreme, the Federal Reserve may create additional Dollars through quantitative easing (QE), substantially expanding the supply of credit to a financial system that has stalled. This unconventional policy is deployed when credit dries up as banks stop lending to one another for fear of counterparty default. It serves as a last resort if interest-rate cuts alone are unlikely to deliver the required outcome. During the Great Financial Crisis in 2008, QE was the Fed’s preferred response to the credit crunch. Under this process, the Fed prints more Dollars to purchase US government bonds, mainly from financial institutions. The usual effect of QE is a weaker US Dollar.
By contrast, quantitative tightening (QT) involves the Federal Reserve ending bond purchases from financial institutions and allowing its existing bonds to mature without reinvesting the principal in further purchases. This process generally supports the US Dollar.
POPULAR ARTICLES
1US Dollar Index Price Forecast: Further gains towards 104.00 appear likely2USD/CAD Price Forecast: Positive bias holds above 100-day SMA as pair climbs beyond 1.42503Injective Price Forecast: Can long-term trendline support withstand intensifying selling pressure?4Can WTI Recover After Falling Below $85.00 Amid Ukraine Peace Talk Hopes and Oversupply Concerns?5Bitcoin Price Forecast: Can BTC withstand pressure as MSCI removes Strategy from global indices, putting billions in fund flows at risk?6With consumption lacking momentum, BoJ's Asada warns rate hikes could lower underlying inflation7Why is the Swiss Franc retaining gains against the US Dollar despite a hawkish Fed outlook?8USD/JPY Price Forecast: Consolidation Breakout Sets a Fresh Upside Leg in Motion9GBP/USD Price Forecast: Is the Pair Vulnerable Below 1.3300 Amid a Bullish USD Ahead of UK GDP?


Get Started!
Sign up and access the Global Markets in less than 3 minutes

Connect With Us









Contacts
Phone: +61 2 8036 8388
Fax: +61 2 8036 8388
Email: support@tmgm.com



The information provided on this website is of a general nature only and does not constitute personal financial advice. Before acting on any information on this website, you should consider the suitability of the information in relation to your objectives, financial situation and needs. Investing in CFDs and FX Margin Contracts carries significant risks and is not suitable for all investors. You may lose more than your initial deposit. You do not own, or have, any interest in the underlying asset. We recommend that you seek independent advice and ensure you fully understand the risks involved before trading. It is important that you read and consider the disclosure document before you acquire any product listed on the website. The information and advertisements offered on this website are not intended for use by any person in any country or jurisdiction where such use would be contrary to local laws and regulations. The Products and Services offered on this website are not intended for residents of the United States, Malaysia and Thailand.
TMGM is authorized and regulated in various jurisdictions.
Trademax Australia Limited, trading as TMGM, is regulated by the Australian Securities and Investments Commission (ASIC), AFSL no. 436416 and is located at Level 28, One International Tower, 100 Barangaroo Avenue, 2000 Sydney, NSW Australia.
Email: support@tmgm.com.au
Trademax Global Limited, trading as TMGM, is authorized and regulated by the Vanuatu Financial Services Commission (VFSC), registration number 40356 and registered at 1276, Kumul Highway, Port Vila, Vanuatu, Republic of Vanuatu.
Email: support@tmgm.com
Trademax Global Markets (SE) Limited, trading as TMGM, is authorized and regulated by the Financial Services Authority (FSA) of Seychelles, with license number SD224. The company is registered at Office No 13, Providence Estate ABIS Centre, Mahe, Seychelles.
Email: support@tmgm.com
Trademax Global Markets (International) Pty Ltd, trading as TMGM, is authorized and regulated by the Financial Services Commission, Mauritius (FSC) with license no. GB22201012, and registered at 33, Edith Cavell Street C/o IQ EQ Fund Services (Mauritius) Ltd Port Louis, 11324 Mauritius.
Email: support@tmgm.com
Copyright © TMGM. All rights reserved