

Trading
Explore a wide range of markets with competitive pricing, deep liquidity, and advanced trading tools.
Learn More 
Platform
Trade seamlessly with TMGM's powerful platform, built for speed, precision, and a superior trading experience.
Learn More Trading Platform
Academy
Learn the fundamentals of trading with beginner-friendly resources, including guides, webinars, and market insights.
Learn More News & Analysis
Get real-time market updates and expert analysis to stay ahead of trading opportunities
Learn More News & Analysis
About
Learn what sets TMGM apart — our global presence, regulatory strength, and commitment to innovation in trading.
Learn More Why Choose TMGM
Sponsorship
NEAR Protocol Price Forecast: NEAR rebounds on the launch of India’s biggest IPO, Jio Platforms perps
- NEAR Protocol edged higher on Wednesday, holding above its 50-day EMA after roughly a 3% rebound the previous day.
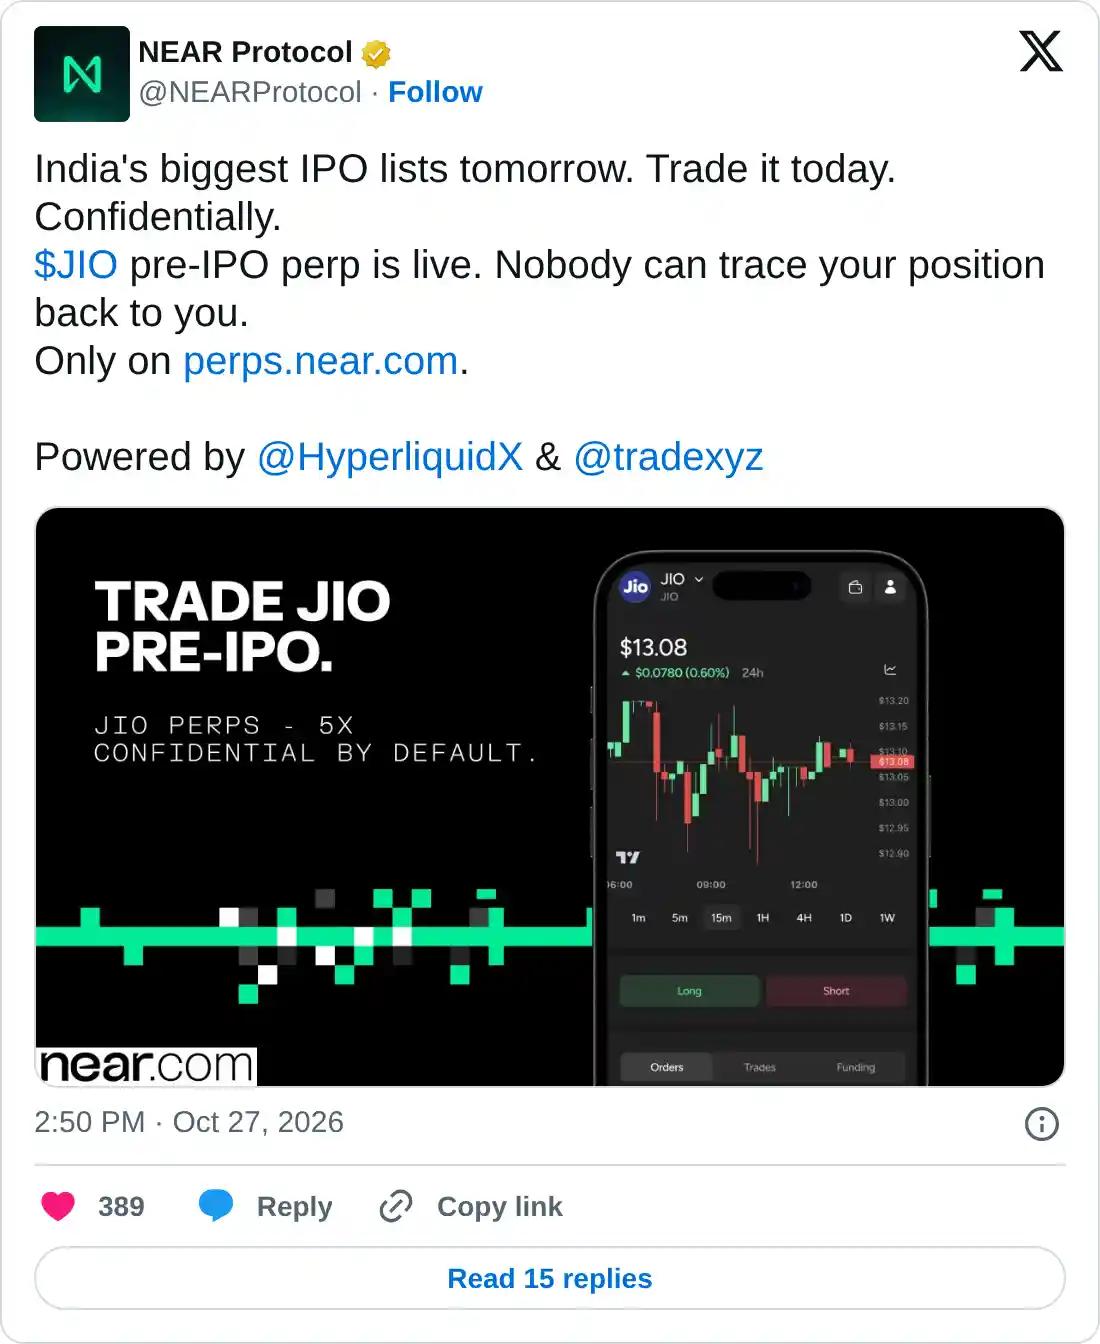
- NEAR Protocol launched India’s biggest IPO, Jio Platforms perpetual contracts ahead of its listing on Wednesday.
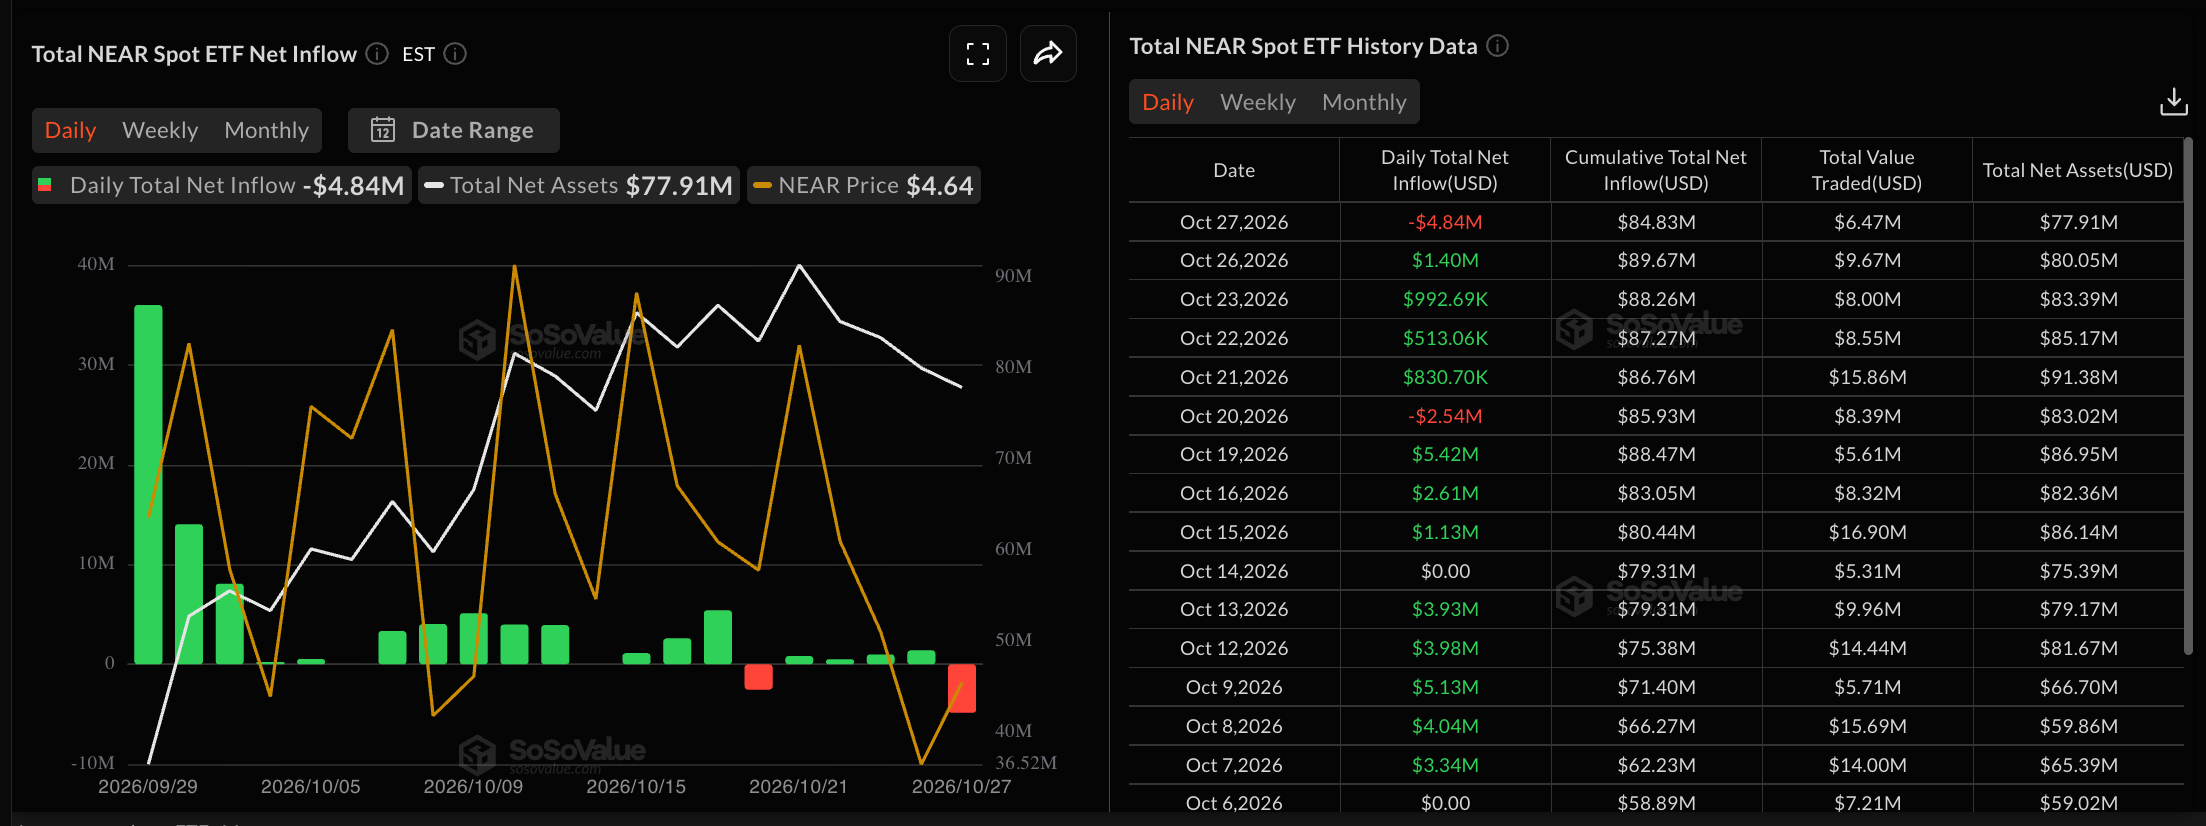
- NEAR-focused ETF recorded roughly $5 million in outflows on Tuesday, suggesting near-term profit-taking by institutional investors.
NEAR Protocol (NEAR) price ticks higher on Wednesday, extending its roughly 3% rebound from the previous day. NEAR Intents launched confidential trading of India’s biggest IPO, Jio Platforms, perpetual contracts on Tuesday. Institutional investors' activity shows mild profit-taking after nearly $5 million in outflows on Tuesday.

NEAR launches Jio Platforms perps but risks losing institutional demand
NEAR Protocol launched confidential perps of Jio Platforms, India’s biggest Initial Public Offering (IPO) by the Reliance Group, which will be listed on Wednesday. Confidential perps enable users to trade Jio stocks pre-listing without revealing their position.
NEAR-focused Exchange-Traded Fund (ETF) by Bitwise recorded $4.84 million in outflows on Tuesday, following $1.40 million in inflows the previous day. This shift implies that institutional investors are starting to book profits after four consecutive weeks of inflows.
Technical outlook: Will NEAR price reclaim $5?
NEAR Protocol trades at $4.72 at press time on Tuesday, holding above its 50-day Exponential Moving Average (EMA) at $4.33, keeping a constructive near-term tone. Meanwhile, the 200-day EMA at $2.89 sits well below, maintaining a broader uptrend structure despite the recent pullback from the October 12 high at $6.00.
From a technical perspective, NEAR price consolidates above the 50-day EMA but remains capped below a downward trendline at $5.02. A confirmed breakout above this level could extend the recovery toward the September 27 high at $5.57.
Momentum is mixed on the daily chart, with the Relative Strength Index (RSI) hovering at 49, near the neutral zone, while the Moving Average Convergence Divergence (MACD) line remains below the signal line and slopes downward, suggesting that buying pressure is moderating.
Looking down, the first area of protection is the cluster of the September 25 low at $4.43 ahead of firmer support at the 50-day EMA at $4.33. Deeper pullbacks could test the September 19 high at $3.91.
(The technical analysis of this story was written with the help of an AI tool. Know more.)
Top Articles
1Indian Rupee is under pressure ahead of Fed’s monetary policy2Euro: Downtrend targets 1.1095 support against US Dollar – UOB3British Pound declines ahead of UK Finance Minister Healey's budget4EUR/USD Price Forecast: Softens below 1.1150, bearish bias intact below key moving averages5Zcash Price Forecast: Bullish momentum mounts on steady ETF inflows, retail confidence6Pepe Price Forecast: PEPE climbs as Justin Sun-linked wallets spark bullish sentiment7AUD/USD Price Forecast: Trims hot Aussie CPI-led gains; holds above 0.7000 ahead of Fed8Swiss Franc weakens as US Dollar gains ahead of Fed policy decision9United States Dollar Index strengthens to near 102.50, Fed rate decision looms
LIVE QUOTES

ALL ABOUT TECHNICAL
Trailing Stop: What It Is, How It Works and How to Use It
What Are Reversal Patterns and How Do You Trade Them?
What Is a Continuation Pattern? Definition, Types and Trading Strategies
Market Maker Model (MMXM): How the ICT Buy and Sell Models Work
Breaker Block in Trading: What It Is and How to Trade It
Elliott Wave Theory: Patterns, Rules and How Traders Use It
Smart Money Concept (SMC): What It Is and How to Trade It
Order Block in Trading: What It Is and How to Trade It
Average True Range (ATR) Indicator: Formula, How to Read It, and How to Use It
Get Started!
Sign up and access the Global Markets in less than 3 minutes

Connect With Us









Contacts
Phone: +61 2 8036 8388
Fax: +61 2 8036 8388
Email: support@tmgm.com



The information provided on this website is of a general nature only and does not constitute personal financial advice. Before acting on any information on this website, you should consider the suitability of the information in relation to your objectives, financial situation and needs. Investing in CFDs and FX Margin Contracts carries significant risks and is not suitable for all investors. You may lose more than your initial deposit. You do not own, or have, any interest in the underlying asset. We recommend that you seek independent advice and ensure you fully understand the risks involved before trading. It is important that you read and consider the disclosure document before you acquire any product listed on the website. The information and advertisements offered on this website are not intended for use by any person in any country or jurisdiction where such use would be contrary to local laws and regulations. The Products and Services offered on this website are not intended for residents of the United States, Malaysia and Thailand.
TMGM is authorized and regulated in various jurisdictions.
Trademax Australia Limited, trading as TMGM, is regulated by the Australian Securities and Investments Commission (ASIC), AFSL no. 436416 and is located at Level 28, One International Tower, 100 Barangaroo Avenue, 2000 Sydney, NSW Australia.
Email: support@tmgm.com.au
Trademax Global Limited, trading as TMGM, is authorized and regulated by the Vanuatu Financial Services Commission (VFSC), registration number 40356 and registered at 1276, Kumul Highway, Port Vila, Vanuatu, Republic of Vanuatu.
Email: support@tmgm.com
Trademax Global Markets (SE) Limited, trading as TMGM, is authorized and regulated by the Financial Services Authority (FSA) of Seychelles, with license number SD224. The company is registered at Office No 13, Providence Estate ABIS Centre, Mahe, Seychelles.
Email: support@tmgm.com
Trademax Global Markets (International) Pty Ltd, trading as TMGM, is authorized and regulated by the Financial Services Commission, Mauritius (FSC) with license no. GB22201012, and registered at 33, Edith Cavell Street C/o IQ EQ Fund Services (Mauritius) Ltd Port Louis, 11324 Mauritius.
Email: support@tmgm.com
Copyright © TMGM. All rights reserved