

การเทรด
สำรวจตลาดที่หลากหลายด้วยราคาที่แข่งขันได้ สภาพคล่องสูง และเครื่องมือการเทรดขั้นสูง
เรียนรู้เพิ่มเติม 
แพลตฟอร์ม
เทรดอย่างไร้รอยต่อกับแพลตฟอร์มอันทรงพลังของ TMGM ที่สร้างขึ้นเพื่อความรวดเร็ว แม่นยำ และประสบการณ์การเทรดที่เหนือกว่า
เรียนรู้เพิ่มเติม แพลตฟอร์มการเทรด
เครื่องมือการเทรด
สถาบัน
เรียนรู้พื้นฐานการเทรดด้วยแหล่งข้อมูลสำหรับผู้เริ่มต้น รวมถึงคู่มือ สัมมนาออนไลน์ และข้อมูลเชิงลึกตลาด
เรียนรู้เพิ่มเติม ข่าว & วิเคราะห์
รับข้อมูลอัปเดตตลาดแบบเรียลไทม์และบทวิเคราะห์จากผู้เชี่ยวชาญเพื่อคว้าโอกาสการเทรดก่อนใคร
เรียนรู้เพิ่มเติม ข่าว & วิเคราะห์
เกี่ยวกับ
เรียนรู้สิ่งที่ทำให้ TMGM โดดเด่น — การดำเนินงานทั่วโลก ความแข็งแกร่งด้านการกำกับดูแล และความมุ่งมั่นสู่การสร้างสรรค์นวัตกรรมในการเทรด
เรียนรู้เพิ่มเติม ทำไมต้องเลือก TMGM
Pi Network Price Forecast: PI declines further, risking fresh record lows
- Pi Network extends losses on Tuesday, following a roughly 7% decline the previous day.
- Crypto market sentiment deteriorates, weighing on community-driven tokens.
- The technical outlook for PI is bearish, with next support at the $0.0700 record low.
Pi Network (PI) price is trading in the red on Tuesday, extending losses after a 7% decline the previous day. The PI token faces intense downside pressure as broader crypto market sentiment deteriorates, risking a steeper decline below the record low of $0.0700.

Pi Network risks further downside as the crypto market sentiment declines
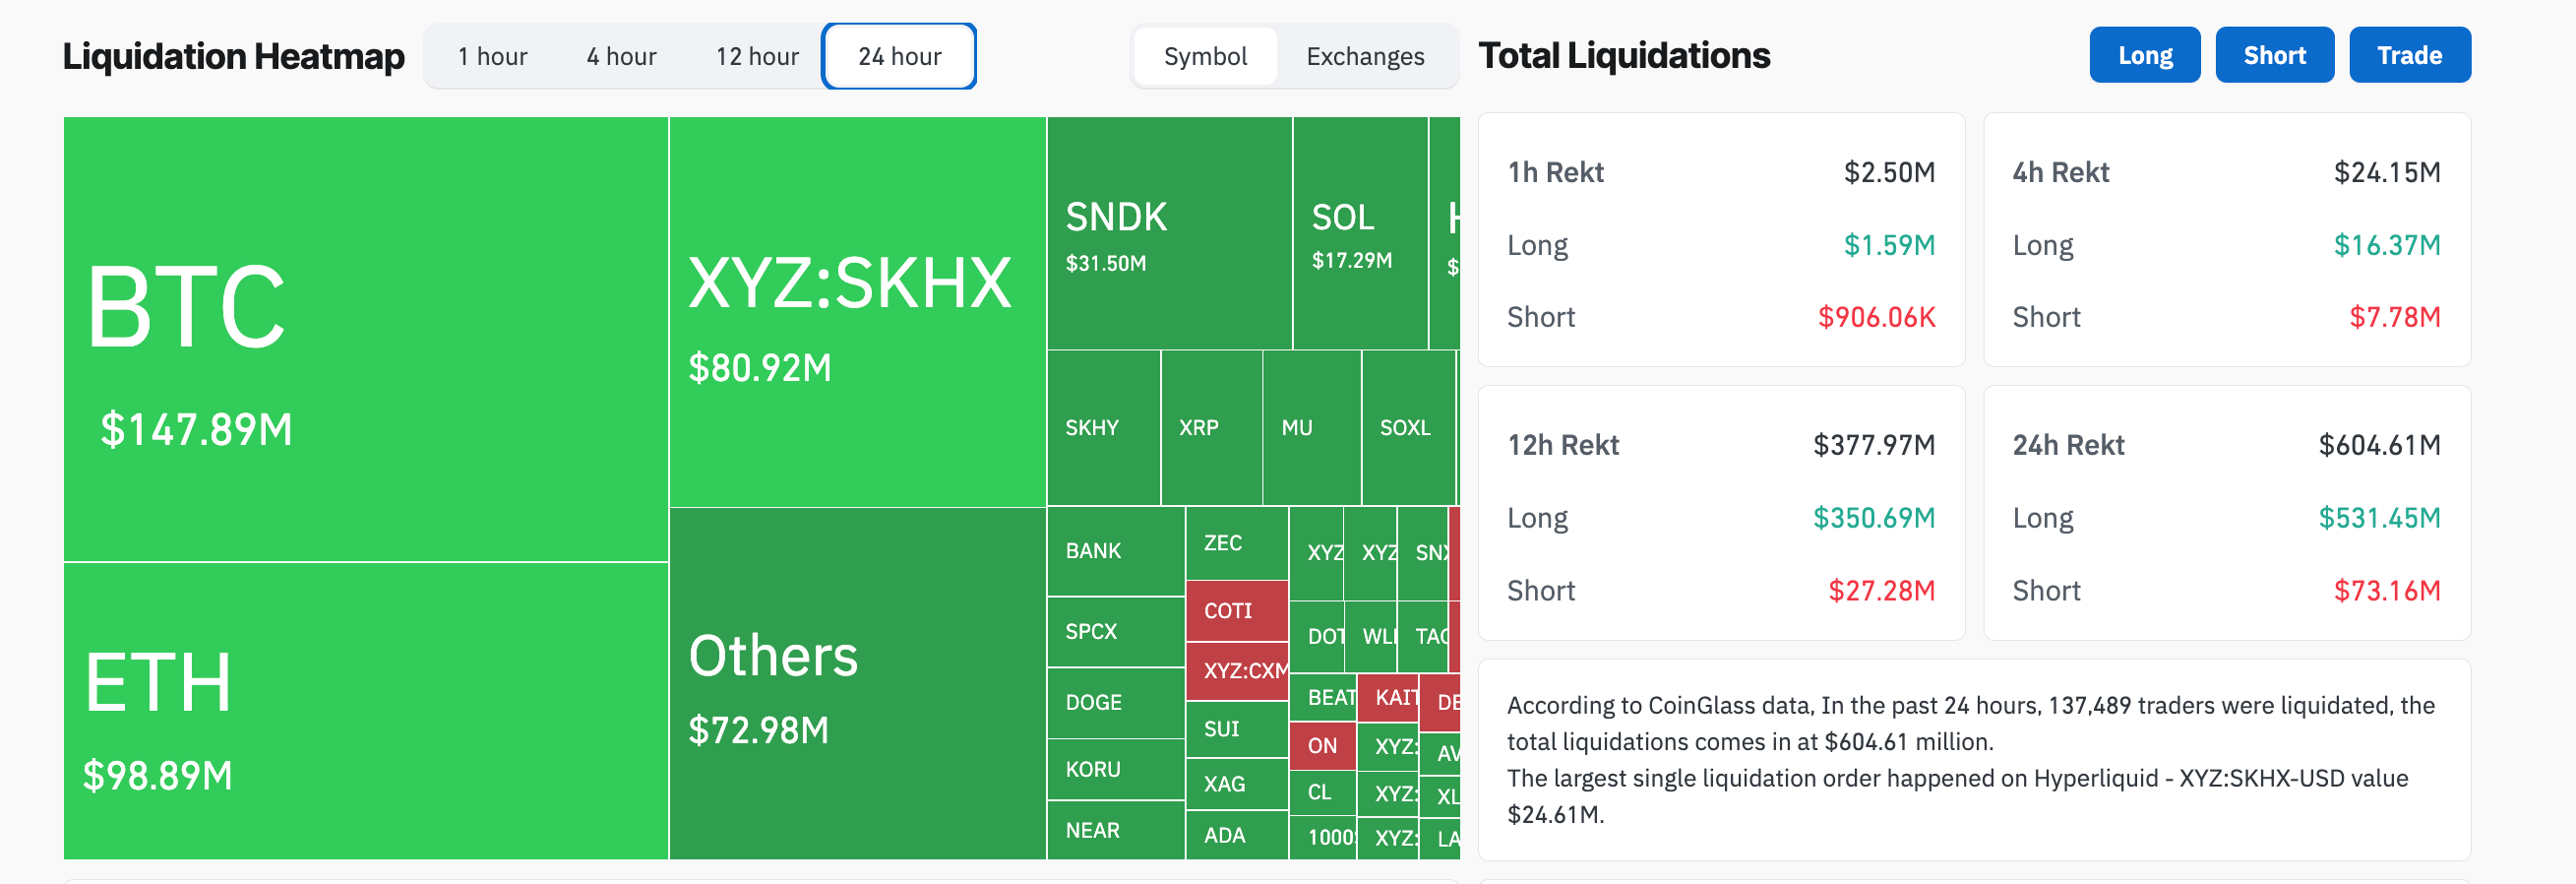
The broader crypto market faces renewed selling pressure this week. CoinGlass data shows $604 million in total liquidation, led by $531 million of long liquidation, reflecting a sell-side bias.
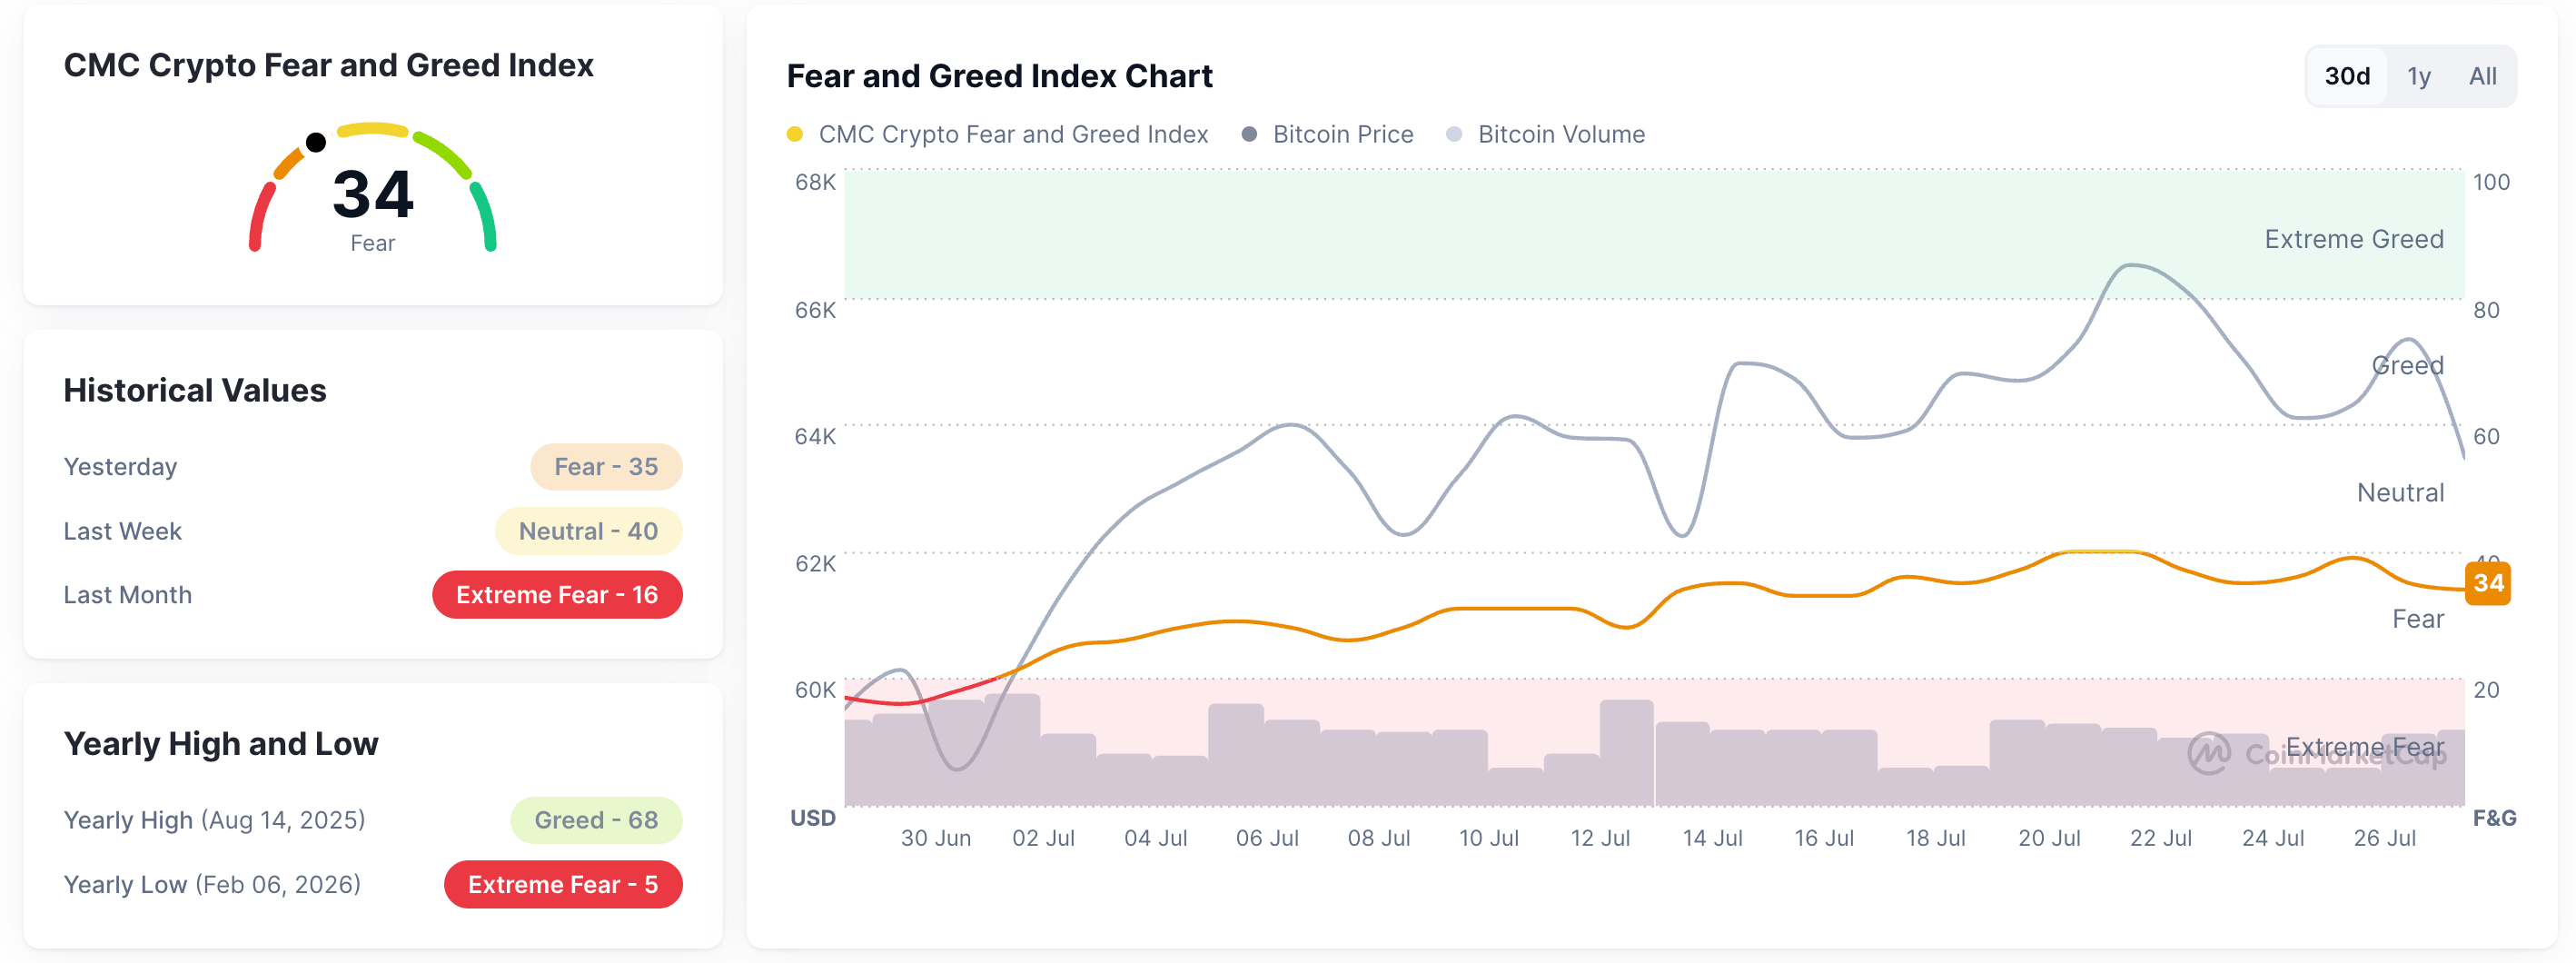
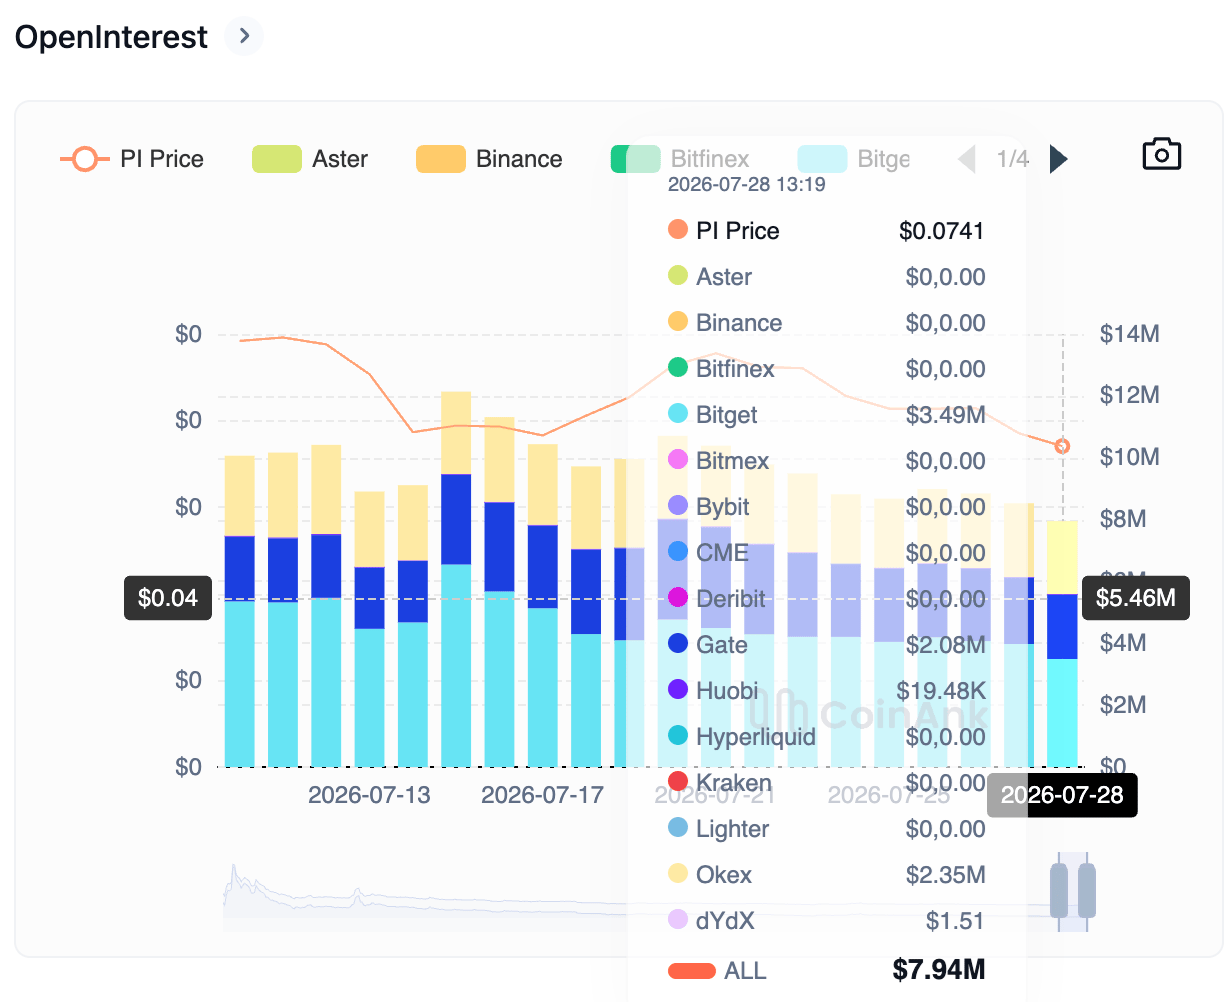
At the same time, CoinMarketCap’s Fear and Greed Index is at 34, down from 39 on Sunday as the market sentiment shifts risk-off from neutral. Given the strong correlation between the PI token and crypto market sentiment, risk-off conditions increase downside risk. CoinAnk data show a steady decline in PI Open Interest (OI) to $7.94 million, down from $12.14 million on July 15.
How low will Pi Network go?
Pi Network maintains a bearish near-term bias as price remains well below the 50- and 200-day Exponential Moving Averages (EMAs) at $0.1064 and $0.1719, respectively. From a technical perspective, PI has been trending downward within a falling channel pattern on the daily chart for roughly three months.
The PI token has shown a steady decline over the last week, approaching its recent low of $0.0700. A sustained close below this level could target the 200% Fibonacci extension level at $0.0368, measured from $0.1998 to $0.1183.
The Directional Movement Index shows a widening gap between the negative and positive DI lines, while the ADX line stabilizes near 39, hinting at renewed momentum.
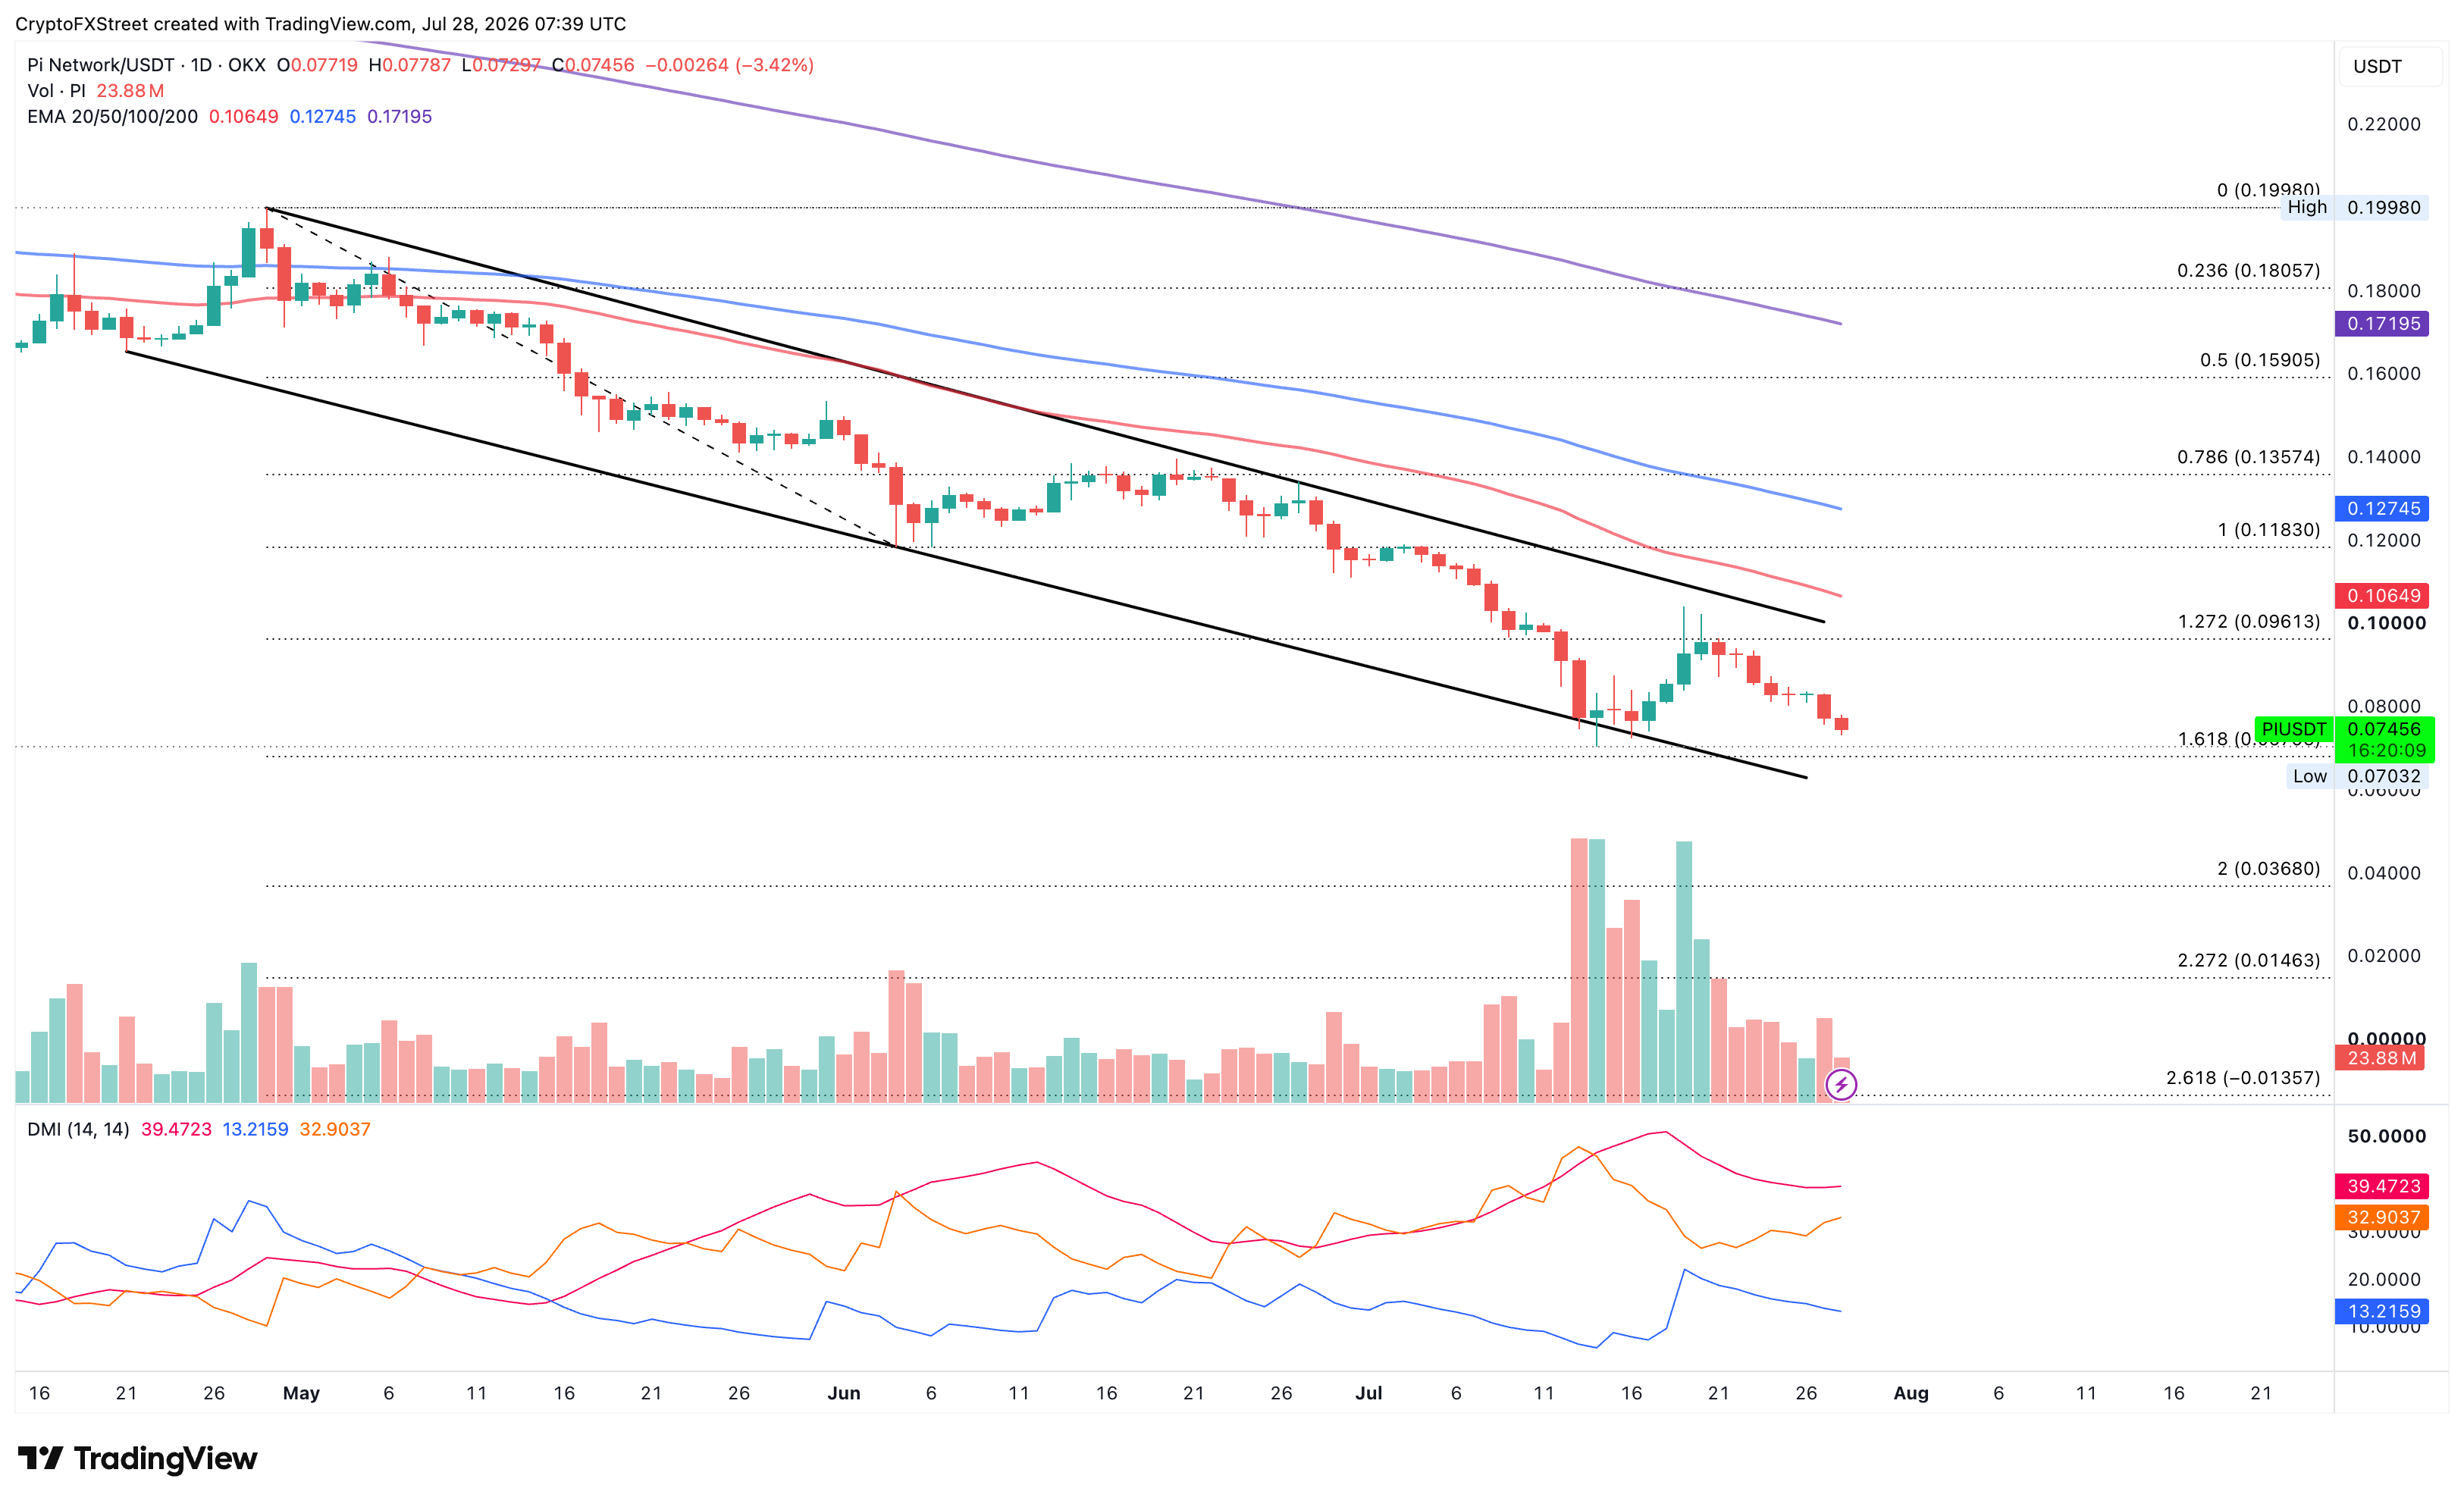
On the topside, initial resistance is located at the 127.2% Fibonacci extension level at $0.0961, followed by the overhead trendline near the $0.1000 psychological mark.
(The technical analysis of this story was written with the help of an AI tool. Know more.)
บทความยอดนิยม
1ดอลลาร์ออสเตรเลียมีแรงซื้อเข้ามาใกล้ระดับ 0.6850 เมื่อเทียบกับดอลลาร์สหรัฐ แนวโน้มยังไม่แน่นอน2ดอลลาร์แคนาดาอ่อนค่า แม้ราคาน้ำมันปรับตัวสูงขึ้น3เลเวอเรจของบิตคอยน์แตะเปอร์เซ็นไทล์ที่ 99 ขณะค่าสหสัมพันธ์กับ Nasdaq เพิ่มขึ้น4เงินเยนญี่ปุ่นเผชิญแรงกดดัน ขณะโอกาสที่เฟดจะขึ้นดอกเบี้ยหนุน USD/JPY ปรับตัวขึ้น5ยูโรเผชิญแรงกดดัน ขณะคาดการณ์เฟดขึ้นดอกเบี้ยครั้งใหญ่หนุนดอลลาร์สหรัฐ เทรดเดอร์รอข้อมูล CPI เยอรมนีและถ้อยแถลงเจ้าหน้าที่ ECB6กูลส์บีแห่งเฟด: ตัวเลข CPI เกือบถึงขั้นน่ากังวลในแง่เงินเฟ้อ7พอลสันแห่งเฟด: การปรับขึ้นอัตราดอกเบี้ยต่อไปอย่าง “ค่อยเป็นค่อยไป” เป็นแนวทางที่เหมาะสม เนื่องจากเงินเฟ้ออยู่ในระดับสูง8ราคาน้ำมันดิบ WTI ฟื้นตัวเหนือ 85.50 ดอลลาร์ แม้ความตึงเครียดในตะวันออกกลางผ่อนคลายลง9ธนาคารกลางจีน (PBOC) กำหนดอัตราอ้างอิง USD/CNY ที่ 6.7191 เทียบกับครั้งก่อนที่ 6.7167



เชื่อมต่อกับเรา









ติดต่อเรา
โทร: +61 2 8036 8388
แฟกซ์: +61 2 8036 8388
อีเมล: support@tmgm.com
เว็บไซต์: https://www.tmgmasia.com



ข้อมูลที่ให้ไว้บนเว็บไซต์นี้มีลักษณะเป็นข้อมูลทั่วไปเท่านั้น และไม่ถือเป็นคำแนะนำทางการเงินส่วนบุคคล ก่อนดำเนินการใด ๆ ตามข้อมูลบนเว็บไซต์นี้ คุณควรพิจารณาความเหมาะสมของข้อมูลดังกล่าวให้สอดคล้องกับวัตถุประสงค์ สถานะทางการเงิน และความต้องการของคุณ การลงทุนใน CFD และสัญญา FX Margin มีความเสี่ยงอย่างมีนัยสำคัญ และไม่เหมาะสำหรับนักลงทุนทุกคน คุณอาจสูญเสียเงินมากกว่าเงินฝากเริ่มต้นของคุณ คุณไม่ได้เป็นเจ้าของ หรือมีส่วนได้เสียใด ๆ ในสินทรัพย์อ้างอิง เราแนะนำให้คุณขอคำแนะนำอย่างเป็นอิสระ และตรวจสอบให้แน่ใจว่าคุณเข้าใจความเสี่ยงที่เกี่ยวข้องอย่างถ่องแท้ก่อนทำการซื้อขาย สิ่งสำคัญคือคุณต้องอ่านและพิจารณาเอกสารการเปิดเผยข้อมูลก่อนที่คุณจะได้มาซึ่งผลิตภัณฑ์ใด ๆ ที่ระบุไว้บนเว็บไซต์ ข้อมูลและโฆษณาที่นำเสนอบนเว็บไซต์นี้ไม่ได้มีวัตถุประสงค์เพื่อให้บุคคลใด ๆ ในประเทศหรือเขตอำนาจศาลใด ๆ ใช้งาน หากการใช้งานดังกล่าวขัดต่อกฎหมายและข้อบังคับท้องถิ่น ผลิตภัณฑ์และบริการที่นำเสนอบนเว็บไซต์นี้ไม่ได้มีไว้สำหรับผู้พำนักอาศัยในสหรัฐอเมริกา มาเลเซีย และประเทศไทย
TMGM ได้รับอนุญาตและอยู่ภายใต้การกำกับดูแลในหลายเขตอำนาจศาล
Trademax Australia Limited ซึ่งดำเนินธุรกิจในชื่อ TMGM ได้รับการกำกับดูแลโดย Australian Securities and Investments Commission (ASIC) หมายเลขใบอนุญาต AFSL 436416 และตั้งอยู่ที่ Level 28, One International Tower, 100 Barangaroo Avenue, 2000 Sydney, NSW Australia.
อีเมล: support@tmgm.com.au
Trademax Global Limited ซึ่งดำเนินธุรกิจในชื่อ TMGM ได้รับอนุญาตและอยู่ภายใต้การกำกับดูแลโดย Vanuatu Financial Services Commission (VFSC) หมายเลขทะเบียน 40356 และจดทะเบียนที่ 1276, Kumul Highway, Port Vila, Vanuatu, Republic of Vanuatu.
อีเมล: support@tmgm.com
Trademax Global Markets (SE) Limited, ดำเนินการภายใต้ชื่อ TMGM, ได้รับอนุญาตและอยู่ภายใต้การกำกับดูแลโดย Financial Services Authority (FSA) ของเซเชลส์ ภายใต้เลขที่ใบอนุญาต SD224 บริษัทจดทะเบียนที่ สำนักงานเลขที่ 13, Providence Estate ABIS Centre, เกาะมาเฮ, เซเชลส์
อีเมล: support@tmgm.com
Trademax Global Markets (International) Pty Ltd ซึ่งดำเนินธุรกิจในชื่อ TMGM ได้รับอนุญาตและอยู่ภายใต้การกำกับดูแลโดย Financial Services Commission, Mauritius (FSC) หมายเลขใบอนุญาต GB22201012 และจดทะเบียนที่ 33, Edith Cavell Street C/o IQ EQ Fund Services (Mauritius) Ltd Port Louis, 11324 Mauritius.
อีเมล: support@tmgm.com
ลิขสิทธิ์ © TMGM สงวนลิขสิทธิ์ทั้งหมด